

Abstract
The ECG is a primary diagnostic tool in patients suffering from heart disease, underscoring the importance of understanding factors contributing to normal and abnormal electrical patterns. Over the past few decades, transgenic mouse models have been increasingly used to study pathophysiological mechanisms of human heart diseases. In order to allow extrapolation of insights gained from murine models to the human condition, knowledge of the similarities and differences between the mouse and human ECG is of crucial importance. In this review, we briefly discuss the physiological mechanisms underlying differences between the baseline ECG of humans and mice, and provide a framework for understanding how these inherent differences are relevant to the interpretation of the mouse ECG during pathology and to the translation of the results from the mouse to man.
Introduction
In 1895, Einthoven first described the morphology the human electrocardiogram (ECG; Einthoven, 1895). Since then, the pattern of ventricular activation of the human heart has been mostly unravelled (Durrer et al. 1970) while the pattern of repolarization is still an area of intense investigation (reviewed in Antzelevitch, 2005 and Opthof et al. 2009) Eighty-three years after Einthoven's description of the human ECG, in 1968, Goldbarg and colleagues published the first detailed description of the mouse ECG (Goldbarg et al. 1968). The activation and repolarization patterns underlying the mouse ECG initially received little interest, as indicated by the relatively low number of publications on this topic during the seventies, eighties and nineties of the last century. However, in the last decade, interest has greatly increased, coinciding with the ability to use the mouse as a model to study cardiac conduction and repolarization abnormalities relevant to human gene mutations (London et al. 1998; Xu et al. 1999a; Arad et al. 2003; Sotoodehnia et al. 2010). Since then, many studies have been conducted to examine the patterns of activation and repolarization in the mouse heart and their relation to the ECG (Gussak et al. 2000; Nygren et al. 2000; Danik et al. 2002; Liu et al. 2004; Boukens et al. 2013; Speerschneider & Thomsen, 2013). The results of these investigations have revealed different mechanisms underlying the ECG of mice and men. Several of these differences are of crucial importance for interpretation of the mouse ECG and the extrapolation of the results to man (Kaese & Verheule, 2012).
In this review, we discuss how the relationship between ventricular activation and repolarization differs between humans and mice, and discuss how this manifests as differences on the surface ECG (Fig.1). We also discuss mechanisms underlying several human cardiac pathologies, including the Wolff–Parkinson–White (WPW) syndrome and heart failure, and how they appear on the ECG of relevant murine models. Finally, we briefly elaborate on how reentry-based arrhythmias manifest differently in mice and man.
Figure 1. Six lead ECG of a human and a mouse.
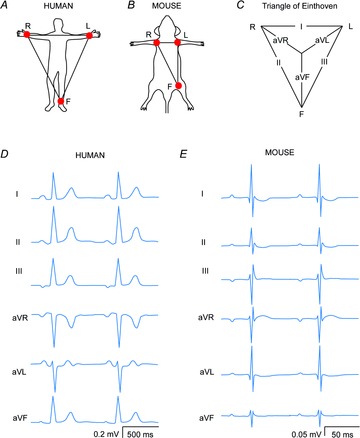
A and B, schematic drawings of the positions of the leads R, L and F in humans and mice, respectively. C, the triangle of Einthoven. D and E, schematic standard six lead ECGs of a human and a mouse, respectively.
Genesis of the mouse ECG
The action potential in man and mice
The heart rate of mice is on average ten times higher than the heart rate of men (Kaese & Verheule, 2012) Accordingly, the action potential of a mouse ventricular cardiomyocyte is brief. Furthermore, the action potential is triangular and lacks a distinctive plateau phase featured by the human ventricular action potential. This observation can be explained by the different ionic currents responsible for shaping the action potential in human and mice (reviewed in detail by Nerbonne & Kass, 2005; Fig.2C). Therefore, changes in specific current densities can have electrophysiological consequences in one species but not in the other. For instance, IKs and IKr (slow and rapid activating components of the delayed rectifier potassium current, IK) are of crucial importance for repolarization during phase 2 and phase 3 of the action potential in human myocytes (Li et al. 1996), as evidenced by the fact that alterations in these currents can give rise to the long QT1 and long QT2 syndromes (Bokil et al. 2010), whereas IKs and IKr currents are negligible in murine myocytes (Xu et al. 1999b; Clancy & Rudy, 2002). Other prominent differences lie in IKur (IK,slow1) and Ito (cardiac transient outward IK). In mice, IKur gives rise to the fast initial repolarization phase (Li et al. 2004) while in human ventricular myocytes this current has not been detected. In addition, the magnitude of Ito is much larger in mice than in human, which makes the study of mutations in genes affecting the Ito current, like the DPP6 gene, difficult to investigate in mice (Alders et al. 2009). In contrast, IK1 contributes less to repolarization in murine myocytes than in human myocytes (Lopatin & Nichols, 2001). These differences should be taken into account when the electrophysiological effect of a specific ion channel mutation is studied in genetic or pharmacologically manipulated mice, and when comparisons are made with the human condition. In addition, when the comparison is made between the morphology of the action potential and the ECG one needs to realize, of course, that the sequences of activation and repolarization contribute to the genesis of the QRS complex and the T wave, respectively (Durrer et al. 1970; Meijborg et al. 2014).
Figure 2. The action potentials of isolated human and murine ventricular myocytes in relation to the species-specific patterns on the electrocardiogram.
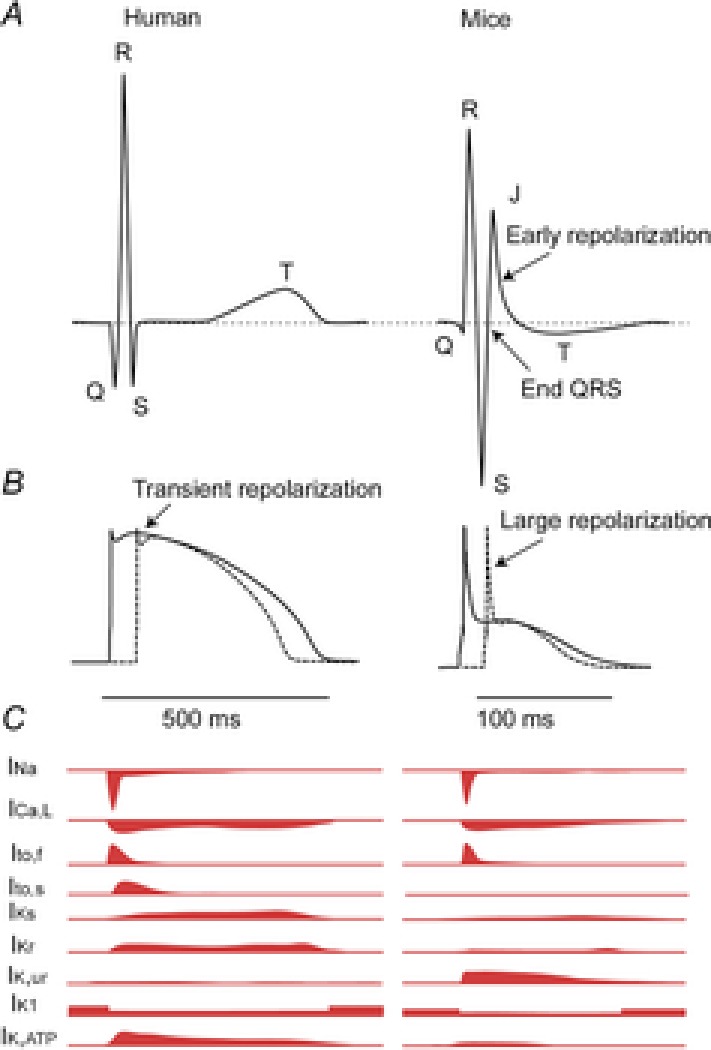
A, schematic representation of the human (left) and murine (right) ECG. Note that in the mouse the ST segment is not isoelectric, but instead has a characteristic J wave that represents early repolarization. B, schematic action potentials representing the myocardium activated earliest (continuous line) and latest (dashed line) in human (left) and mouse (right). Note that the murine action potential has a large initial repolarization phase and a plateau phase at a lower membrane potential. C, schematic representation of the different currents underlying the action potential in humans (left) and mice (right) Modified from Nerbonne & Kass (2005). This figure is inspired by Salama & London (2007).
Morphology of the mouse ECG
In humans the standard six lead ECG is recorded from the right arm (R), left arm (L) and the left leg (F). In mice these electrodes are usually connected to the left and right armpit and the left groin. From these recordings, leads I, II, III and the augmented R (aVR), L (aVL) and F (aVF) leads can be calculated (Fig.1C). The P wave in mice represents atrial activation and has a similar morphology to the P wave in humans (Fig.1D). In man the PR segment is non-isoelectric and may represent atrial repolarization (Sprague & White, 1925; Holmqvist et al. 2009). In some cases the P wave in mice is followed by a small negative deflection and others have proposed that this deflection represents atrial repolarization. We think that the negative deflection occurs when the atria are not positioned in the middle of lead L and R (authors’ own observation). However, experiments are required to clarify what this negative deflection in mice represents.
The difference in ventricular action potential shape between the human and mouse has major consequences for the morphology of the ECG (Fig.2). The most prominent difference between the human and the mouse ECG is the presence of a J wave and the absence of an isoelectric ST segment in the mice (Boukens et al. 2013; Speerschneider & Thomsen, 2013). A commonly used criterion for the end of the QRS complex in mice is the moment where the S wave intersects the isoelectric line. By definition, this moment also marks the onset of the J wave that ends at the transition to the negative T wave. The T wave in mice ends when it returns to the isoelectric line. It is a matter of debate whether the tangent method should be applied for the measurement of the end of the T wave.
Idiosyncrasies of ventricular activation and the QRS complex in mice
The onset of ventricular activation occurs at the top of the ventricular septum in mice
In 1970, Durrer et al. reconstructed the activation pattern of the human heart (Durrer et al. 1970). The description was of major importance for understanding the morphology of the QRS complex across the various ECG leads. They showed that initial ventricular activation was on the left side of the ventricular septum and corresponded with the Q wave in leads I, II, aVL, V5 and V6 on the ECG (and the R waves in leads III, aVF, aVR, V1, V2, V3 and V4). Unlike in man, the ventricular myocardium at the top of the septum in mice is in direct contact with the His bundle due, at least in part, to less fibrous insulation (Van Rijen et al. 2001). Consequently, the onset of ventricular activation occurs at the top of the septum (Van Rijen et al. 2001). As a result, the electrical vector during the onset of the QRS complex is directed towards the apical region of the heart (Boukens et al. 2013). Therefore, malformation of the ventricular conduction system in genetically modified murine models would be expected to manifest differently on the ECG. Specifically, one might expect that conduction block in both the left and the right bundles would result in delayed ventricular activation in man, but might not produce a similar effect in mice.
The end of the QRS complex in mice?
The morphology of the QRS complex is different in mice compared to most other mammals. The most prominent singularity is that the S wave is immediately followed by a J (or R) wave. The end of the J wave has been often used to signify the end of the QRS complex (Salama & London, 2007). However, as early as 1968, Goldbarg promoted the idea that the J wave represents repolarization and should not be included in the measurement of the duration of the QRS complex (Goldbarg et al. 1968). If one includes the J wave in the calculation of QRS duration, this results in a variability of up to 30 ms across leads (Kaese & Verheule, 2012). However, if the J wave is excluded and the end of the QRS complex is determined by the point where the S wave intersects with the isoelectric line, QRS duration can still vary anywhere between 9 and 17 ms across leads (Danik et al. 2002). We recently showed that the last moment of murine ventricular activation, as determined by epicardial optical mapping technique, coincides with the end of the QRS complex in lead III and aVF (Boukens et al. 2013). We propose, therefore, that the end of the QRS complex can best be determined in lead III or aVF, and that the inclusion of the J wave would overestimate total ventricular activation time due to early repolarization (discussed further below).
QRS duration is not an accurate measure for ventricular conduction velocity
In humans, slow conduction in the ventricle leads to prolongation of the QRS duration and is a risk factor for ventricular fibrillation (Elhendy et al. 2005; Desai et al. 2006). However, a prolonged QRS duration is not always the result of slow conduction and can also represent an increase in myocardial mass in combination with normal or even increased conduction velocity (for example, as a result of cardiac hypertrophy; Wiegerinck et al. 2006). The major determinant for ventricular conduction velocity is the cardiac sodium current, INa, which is carried by channels encoded by Scn5a (sodium channel, voltage-gated, type V, α). Since mutations in Scn5a are associated with several diseases of conduction in humans (Wilde & Brugada, 2011), various transgenic mouse models with mutations in the Scn5a gene have been generated (Remme et al. 2006). In these mouse models, ventricular conduction is slowed and QRS duration is slightly prolonged. We recently showed that when ventricular conduction is slowed, the murine QRS complex ends before ventricular activation is completed. This is due, at least in part, to effects of early repolarization, as discussed further below (Fig.3A and B; Boukens et al. 2013). In this scenario, the QRS duration underestimates the total activation time of the heart. Therefore, for the study of ventricular conduction in mice, a pseudo-ECG and (optical or electrical) total ventricular mapping (during sinus rhythm) should be used to validate electrocardiographic criteria used for analysis in this specific mouse model.
Figure 3. The QRS complex is not a good measure of total ventricular activation time in mice.
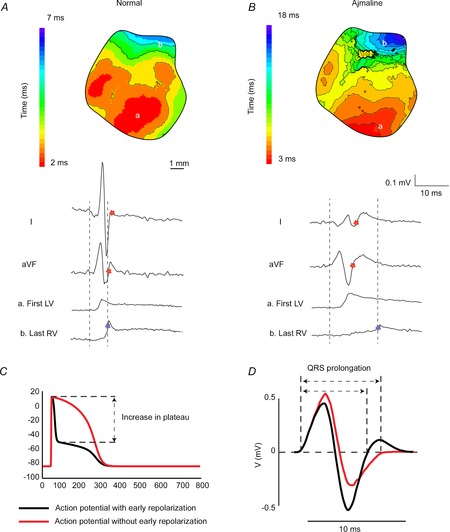
A, during normal cardiac activation sequence the end of ventricular activation corresponds to the end of the QRS complex in aVF. B, when conduction in the myocardium is slow (Ajmaline) then the QRS complex (red star) ends before final ventricular activation (blue star). ‘First LV’ and ‘last RV’ represent optical signals from the epicardial regions denoted in the reconstructed activation patterns. C, a simulated action potential with (black), and without (red), early repolarization. D, a calculated ECG based on action potentials simulated with, and without, early repolarization as shown in C. Note that altering early repolarization can change QRS duration even when ventricular conduction is not altered. Modified from Boukens et al. (2013).
Prolonged early repolarization may increase QRS duration
In humans, ventricular activation and repolarization are separated by an isoelectric ST segment due to the plateau phase of the ventricular action potential (Freud, 1972). During the plateau phase, no extracellular current flows and this is reflected in the absence of voltage changes on the body surface. Phase 1 repolarization of the action potential in humans and other large mammals (like dogs) is merely transient and accounts for only a small change in transmembrane potential (Fig.2B, left, arrow). In mice, however, phase 1 is more prominent and the plateau potential is more negative than in humans (Fig.2B, right, arrow). Thus, the upstroke of the murine action potential is immediately followed by a fast downstroke (phase 1, early repolarization) and creates a large negative vector that partly counterbalances the positive vector generated during activation. As a result, significant repolarization already occurs before ventricular activation has completed (London, 2001; Boukens et al. 2013). Therefore, in mice, the QRS complex is composed of not only ventricular activation, but also early repolarization (Boukens et al. 2013). Of importance, these two vectors are directed in opposite directions leading to annihilation in some ECG leads (Boukens et al. 2013). This is important because prolongation of action potential duration at 20% of repolarization by 10 or 20% (APD10/20) can reduce the negative vector and result in less counterbalancing of the activation vector. We have addressed this problem by using a computer model incorporating the human ventricular action potential morphology allowing us to calculate the body surface ECG (ECGSIM; van Oosterom & Oostendorp, 2004). We only adjusted the shape (but not the duration) of the underlying action potential. The model showed that the QRS duration prolongs when the plateau phase is set to a less negative potential (Fig.3C and D; Boukens et al. 2013). This indicates that in mice a reduced initial phase 1 repolarization, for example by APD10/20 prolongation, can lead to QRS prolongation, even when conduction is not altered.
Left bundle branch block does not increase total ventricular activation time in mice
In the human heart, on average the last moment of activation occurs at the same moment in the left and right ventricular base (Durrer et al. 1970). In contrast, in mice the total activation time of the left ventricle is shorter than that of the right ventricle (Boukens et al. 2013), most likely due to a more developed His-Purkinje system in the left ventricular myocardium when compared with the right ventricular myocardium (Miquerol et al. 2004). Because of this inequality, delayed left ventricular activation does not lead to a linearly related increase in QRS duration calculated from the mouse ECG (Boukens et al. 2013). This is important when interpreting studies where a (transgenic) mouse model is used to investigate the bundle branches or Purkinje fibres (Miquerol et al. 2004; Zhang et al. 2011). In these situations, mapping of the left and right ventricular activation patterns may unmask bundle branch block that is undetected by electrocardiography.
The T wave
The end of the T wave
The T wave represents heterogeneity in repolarization throughout the heart (Meijborg et al. 2014). In mice, heterogeneity mainly occurs between the right and left ventricular myocardium (Boukens et al. 2013). This leads to an electrical vector directed from the left to the right, giving rise to a positive T wave in aVR and a negative T wave in I, II and aVL (Fig.1E). The amplitude of the T wave is relatively small in mice due to the absence of a plateau phase in the action potential, which has raised the concern that the mouse T wave is not a good representation of repolarization (Danik et al. 2002). However, a recent study showed that APD at 90% of repolarization coincides well with the end of the ‘J’ wave (the authors describe this as an entirely positive T wave) when the T wave is absent or to the maximum negative amplitude of the T wave (Zhang et al. 2014). Others have shown that the end of ventricular repolarization as determined by optical mapping techniques coincides with the end of the T wave on ECG, (Boukens et al. 2013; Speerschneider & Thomsen, 2013), which is most accurately determined using the tangent method (Lepeschkin & Surawicz, 1952; Boukens et al. 2013; Speerschneider & Thomsen, 2013). Taking all the evidence into consideration, the end of the T wave in mice, despite its low amplitude, is a good measure of the end of ventricular repolarization.
QT interval correction for heart rate during anaesthesia
In mice, as in humans, the action potential and QT interval shorten when heart rate increases (Mitchell et al. 1998; Knollmann et al. 2007). To compare QT intervals measured from different heart rates, Bazett's formula can be used (Bazett, 1920) with an adjustment in mice: (QT/sqrt(RR/100); Mitchell et al. 1998). However, it has recently been shown using this formula that the QT interval is not adequately corrected with variable heart rates during anaesthesia with isoflurane (Fig.4A), since plotting QTc against RR does not yield a horizontal line (Speerschneider & Thomsen, 2013). Using the modified Bazett's formula in this situation will lead to an underestimation of the QT interval and introduces a systematic measurement error. Thus, when the mouse is used for the studying repolarization diseases like the long QT syndrome (Salama & London, 2007), care should be taken with heart rate correction for QT intervals. In that situation the QT interval, and not the QTc interval, might give sufficient insight into ventricular repolarization. Alternatively, a disease-specific correction formula should be used.
Figure 4. The mouse ECG in different situations.
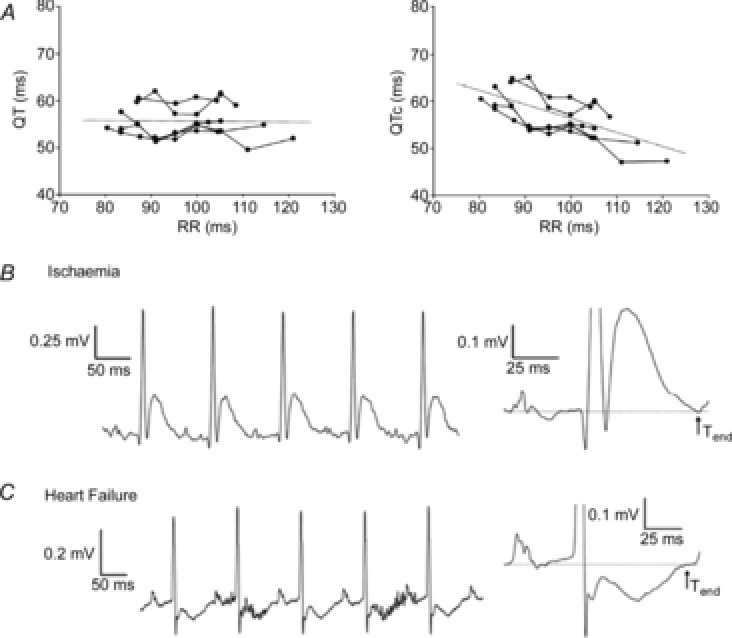
A, non-corrected QT (left) and corrected QT intervals (right) in all mice (n = 6) at each paced cycle length. Linear regressions of the QT–RR and QTc–RR relationships of the individual mice were averaged to derive the two general trend lines. The trend lines are expanded for illustration purposes. B, unprocessed (left) and averaged electrocardiogram (ECG; right) traces from lead II recorded during ischaemia. Ischaemia produced a prolonged QRS interval and a JT segment with a positive, large T wave (n = 6). C, unprocessed (left) and averaged electrocardiogram (ECG; right) traces from lead II recorded in mice with heart failure. Mice with heart failure showed a significant prolongation of the QRS and QT interval compared with sham-operated mice (data not shown). In addition, mice with heart failure presented entirely negative and inseparable J and T waves (n = 6). However, the end of the T wave was still visible compared with baseline ECG recordings. Modified from Speerschneider & Thomsen (2013).
The ECG in mouse models of disease
Acute myocardial ischaemia is reflected by S amplitude reduction, and not ST elevation, in mice
Acute myocardial ischaemia in man is diagnosed by an ST segment elevation (Janse, 1986). The underlying basis for ST segment elevation is caused by (1) a diastolic current that flows from the ischaemic myocardium to the healthy myocardium causing depression of the TQ segment, represented as ST segment elevation on the ECG when measured with common amplified-current (AC) acquisition systems, and (2) a shortening of the action potential duration and amplitude in the ischaemic myocardium resulting in a systolic current that flows from the healthy myocardium to the ischaemic myocardium (Janse, 2007). In mice, similar changes occur on the cellular level during ischaemia when compared with larger mammals (Saito et al. 2005). The resting membrane potential depolarizes, APD10 and APD20 prolong, whereas APD90 shortens (Saito et al. 2005). However, despite similar local electrical events, the overall changes on the body surface ECG differ between mice and man. As we mentioned above, in the mouse ECG the S wave is directly followed by a J wave that transfers into a negative T wave. It therefore renders the term ‘ST-segment elevation’ equivocal. During acute myocardial ischaemia in mice the S wave amplitude decreases in amplitude and is directly followed by an abnormal J wave and an inverted T wave ECG (Fig.4B; Gehrmann et al. 2001; Stables & Curtis, 2009).
In man, the majority of myocardial infarctions involve less than 30% of the left ventricular mass (Gibbons et al. 2004). In experimental models, ischaemia is usually generated by occlusion of the left anterior descending artery (LAD). This leads to an average infarct size of approximately 25% of the left ventricular mass in large animal models, comparable to that of humans (Coronel et al. 2007; Crisostomo et al. 2013). In mice, however, the average size of the ischaemic myocardium is much larger and represents up to 50% of the left ventricular mass (Elrod et al. 2007; Pol et al. 2011; Marsman et al. 2013; Methner et al. 2013). This discrepancy can have major effects on the mechanism of arrhythmias. On one hand, the injury current is expected to be relatively larger in mice compared with humans. On the other hand, if the inexcitable ischaemic myocardial mass is too substantial, the remaining healthy myocardium may not be large enough to support a reentrant pathway, which is a common mechanism for post-infarction ventricular arrhythmias in humans.
In murine heart failure models, the mechanisms of the ECG changes are not fully understood
The loss of myocardial tissue after an infarction can lead to heart failure. In man, the ECG during heart failure is characterized by an increased QRS duration and QT interval and the appearance of T wave inversion. These changes are caused by action potential prolongation and slower upstroke velocity, but may also be generated by the underlying cause of heart failure (for example, by the presence of infarcted tissue leading to delayed activation; Coronel et al. 2013). In both mice and man, the ventricular action potential prolongs during heart failure (Toischer et al. 2013). In mice, like in humans, the cellular electrophysiological remodelling manifests as QT prolongation and T wave inversion on the ECG (Fig.4C; Harris et al. 2012; Speerschneider & Thomsen, 2013). Although in humans the QRS duration remains a good measure for total ventricular activation time, in mice, the abnormal morphology of the J wave in heart failure makes it difficult to monitor conduction using the ECG. In contrast, the QT still relates to the end of ventricular repolarization during heart failure (Speerschneider & Thomsen, 2013).
The resemblance of the mouse ECG to a Brugada-like pattern bears no pathophysiological correlation
The Brugada syndrome is a cardiac pathology characterized by right precordial ST-segment elevation (J wave) followed by a negative T wave, and patients with this syndrome have a high incidence of ventricular fibrillation (Brugada & Brugada, 1992). The mouse ECG bears a resemblance to the ECG of patients with the Brugada syndrome. For this reason, mice have been proposed as a suitable model for the study of the Brugada syndrome (Gussak et al. 2000). In mice, the J wave results from heterogeneities in early repolarization, and the T wave is the result of a repolarization vector that is directed from the left ventricle to the right ventricle (Boukens et al. 2013). The mechanism underlying J-point elevation in patients with the Brugada syndrome is debated, but is most likely the result of conduction delay or block due to the presence of subtle structural abnormalities (Coronel et al. 2005; Hoogendijk et al. 2010). Therefore, we emphasize that the presence of similarities in ECG characteristics do not merit using the mouse as a model for the Brugada syndrome.
Mice as a model to study repolarization disease
One of the most common repolarization diseases is the long QT syndrome represented on the ECG of patients by long QT intervals (QT > 450 ms). These patients experience syncope and sudden cardiac death due to Torsade de pointes arrhythmias (Priori et al. 2004). The congenital long QT syndrome is characterized by mutations in genes encoding proteins that carry the major repolarizing K+ currents (reviewed in Lu & Kass, 2010) A variety of mouse models have been generated to study the effect of these mutations on electrophysiology, which has contributed to our understanding of the disease (reviewed in Salama & London, 2007). However, extrapolation of findings in mice to humans should be done with care. As described earlier, the set of ion currents that underlie repolarization in mice is different from that in humans (Fig.2A; Nerbonne & Kass, 2005). As a consequence, a mutation affecting, for example, IKs will not alter murine repolarization whereas it leads to long QT syndrome in man (Li et al. 1996; Xu et al. 1999b). Furthermore, the mechanism underlying Torsade de pointes arrhythmias may involve both focal activities and reentry (Boulaksil et al. 2011). Multiple reentrant wavelets manifest dissimilarly in human and mice due to the difference in size of the heart and different refractory periods. This hampers investigation of the relation between a genetic mutation and the mechanism of arrhythmias in long QT patients.
Another cardiac pathology considered to be a repolarization disease is the ‘early repolarization’ syndrome. In this syndrome patients show QRS slurring or notching in the inferior or lateral leads (Haissaguerre et al. 2008). The mechanism underlying this phenomenon is unknown and may locally increase phase 1 repolarization or locally delay ventricular activation. These hypotheses are difficult to investigate in mice because (1) the action potential of the mouse already has a large phase 1 repolarization and (2) in mice early repolarization obscures the end of the QRS complex (Boukens et al. 2013).
Arrhythmias that manifest differently in mice and man
Many mouse models of WPW do not have delta waves
The Wolff-Parkinson-White (WPW) syndrome is characterized by ventricular preexcitation, palpitations, and AV (atrioventricular) reentrant tachycardia (Wolff et al. 1930). The characteristic ECG pattern in WPW syndrome is a short PR interval, a wide QRS complex, and the presence of a delta wave due to fusion beats resulting from activation of the ventricular myocardium by an accessory pathway (usually at the LV base) as well as conduction through the AV node/His bundle (Fig.5A and B). In mice, AV delay (∼35 ms) is relatively long in comparison with the total activation time of the ventricles via an accessory pathway (∼15–20 ms; Aanhaanen et al. 2011). Therefore, in mouse models with preexcitation, it is possible to completely activate the ventricles via the accessory pathway before the impulse exits the normal AV conduction system (Fig.5B). To demonstrate this point, we have compared the PS interval of six mouse models with preexcitation with the PR interval of their controls.(Arad et al. 2003; Gaussin et al. 2005; Sidhu et al. 2005; Davies et al. 2006; Wolf et al. 2008; Aanhaanen et al. 2011; Rentschler et al. 2011) and found that the PS time was significantly shorter in preexcited mice than the PR interval in the corresponding control cohorts (25.6 ± 4.7 ms vs. 37.5 ± 1.0 ms, respectively, P < 0.05; Fig.5C). This means that the QRS complex in the mutant mice ends before the start of the QRS complex in control mice, indicating that with preexcitation, even if AV delay is not also prolonged (as is often the case in this syndrome), the entire ventricle can be completely activated via an accessory pathway (Fig.5E). This is completely different from what is observed in patients with WPW (Wolff et al. 1930; Durrer et al. 1967).
Figure 5. Preexcitation and atrioventricular tachycardia in the mouse heart.
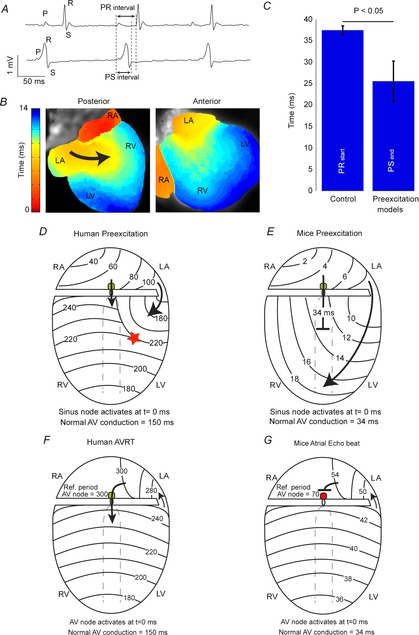
A, an ECG recorded from wild-type (upper) and aMyh6-cre;Tbx2fl/fl mice (lower) showing ventricular preexcitation. B, the reconstructed activation pattern from a sinus beat recorded from a aMyh6-cre;Tbx2fl/fl mouse. Note that the ventricle is completely activated via the accessory pathway and that no collision of two waves can be detected. C, a bar graph showing the average PR interval of control mice and the average PSend interval in mice models with preexcitation (Arad et al. 2003; Gaussin et al. 2005; Sidhu et al. 2005; Davies et al. 2006; Wolf et al. 2008; Aanhaanen et al. 2011). Note that the QRS complex in the mutant mice ends before the start of the QRS complex in the control mice. D and E, schematic representations of ventricular activation during preexcitation in human and mice hearts, respectively. F, a schematic representation of atrioventricular reentry tachycardia in human heart. G, atrial echo beat in mouse. Modified from Aanhaanen et al. (2011) and Durrer et al. (1967).
Sustained atrioventricular reentry (circus movement tachycardia) is difficult to provoke in mice
In 1913, Mines first suggested that an accessory connection between the atrium and the ventricle could generate a pathway for atrioventricular reentry and might explain the tachycardia seen in WPW patients (Mines, 1913). In order to sustain a reentrant pathway that includes the AV node, the total conduction time of the reentrant circuit (conduction over the accessory pathway, through the AV node and ventricle) must be longer than the refractory period of the AV node. In patients with WPW, reentrant circuits can easily be established because the refractory period of the AV node (∼300 ms; Durrer et al. 1967; Wellens et al. 1974) is relatively short in comparison to the cycle length of the tachycardia (150 beats min–1 = 400 ms interval). For example: in humans, total ventricular activation time is ∼100 ms, and conduction delay through the AV node varies between 150 and 200 ms. An added conduction time through the accessory pathway longer than ∼40–60 ms (as clinically observed; Durrer et al. 1967; Wellens et al. 1974) would in some cases exceed the refractory period of the AV node (200 + 100 + 60 ms compared to 300 ms in man), would allow for reexcitation of the AV node, thereby supporting a reentrant tachycardia (Fig.5E). In most mouse models of ventricular preexcitation, atrioventricular reentrant tachycardias are more difficult to provoke, probably due, at least in part, to the relatively long refractory period of the AV node (∼65 ms; VanderBrink et al. 1999). The sum of the total ventricular activation time (∼10 ms), AV delay (35 ms) and conduction through a typical accessory pathway (5–10 ms) is shorter than the AV node refractory period (10 + 35 + 10 ms compared to 65 ms; VanderBrink et al. 1999; Aanhaanen et al. 2011). Therefore, in general, premature ventricular stimulation in mouse models of preexcitation induces only a single atrial echo beat in mice (Fig.5F; VanderBrink et al. 1999; Aanhaanen et al. 2011). However, when AV conduction is sufficiently prolonged or AV nodal refractoriness is shortened, atrioventricular reentry tachycardia can be sporadically provoked (Sidhu et al. 2005).
Why are mice less susceptible to reentrant arrhythmias than humans?
Functional reentry does not require an anatomical obstacle (Allessie et al. 1977), but rather depends on the length of the path and size of the tissue (Garrey, 1914). The length of the path, or wavelength, is the mathematical product of the refractory period and conduction velocity (Wiener & Rosenblueth, 1946). It has been suggested that the mouse heart may not be large enough to support a reentrant pathway; however, very slow conduction in the vicinity of the centre of a rotor would allow reentry to take place over a small area (Vaidya et al. 1999; reviewed in Kaese & Verheule, 2012) Indeed, many studies have demonstrated reentrant-based arrhythmias in mice (Fig.6; Salama & London, 2007; Fabritz et al. 2011). However, in healthy large animals (including pig and dog), as well as humans, reentry can always be induced by burst pacing with multiple ventricular premature stimuli (Wellens et al. 1985; Walker et al. 1988; Curtis et al. 2013). In mice, however, reentry can only be induced in a small fraction of healthy hearts via this method, and episodes of ventricular fibrillation usually have a short duration and terminate spontaneously (Walker et al. 1988; Curtis et al. 2013). This is true for atrial arrhythmias as well. Mutations that cause atrial fibrillation in humans will often only lead to atrial tachycardia in mice (Patel, 2010). In general, the small tissue mass most likely explains the difficulty of inducing ventricular or atrial arrhythmias in the mouse heart (Mines, 1913; Garrey, 1914).
Figure 6. Reentry in the mouse heart.
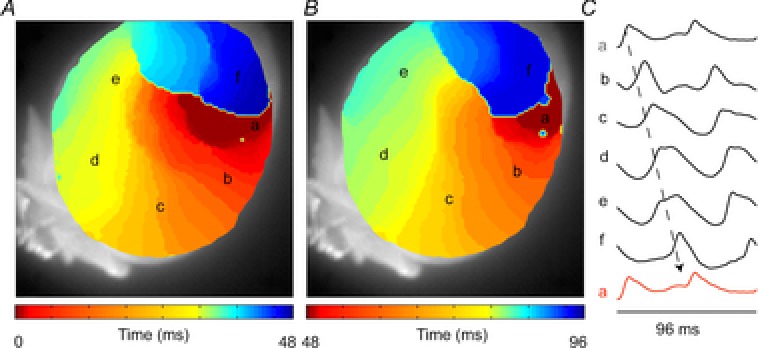
A and B, reconstructed activation pattern in which one activation front (A) activates the same area for the second time (B). C, isolated action potentials corresponding to the area indicated by the letters in A and B (authors’ own observations.)
Conclusion
The mouse is the most widely used experimental animal in cardiovascular research, due at least in part to the ease of modifying its genome. The use of genetically modified murine models to study human cardiac conduction and complex human arrhythmias should be practised with care, and particular attention should be paid to the intrinsic species-specific differences that influence arrhythmogenesis.
Acknowledgments
We thank Dr W. T. Aanhaanen for constructive discussions.
Glossary
- APD
action potential duration
- AV
atrioventricular
- ECG
electrocardiogram
- F
ECG lead from left leg
- L
ECG lead from left arm
- R
ECG lead from right arm
- WPW
Wolff–Parkinson–White (syndrome)
Biographies
 Bas J. Boukens was born in Hoorn on December 7, 1982. After studying Biomedical Sciences at the University of Utrecht, he started towork on his PhD thesis at the Heart Failure Research Center, University of Amsterdam. He defended his thesis with honours in 2012. Then he worked as a postdoctoral researcher at the Department of Anatomy, Embryology and Physiology, University of Amsterdam. He is currently a research scientist at the department of Biomedical Engineering, Washington University, St Louis. The goal of his research is to understand the molecular and developmental mechanism underlying arrhythmias.
 Ruben Coronel was born in Amsterdam in 1956. He studied Medicine at the University of Amsterdam and has been a staff member of the Department of Clinical and Experimental Cardiology, University of Amsterdam since 1988, becoming Associate Professor in 2005. From 1995 to 2003 he was Associate Editor of Cardiovascular Research and served as Deputy Editor and Editor-in-Chief of Medical and Biological Engineering and Computing from 2005 to 2012. He is launching editor of Frontiers in Cardiac Electrophysiology. Since 2013 he has been Invited Professor at the L'Institut de RYthmologie et de modélisation Cardiaque (LIRYC), Université Bordeaux Segalen, Bordeaux, France. The main focus of his research is the mechanism of arrhythmias.
Additional information
Author contributions
None declared.
Funding
Dr Ruben Coronel is supported by Marató de TV3. Dr Rentschler holds a Career Award for Medical Scientists from the Burroughs Wellcome Fund, and NHLBI K08 HL107449 (SR).
References
- Aanhaanen WT, Boukens BJ, Sizarov A, Wakker V, de Gier-de VC, van Ginneken AC, Moorman AF, Coronel R. Christoffels VM. Defective Tbx2-dependent patterning of the atrioventricular canal myocardium causes accessory pathway formation in mice. J Clin Invest. 2011;121:534–544. doi: 10.1172/JCI44350. [DOI] [PMC free article] [PubMed] [Google Scholar]
- Alders M, Koopmann TT, Christiaans I, Postema PG, Beekman L, Tanck MW, Zeppenfeld K, Loh P, Koch KT, Demolombe S, Mannens MM, et al. Haplotype-sharing analysis implicates chromosome 7q36 harboring DPP6 in familial idiopathic ventricular fibrillation. Am J Hum Genet. 2009;84:468–476. doi: 10.1016/j.ajhg.2009.02.009. [DOI] [PMC free article] [PubMed] [Google Scholar]
- Allessie MA, Bonke FI. Schopman FJ. Circus movement in rabbit atrial muscle as a mechanism of tachycardia. III. The “leading circle” concept: a new model of circus movement in cardiac tissue without the involvement of an anatomical obstacle. Circ Res. 1977;41:9–18. doi: 10.1161/01.res.41.1.9. [DOI] [PubMed] [Google Scholar]
- Antzelevitch C. Cardiac repolarization. The long and short of it. Europace. 2005;7:S3–S9. doi: 10.1016/j.eupc.2005.05.010. [DOI] [PMC free article] [PubMed] [Google Scholar]
- Arad M, Moskowitz IP, Patel VV, Ahmad F, Perez-Atayde AR, Sawyer DB, Walter M, Li GH, Burgon PG, Maguire CT, et al. Transgenic mice overexpressing mutant PRKAG2 define the cause of Wolff–Parkinson–White syndrome in glycogen storage cardiomyopathy. Circulation. 2003;107:2850–2856. doi: 10.1161/01.CIR.0000075270.13497.2B. [DOI] [PubMed] [Google Scholar]
- Bazett HC. An analysis of the time-relations of electrocardiograms. Heart. 1920;7:17. [Google Scholar]
- Bokil NJ, Baisden JM, Radford DJ. Summers KM. Molecular genetics of long QT syndrome. Mol Genet Metab. 2010;101:1–8. doi: 10.1016/j.ymgme.2010.05.011. [DOI] [PubMed] [Google Scholar]
- Boukens BJ, Hoogendijk MG, Verkerk AO, Linnenbank A, van Dam P, Remme CA, Fiolet JW, Opthof T, Christoffels VM. Coronel R. Early repolarization in mice causes overestimation of ventricular activation time by the QRS duration. Cardiovasc Res. 2013;97:182–191. doi: 10.1093/cvr/cvs299. [DOI] [PubMed] [Google Scholar]
- Boulaksil M, Jungschleger JG, Antoons G, Houtman MJ, de Boer TP, Wilders R, Beekman JD, Maessen JG, van der Hulst FF, van der Heyden MA, et al. Drug-induced torsade de pointes arrhythmias in the chronic AV block dog are perpetuated by focal activity. Circ Arrhythmia Electrophysiol. 2011;4:566–576. doi: 10.1161/CIRCEP.110.958991. [DOI] [PubMed] [Google Scholar]
- Brugada P. Brugada J. Right bundle branch block, persistent ST segment elevation and sudden cardiac death: a distinct clinical and electrocardiographic syndrome. A multicenter report. J Am Coll Cardiol. 1992;20:1391–1396. doi: 10.1016/0735-1097(92)90253-j. [DOI] [PubMed] [Google Scholar]
- Clancy CE. Rudy Y. Na+ channel mutation that causes both Brugada and long-QT syndrome phenotypes: a simulation study of mechanism. Circulation. 2002;105:1208–1213. doi: 10.1161/hc1002.105183. [DOI] [PMC free article] [PubMed] [Google Scholar]
- Coronel R, Casini S, Koopmann TT, Wilms-Schopman FJ, Verkerk AO, de Groot JR, Bhuiyan Z, Bezzina CR, Veldkamp MW, Linnenbank AC, et al. Right ventricular fibrosis and conduction delay in a patient with clinical signs of Brugada syndrome: a combined electrophysiological, genetic, histopathologic, and computational study. Circulation. 2005;112:2769–2777. doi: 10.1161/CIRCULATIONAHA.105.532614. [DOI] [PubMed] [Google Scholar]
- Coronel R, Wilders R, Verkerk AO, Wiegerinck RF, Benoist D. Bernus O. Electrophysiological changes in heart failure and their implications for arrhythmogenesis. Biochim Biophys Acta. 2013 doi: 10.1016/j.bbadis.2013.04.002. [DOI] [PubMed] [Google Scholar]
- Coronel R, Wilms-Schopman FJ, Den Ruijter HM, Belterman CN, Schumacher CA, Opthof T, Hovenier R, Lemmens AG, Terpstra AH, Katan MB. Zock P. Dietary n-3 fatty acids promote arrhythmias during acute regional myocardial ischemia in isolated pig hearts. Cardiovasc Res. 2007;73:386–394. doi: 10.1016/j.cardiores.2006.10.006. [DOI] [PubMed] [Google Scholar]
- Crisostomo V, Maestre J, Maynar M, Sun F, Baez-Diaz C, Uson J. Sanchez-Margallo FM. Development of a closed chest model of chronic myocardial infarction in swine: magnetic resonance imaging and pathological evaluation. ISRN Cardiol. 2013;2013:781762. doi: 10.1155/2013/781762. [DOI] [PMC free article] [PubMed] [Google Scholar]
- Curtis MJ, Hancox JC, Farkas A, Wainwright CL, Stables CL, Saint DA, Clements-Jewery H, Lambiase PD, Billman GE, Janse MJ, et al. The Lambeth Conventions (II): guidelines for the study of animal and human ventricular and supraventricular arrhythmias. Pharmacol Ther. 2013;139:213–248. doi: 10.1016/j.pharmthera.2013.04.008. [DOI] [PubMed] [Google Scholar]
- Danik S, Cabo C, Chiello C, Kang S, Wit AL. Coromilas J. Correlation of repolarization of ventricular monophasic action potential with ECG in the murine heart. Am J Physiol Heart Circ Physiol. 2002;283:H372–H381. doi: 10.1152/ajpheart.01091.2001. [DOI] [PubMed] [Google Scholar]
- Davies JK, Wells DJ, Liu K, Whitrow HR, Daniel TD, Grignani R, Lygate CA, Schneider JE, Noel G, Watkins H. Carling D. Characterization of the role of γ2 R531G mutation in AMP-activated protein kinase in cardiac hypertrophy and Wolff–Parkinson–White syndrome. Am J Physiol Heart Circ Physiol. 2006;290:H1942–H1951. doi: 10.1152/ajpheart.01020.2005. [DOI] [PubMed] [Google Scholar]
- Desai AD, Yaw TS, Yamazaki T, Kaykha A, Chun S. Froelicher VF. Prognostic significance of quantitative QRS duration. Am J Med. 2006;119:600–606. doi: 10.1016/j.amjmed.2005.08.028. [DOI] [PubMed] [Google Scholar]
- Durrer D, Schoo L, Schuilenburg RM. Wellens HJ. The role of premature beats in the initiation and the termination of supraventricular tachycardia in the Wolff–Parkinson–White syndrome. Circulation. 1967;36:644–662. doi: 10.1161/01.cir.36.5.644. [DOI] [PubMed] [Google Scholar]
- Durrer D, Van Dam RT, Freud GE, Janse MJ, Meijler FL. Arzbaecher RC. Total excitation of the isolated human heart. Circulation. 1970;41:899–912. doi: 10.1161/01.cir.41.6.899. [DOI] [PubMed] [Google Scholar]
- Einthoven W. Ueber die form de menschlichen electrocardiogramms. Arch f d Ges Physiol. 1895;60:22. [Google Scholar]
- Elhendy A, Hammill SC, Mahoney DW. Pellikka PA. Relation of QRS duration on the surface 12-lead electrocardiogram with mortality in patients with known or suspected coronary artery disease. Am J Cardiol. 2005;96:1082–1088. doi: 10.1016/j.amjcard.2005.06.038. [DOI] [PubMed] [Google Scholar]
- Elrod JW, Calvert JW, Morrison J, Doeller JE, Kraus DW, Tao L, Jiao X, Scalia R, Kiss L, Szabo C, et al. Hydrogen sulfide attenuates myocardial ischemia–reperfusion injury by preservation of mitochondrial function. Proc Natl Acad Sci U S A. 2007;104:15560–15565. doi: 10.1073/pnas.0705891104. [DOI] [PMC free article] [PubMed] [Google Scholar]
- Fabritz L, Hoogendijk MG, Scicluna BP, van Amersfoorth SC, Fortmueller L, Wolf S, Laakmann S, Kreienkamp N, Piccini I, Breithardt G, et al. Load-reducing therapy prevents development of arrhythmogenic right ventricular cardiomyopathy in plakoglobin-deficient mice. J Am Coll Cardiol. 2011;57:740–750. doi: 10.1016/j.jacc.2010.09.046. [DOI] [PubMed] [Google Scholar]
- Freud GE. Transmembrane potential in isolated human heart. Cardiovasc Res. 1972;6:75–78. doi: 10.1093/cvr/6.1.75. [DOI] [PubMed] [Google Scholar]
- Garrey W. The nature of fibrillary contraction of the heart: its relation to tissue mass and form. Am J Physiol. 1914;33:17. [Google Scholar]
- Gaussin V, Morley GE, Cox L, Zwijsen A, Vance KM, Emile L, Tian Y, Liu J, Hong C, Myers D, et al. Alk3/Bmpr1a receptor is required for development of the atrioventricular canal into valves and annulus fibrosus. Circ Res. 2005;97:219–226. doi: 10.1161/01.RES.0000177862.85474.63. [DOI] [PMC free article] [PubMed] [Google Scholar]
- Gehrmann J, Frantz S, Maguire CT, Vargas M, Ducharme A, Wakimoto H, Lee RT. Berul CI. Electrophysiological characterization of murine myocardial ischemia and infarction. Basic Res Cardiol. 2001;96:237–250. doi: 10.1007/s003950170054. [DOI] [PubMed] [Google Scholar]
- Gibbons RJ, Valeti US, Araoz PA. Jaffe AS. The quantification of infarct size. J Am Coll Cardiol. 2004;44:1533–1542. doi: 10.1016/j.jacc.2004.06.071. [DOI] [PubMed] [Google Scholar]
- Goldbarg AN, Hellerstein HK, Bruell JH. Daroczy AF. Electrocardiogram of the normal mouse, Mus musculus: general considerations and genetic aspects. Cardiovasc Res. 1968;2:93–99. doi: 10.1093/cvr/2.1.93. [DOI] [PubMed] [Google Scholar]
- Gussak I, Chaitman BR, Kopecky SL. Nerbonne JM. Rapid ventricular repolarization in rodents: electrocardiographic manifestations, molecular mechanisms, and clinical insights. J Electrocardiol. 2000;33:159–170. doi: 10.1016/s0022-0736(00)80072-2. [DOI] [PubMed] [Google Scholar]
- Haissaguerre M, Derval N, Sacher F, Jesel L, Deisenhofer I, de Roy L, Pasquie JL, Nogami A, Babuty D, Yli-Mayry S, et al. Sudden cardiac arrest associated with early repolarization. New Engl J Med. 2008;358:2016–2023. doi: 10.1056/NEJMoa071968. [DOI] [PubMed] [Google Scholar]
- Harris BS, Baicu CF, Haghshenas N, Kasiganesan H, Scholz D, Rackley MS, Miquerol L, Gros D, Mukherjee R. O'Brien TX. Remodeling of the peripheral cardiac conduction system in response to pressure overload. Am J Physiol Heart Circ Physiol. 2012;302:H1712–H1725. doi: 10.1152/ajpheart.00621.2011. [DOI] [PMC free article] [PubMed] [Google Scholar]
- Holmqvist F, Carlson J. Platonov PG. Detailed ECG analysis of atrial repolarization in humans. Ann Noninvasive Electrocardiol. 2009;14:13–18. doi: 10.1111/j.1542-474X.2008.00268.x. [DOI] [PMC free article] [PubMed] [Google Scholar]
- Hoogendijk MG, Potse M, Linnenbank AC, Verkerk AO, den Ruijter HM, van Amersfoorth SC, Klaver EC, Beekman L, Bezzina CR, Postema PG, et al. Mechanism of right precordial ST-segment elevation in structural heart disease: excitation failure by current-to-load mismatch. Heart Rhythm. 2010;7:238–248. doi: 10.1016/j.hrthm.2009.10.007. [DOI] [PubMed] [Google Scholar]
- Janse MJ. Electrophysiological effects of myocardial ischaemia. Relationship with early ventricular arrhythmias. Eur Heart J. 1986;7(Suppl. A):35–43. [PubMed] [Google Scholar]
- Janse MJ. ST-segment elevation or TQ-segment depression. Heart Rhythm. 2007;4:207. doi: 10.1016/j.hrthm.2006.11.009. [DOI] [PubMed] [Google Scholar]
- Kaese S. Verheule S. Cardiac electrophysiology in mice: a matter of size. Front Physiol. 2012;3:345. doi: 10.3389/fphys.2012.00345. [DOI] [PMC free article] [PubMed] [Google Scholar]
- Knollmann BC, Schober T, Petersen AO, Sirenko SG. Franz MR. Action potential characterization in intact mouse heart: steady-state cycle length dependence and electrical restitution. Am J Physiol Heart Circ Physiol. 2007;292:H614–H621. doi: 10.1152/ajpheart.01085.2005. [DOI] [PubMed] [Google Scholar]
- Lepeschkin E. Surawicz B. The measurement of the Q–T interval of the electrocardiogram. Circulation. 1952;6:378–388. doi: 10.1161/01.cir.6.3.378. [DOI] [PubMed] [Google Scholar]
- Li GR, Feng J, Yue L, Carrier M. Nattel S. Evidence for two components of delayed rectifier K+ current in human ventricular myocytes. Circ Res. 1996;78:689–696. doi: 10.1161/01.res.78.4.689. [DOI] [PubMed] [Google Scholar]
- Li H, Guo W, Yamada KA. Nerbonne JM. Selective elimination of IK,slow1 in mouse ventricular myocytes expressing a dominant negative Kv1.5 α subunit. Am J Physiol Heart Circ Physiol. 2004;286:H319–H328. doi: 10.1152/ajpheart.00665.2003. [DOI] [PubMed] [Google Scholar]
- Liu G, Iden JB, Kovithavongs K, Gulamhusein R, Duff HJ. Kavanagh KM. In vivo temporal and spatial distribution of depolarization and repolarization and the illusive murine T wave. J Physiol. 2004;555:267–279. doi: 10.1113/jphysiol.2003.054064. [DOI] [PMC free article] [PubMed] [Google Scholar]
- London B. Cardiac arrhythmias: from (transgenic) mice to men. J Cardiovasc Electrophysiol. 2001;12:1089–1091. doi: 10.1046/j.1540-8167.2001.01089.x. [DOI] [PubMed] [Google Scholar]
- London B, Wang DW, Hill JA. Bennett PB. The transient outward current in mice lacking the potassium channel gene Kv1.4. J Physiol. 1998;509:171–182. doi: 10.1111/j.1469-7793.1998.171bo.x. [DOI] [PMC free article] [PubMed] [Google Scholar]
- Lopatin AN. Nichols CG. Inward rectifiers in the heart: an update on IK1. J Mol Cell Cardiol. 2001;33:625–638. doi: 10.1006/jmcc.2001.1344. [DOI] [PubMed] [Google Scholar]
- Lu JT. Kass RS. Recent progress in congenital long QT syndrome. Current Opin Cardiol. 2010;25:216–221. doi: 10.1097/HCO.0b013e32833846b3. [DOI] [PMC free article] [PubMed] [Google Scholar]
- Marsman RF, Bezzina CR, Freiberg F, Verkerk AO, Adriaens ME, Podliesna S, Chen C, Purfurst B, Spallek B, Koopmann TT, et al. Coxsackie and adenovirus receptor (CAR) is a modifier of cardiac conduction and arrhythmia vulnerability in the setting of myocardial ischemia. J Am Coll Cardiol. 2013 doi: 10.1016/j.jacc.2013.10.062. [DOI] [PMC free article] [PubMed] [Google Scholar]
- Meijborg VM, Conrath CE, Opthof T, Belterman CN, de Bakker JM. Coronel R. Electrocardiographic T wave and its relation with ventricular repolarization along major anatomical axes. Circ Arrhythmia Electrophysiol. 2014;7:524–531. doi: 10.1161/CIRCEP.113.001622. [DOI] [PubMed] [Google Scholar]
- Methner C, Buonincontri G, Hu CH, Vujic A, Kretschmer A, Sawiak S, Carpenter A, Stasch JP. Krieg T. Riociguat reduces infarct size and post-infarct heart failure in mouse hearts: insights from MRI/PET imaging. PLoS One. 2013;8:e83910. doi: 10.1371/journal.pone.0083910. [DOI] [PMC free article] [PubMed] [Google Scholar]
- Mines GR. On dynamic equilibrium of the heart. J Physiol. 1913;46:349–382. doi: 10.1113/jphysiol.1913.sp001596. [DOI] [PMC free article] [PubMed] [Google Scholar]
- Miquerol L, Meysen S, Mangoni M, Bois P, van Rijen HV, Abran P, Jongsma H, Nargeot J. Gros D. Architectural and functional asymmetry of the His-Purkinje system of the murine heart. Cardiovasc Res. 2004;63:77–86. doi: 10.1016/j.cardiores.2004.03.007. [DOI] [PubMed] [Google Scholar]
- Mitchell GF, Jeron A. Koren G. Measurement of heart rate and Q-T interval in the conscious mouse. Am J Physiol Heart Circ Physiol. 1998;43:H747–H751. doi: 10.1152/ajpheart.1998.274.3.H747. [DOI] [PubMed] [Google Scholar]
- Nerbonne JM. Kass RS. Molecular physiology of cardiac repolarization. Physiol Rev. 2005;85:1205–1253. doi: 10.1152/physrev.00002.2005. [DOI] [PubMed] [Google Scholar]
- Nygren A, Clark RB, Belke DD, Kondo C, Giles WR. Witkowski FX. Voltage-sensitive dye mapping of activation and conduction in adult mouse hearts. Ann Biomed Eng. 2000;28:958–967. doi: 10.1114/1.1308501. [DOI] [PubMed] [Google Scholar]
- Opthof T, Coronel R. Janse MJ. Repolarization gradients in the intact heart. Circ Arrhythmia Electrophysiol. 2009;2:89–96. doi: 10.1161/CIRCEP.108.825356. [DOI] [PubMed] [Google Scholar]
- Patel VV. Novel insights into the cellular basis of atrial fibrillation. Expert Rev Cardiovasc Ther. 2010;8:907–916. doi: 10.1586/erc.10.54. [DOI] [PMC free article] [PubMed] [Google Scholar]
- Pol CJ, Muller A, Zuidwijk MJ, van Deel ED, Kaptein E, Saba A, Marchini M, Zucchi R, Visser TJ, Paulus WJ, et al. Left-ventricular remodeling after myocardial infarction is associated with a cardiomyocyte-specific hypothyroid condition. Endocrinology. 2011;152:669–679. doi: 10.1210/en.2010-0431. [DOI] [PubMed] [Google Scholar]
- Priori SG, Napolitano C, Schwartz PJ, Grillo M, Bloise R, Ronchetti E, Moncalvo C, Tulipani C, Veia A, Bottelli G. Nastoli J. Association of long QT syndrome loci and cardiac events among patients treated with beta-blockers. JAMA. 2004;292:1341–1344. doi: 10.1001/jama.292.11.1341. [DOI] [PubMed] [Google Scholar]
- Remme CA, Verkerk AO, Nuyens D, van Ginneken AC, van Brunschot S, Belterman CN, Wilders R, van Roon MA, Tan HL, Wilde AA, et al. Overlap syndrome of cardiac sodium channel disease in mice carrying the equivalent mutation of human SCN5A-1795insD. Circulation. 2006;114:2584–2594. doi: 10.1161/CIRCULATIONAHA.106.653949. [DOI] [PubMed] [Google Scholar]
- Rentschler S, Harris BS, Kuznekoff L, Jain R, Manderfield L, Lu MM, Morley GE, Patel VV. Epstein JA. Notch signaling regulates murine atrioventricular conduction and the formation of accessory pathways. J Clin Invest. 2011;121:525–533. doi: 10.1172/JCI44470. [DOI] [PMC free article] [PubMed] [Google Scholar]
- Saito T, Sato T, Miki T, Seino S. Nakaya H. Role of ATP-sensitive K+ channels in electrophysiological alterations during myocardial ischemia: a study using Kir6.2-null mice. Am J Physiol Heart Circ Physiol. 2005;288:H352–H357. doi: 10.1152/ajpheart.00695.2004. [DOI] [PubMed] [Google Scholar]
- Salama G. London B. Mouse models of long QT syndrome. J Physiol. 2007;578:43–53. doi: 10.1113/jphysiol.2006.118745. [DOI] [PMC free article] [PubMed] [Google Scholar]
- Sidhu JS, Rajawat YS, Rami TG, Gollob MH, Wang Z, Yuan R, Marian AJ, DeMayo FJ, Weilbacher D, Taffet GE, et al. Transgenic mouse model of ventricular preexcitation and atrioventricular reentrant tachycardia induced by an AMP-activated protein kinase loss-of-function mutation responsible for Wolff–Parkinson–White syndrome. Circulation. 2005;111:21–29. doi: 10.1161/01.CIR.0000151291.32974.D5. [DOI] [PMC free article] [PubMed] [Google Scholar]
- Sotoodehnia N, Isaacs A, de Bakker PI, Dorr M, Newton-Cheh C, Nolte IM, van der HP, Muller M, Eijgelsheim M, Alonso A, et al. Common variants in 22 loci are associated with QRS duration and cardiac ventricular conduction. Nat Genet. 2010;42:1068–1076. doi: 10.1038/ng.716. [DOI] [PMC free article] [PubMed] [Google Scholar]
- Speerschneider T. Thomsen MB. Physiology and analysis of the electrocardiographic T wave in mice. Acta Physiol. 2013;209:262–271. doi: 10.1111/apha.12172. [DOI] [PubMed] [Google Scholar]
- Sprague HB. White PD. Clinical Observations on the T wave of the auricle appearing in the human electrocardiogram. J Clin Invest. 1925;1:389–402. doi: 10.1172/JCI100020. [DOI] [PMC free article] [PubMed] [Google Scholar]
- Stables CL. Curtis MJ. Development and characterization of a mouse in vitro model of ischaemia-induced ventricular fibrillation. Cardiovasc Res. 2009;83:397–404. doi: 10.1093/cvr/cvp068. [DOI] [PubMed] [Google Scholar]
- Toischer K, Hartmann N, Wagner S, Fischer TH, Herting J, Danner BC, Sag CM, Hund TJ, Mohler PJ, Belardinelli L, et al. Role of late sodium current as a potential arrhythmogenic mechanism in the progression of pressure-induced heart disease. J Mol Cell Cardiol. 2013;61:111–122. doi: 10.1016/j.yjmcc.2013.03.021. [DOI] [PMC free article] [PubMed] [Google Scholar]
- Vaidya D, Morley GE, Samie FH. Jalife J. Reentry and fibrillation in the mouse heart. A challenge to the critical mass hypothesis. Circ Res. 1999;85:174–181. doi: 10.1161/01.res.85.2.174. [DOI] [PubMed] [Google Scholar]
- VanderBrink BA, Link MS, Aronovitz MJ, Saba S, Sloan SB, Homoud MK, Estes IN. Wang PJ. Assessment of atrioventricular nodal physiology in the mouse. J Interv Card Electrophysiol. 1999;3:207–212. doi: 10.1023/a:1009842105146. [DOI] [PubMed] [Google Scholar]
- van Oosterom A. Oostendorp TF. ECGSIM: an interactive tool for studying the genesis of QRST waveforms. Heart. 2004;90:165–168. doi: 10.1136/hrt.2003.014662. [DOI] [PMC free article] [PubMed] [Google Scholar]
- Van Rijen HV, van Veen TA, van Kempen MJ, Wilms-Schopman FJ, Potse M, Krueger O, Willecke K, Opthof T, Jongsma HJ. de Bakker JM. Impaired conduction in the bundle branches of mouse hearts lacking the gap junction protein connexin40. Circulation. 2001;103:1591–1598. doi: 10.1161/01.cir.103.11.1591. [DOI] [PubMed] [Google Scholar]
- Walker MJ, Curtis MJ, Hearse DJ, Campbell RW, Janse MJ, Yellon DM, Cobbe SM, Coker SJ, Harness JB, Harron DW, et al. The Lambeth Conventions: guidelines for the study of arrhythmias in ischaemia infarction, and reperfusion. Cardiovasc Res. 1988;22:447–455. doi: 10.1093/cvr/22.7.447. [DOI] [PubMed] [Google Scholar]
- Wellens HJ, Brugada P. Stevenson WG. Programmed electrical stimulation of the heart in patients with life-threatening ventricular arrhythmias: what is the significance of induced arrhythmias and what is the correct stimulation protocol? Circulation. 1985;72:1–7. doi: 10.1161/01.cir.72.1.1. [DOI] [PubMed] [Google Scholar]
- Wellens HJ, Janse MJ, Van Dam RT, van Capelle FJ, Meijne NG, Mellink HM. Durrer D. Epicardial mapping and surgical treatment in Wolff–Parkinson–White syndrome Type A. Am Heart J. 1974;88:69–78. doi: 10.1016/0002-8703(74)90351-2. [DOI] [PubMed] [Google Scholar]
- Wiegerinck RF, Verkerk AO, Belterman CN, van Veen TA, Baartscheer A, Opthof T, Wilders R, de Bakker JM. Coronel R. Larger cell size in rabbits with heart failure increases myocardial conduction velocity and QRS duration. Circulation. 2006;113:806–813. doi: 10.1161/CIRCULATIONAHA.105.565804. [DOI] [PubMed] [Google Scholar]
- Wiener N. Rosenblueth A. The mathematical formulation of the problem of conduction of impulses in a network of connected excitable elements, specifically in cardiac muscle. Arch Inst Cardiol Mex. 1946;16:205–265. [PubMed] [Google Scholar]
- Wilde AA. Brugada R. Phenotypical manifestations of mutations in the genes encoding subunits of the cardiac sodium channel. Circ Res. 2011;108:884–897. doi: 10.1161/CIRCRESAHA.110.238469. [DOI] [PubMed] [Google Scholar]
- Wolf CM, Arad M, Ahmad F, Sanbe A, Bernstein SA, Toka O, Konno T, Morley G, Robbins J, Seidman JG, Seidman CE. Berul CI. Reversibility of PRKAG2 glycogen-storage cardiomyopathy and electrophysiological manifestations. Circulation. 2008;117:144–154. doi: 10.1161/CIRCULATIONAHA.107.726752. [DOI] [PMC free article] [PubMed] [Google Scholar]
- Wolff L, Parkinson J. White PD. Bundle-branch block with short P–R interval in healthy young people prone to paroxysmal tachycardia. Am Heart J. 1930;5:685–704. doi: 10.1111/j.1542-474X.2006.00127.x. [DOI] [PMC free article] [PubMed] [Google Scholar]
- Xu H, Barry DM, Li H, Brunet S, Guo W. Nerbonne JM. Attenuation of the slow component of delayed rectification, action potential prolongation, and triggered activity in mice expressing a dominant-negative Kv2 α subunit. Circ Res. 1999a;85:623–633. doi: 10.1161/01.res.85.7.623. [DOI] [PubMed] [Google Scholar]
- Xu H, Guo W. Nerbonne JM. Four kinetically distinct depolarization-activated K+ currents in adult mouse ventricular myocytes. J Gen Physiol. 1999b;113:661–678. doi: 10.1085/jgp.113.5.661. [DOI] [PMC free article] [PubMed] [Google Scholar]
- Zhang SS, Kim KH, Rosen A, Smyth JW, Sakuma R, Delgado-Olguin P, Davis M, Chi NC, Puviindran V, Gaborit N, et al. Iroquois homeobox gene 3 establishes fast conduction in the cardiac His-Purkinje network. Proc Natl Acad Sci U S A. 2011;108:13576–13581. doi: 10.1073/pnas.1106911108. [DOI] [PMC free article] [PubMed] [Google Scholar]
- Zhang Y, Wu J, King JH, Huang CL. Fraser JA. Measurement and interpretation of electrocardiographic QT intervals in murine hearts. Am J Physiol Heart Circ Physiol. 2014;306:H1553–H1557. doi: 10.1152/ajpheart.00459.2013. [DOI] [PMC free article] [PubMed] [Google Scholar]