Abstract
Purpose
The goal of this study was to evaluate and model the risk of in-vivo thrombosis in each hepatic vessel type during hepatic microwave ablation as a function of vessel diameter, velocity and vessel-antenna spacing.
Materials and Methods
A single microwave ablation antenna was inserted into a single porcine lobe (n=15 total) adjacent to a hepatic artery, hepatic vein, or portal vein branch. Conventional and Doppler ultrasound were used to measure the vessel diameter, blood flow velocity, and vessel-antenna spacing. A microwave ablation zone was then created at 100 W for 5 minutes. Thrombus formation was evaluated on immediate post-procedure ultrasound imaging. Logistic regression was used to evaluate the predictive value of vessel diameter, blood flow velocity and vessel-antenna spacing on vascular thrombosis.
Results
Thrombosis was identified in 53% of portal veins, 13% of hepatic veins and 0% of the hepatic arteries. The average peak blood flow rate of the hepatic artery was significantly greater than that of the hepatic vein and portal vein. Peak blood flow velocities less than 12.45 cm/sec, vessel diameters less than 5.10 mm and vessel-antenna spacings less than 3.75 mm were strong predictors of hepatic vein thrombosis. However, these individual factors were not predictive of the more common portal vein thrombosis.
Conclusions
Hepatic arteries do not appear to be at risk for thrombosis during microwave ablation procedures. Portal vein thrombosis was more common than hepatic vein thrombosis during microwave ablation treatments, but was not as predictable based upon vessel diameter, flow velocities, or vessel-antenna spacing alone.
INTRODUCTION
During a thermal ablation procedure, image guidance with computed tomography (CT) or ultrasound (US) is utilized to guide the applicator into the vicinity of the tumor. The process of planning the applicator placement takes into account the effects of thermal damage on nearby vasculatures. Larger blood vessels can act as a heat-sink and limit tumor cell death in perivascular regions. Such vascular heat sinks have been particularly detrimental to the slower heating techniques associated with radiofrequency ablations, preventing the heating zone from extending to necessary margins for adequate coverage of larger tumors (1,2).
Microwave ablations have been shown to create faster heating and larger ablation zones, which more effectively overcome nearby heat sinks. While this heating advantage can be associated with improved performance when treating perivascular tumors, the large heat deposition into the vessel may have unintended consequences (3,4). Excess thermal damage to portal veins can cause acute thrombosis, leading to liver decompensation and lobar infarcts - devastating consequences for patients with diminished liver reserve (5,6). In case reports of thrombus formations during microwave ablations, patients have needed to be treated with anti-coagulation therapy (7,8).
Regardless of whether thrombosis is a desired effect of the treatment or an unintended consequence, the mechanism by which microwave ablations may produce vascular thrombosis in portal veins, hepatic veins and hepatic arteries is poorly understood. With increased adoption in microwave ablation technologies worldwide, better understanding of the incidence, risk factors and potential implications of microwave ablation-induced vascular thrombosis is needed to help guide the clinical decision-making and treatment planning process. The goal of this study was to evaluate the risk of thrombosis in hepatic blood vessels during microwave ablation as a function of vessel type, diameter, velocity and vessel-antenna spacing.
MATERIALS AND METHODS
All studies were performed under approval from our institutional animal care and use committee and complied with National Research Council guidelines (9). Female domestic swine (n=5, mean weight=70kg); (Arlington Farms, Arlington WI) were sedated with intramuscular tiletamine hydrochloride-zolazepam hydrochloride (7 mg/kg, Telazol, Fort Dodge IA) and xylazine hydrochloride (2.2 mg/kg, Xyla-Ject, Phoenix Pharmaceutical, St Joseph, MO). Anesthesia was maintained with inhaled 1.0-2.0% isofluorane (Halocarbon Laboratories, River Edge, NJ). An ear vein was cannulated with a 20-gauge angiocatheter for administration of IV fluids.
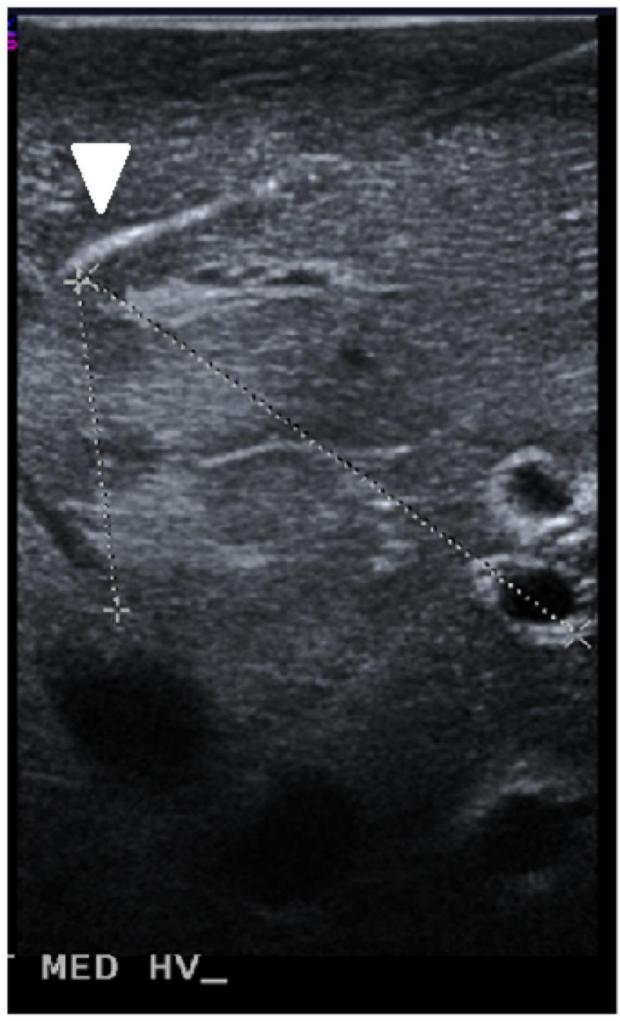
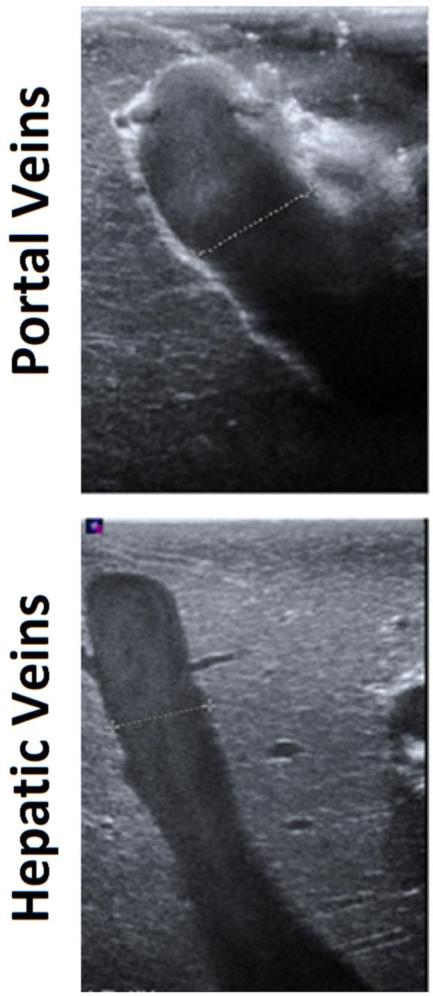
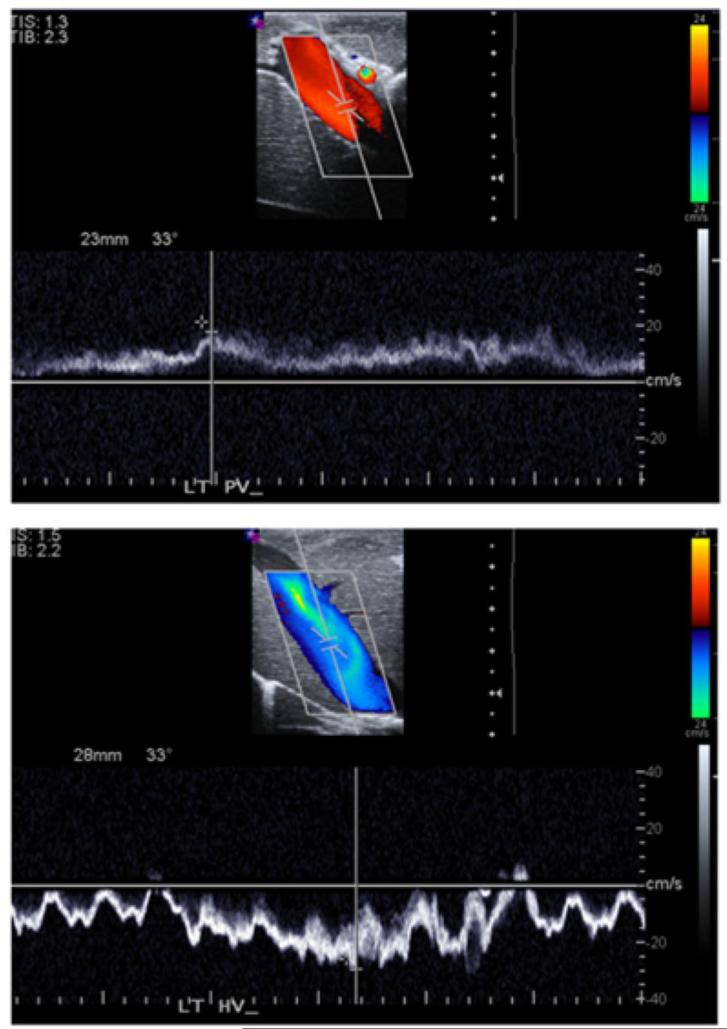
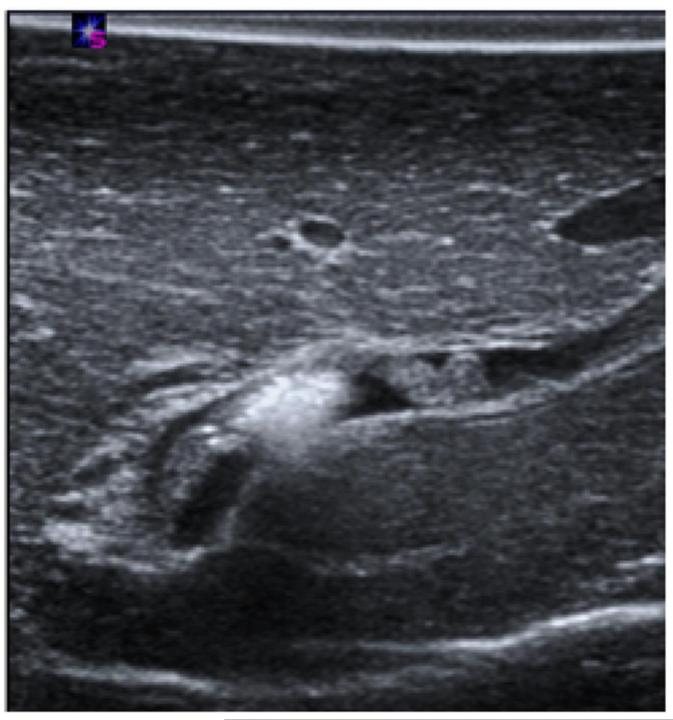
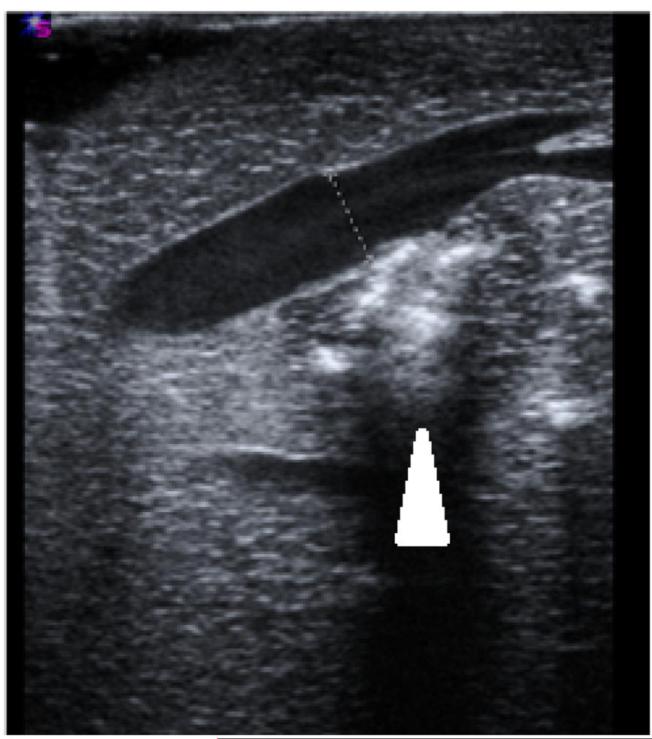
Microwave ablations (n=15) were performed under ultrasound guidance with a single microwave antenna (LK-15; Neuwave Medical, Inc., Madison WI) at 100 W for 5 minutes. Conventional and Doppler ultrasound (Siemens Antares, Siemens Medical Solutions Inc., Issaquah, WA) were used immediately before and after the ablations to determine the diameter, blood flow velocity (peak and temporal pattern of flow), and vessel-antenna spacing of the nearest hepatic artery, hepatic vein and portal vein with a 5 MHz center-frequency linear transducer (VFX 13-5, Siemens Healthcare, Ultrasound Group, Issaquah, WA) (Figure 1). A single ablation was created in each liver lobe. Thrombosis of a vessel was identified through a loss of Doppler signal within the vessel lumen and was generally associated with hypo-echoic thrombus identified on B-mode imaging. Thrombus formation was defined as a binary event, categorized as either present (Figure 2A) or absent (Figure 2B) for statistical analysis.
1.
Sample measurements taken in experimental setup A) Ultrasound guidance of microwave antenna (arrowhead) positioned in the proximity of portal veins and hepatic veins. B) Portal vein walls (top), comprised of loosely-packed connective tissue, appear hyperechoic under ultrasound imaging. Hepatic vein walls (bottom), comprised of tightly-packed collagen fibers, were characterized by the absence of echogenic artifacts. C) On Doppler, portal vein (top) blood move anterograde toward hepatic sinusoids, greatly dampening the flow. Conversely, hepatic vein (bottom) blood flow was more pulsatile due to anterograde-retrograde pressure/flow variations from the cardiac cycle.
2.
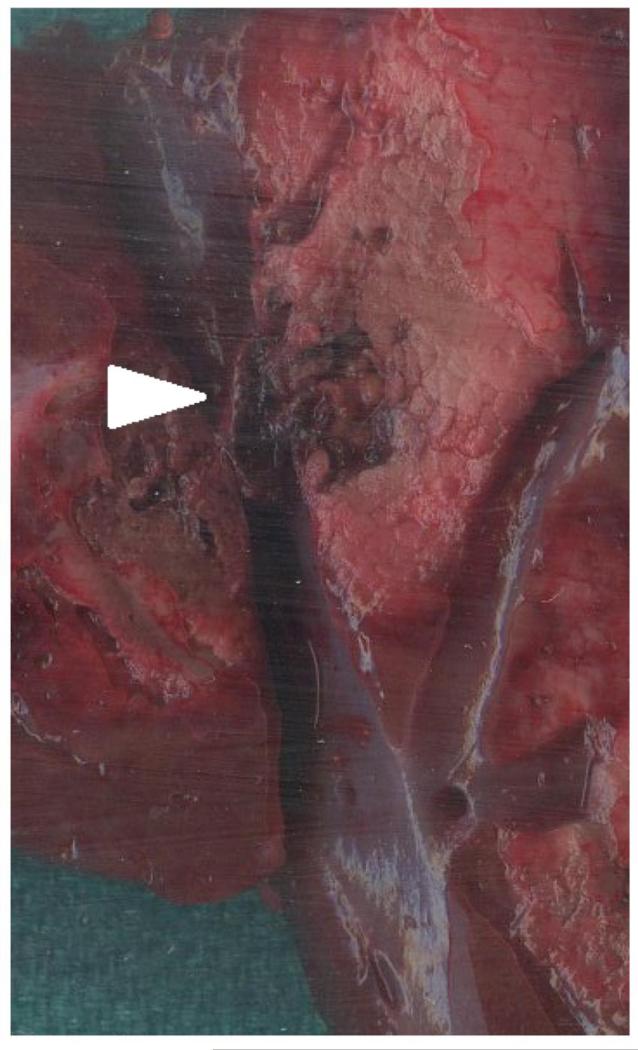
Post-ablation vessel imaging. A) Thrombus formation seen in a nearby portal vein immediately on ultrasound after the ablation procedure at 100 W for 5 minutes. B) Patent hepatic vein immediately after microwave ablation zone creation. Note the absence of thrombus in the hepatic vein, even though the ablation zone abutted the vessel wall, as denoted by the hyper-echoic gas bubbles made from the ablation zone (arrowhead). C) Axial slice of ablation zone with a thrombosed portal vein (arrowhead) inside an ablation zone.
After ablation, animals were sacrificed with an IV injection of Beuthanasia-D (390 mgmL, pentobarbital sodium and 50 mg/mL phenytoin sodium at 0.2 mL/kg; Schering-Plough, Kenilworth, NJ). The liver was removed and sectioned along the axis of each antenna to confirm the location of the ablation zone near the targeted vessels and the visual presence of thrombus formation (Figure 2C). The cross section of the vessel, ablation zone and thrombus formation on gross pathology was used to validate the ultrasound images taken during the study.
Statistical Analysis
Differences in mean diameter, peak velocity and vessel-antenna spacing were evaluated between hepatic arteries, hepatic veins and portal veins by using a paired Student's t-test. Partial and full thrombus formation was considered a positive event, while the absence of thrombus formation was considered a negative event. With thrombus formation coded as a binary event, univariate logistic regression was used to model the rate of thrombosis as a function of the predictive variables (vessel diameter, blood flow velocity and vessel-antenna spacing) in each type of vessel. Multi-variate logistic regression was also performed to account for the simultaneous effect of two or three of the variables against thrombosis formation. Receiver operator characteristic (ROC) curves and areas under the curve (AUC) were obtained for each model. Differences in AUC were assessed with DeLong and Delong tests (10). Two-tailed p-values less than 0.05 were considered significant. Statistical analysis was performed using MedCalc v7.4 (Mariakerke, Belgium) and R v3.01.
RESULTS
Vessel Characteristics
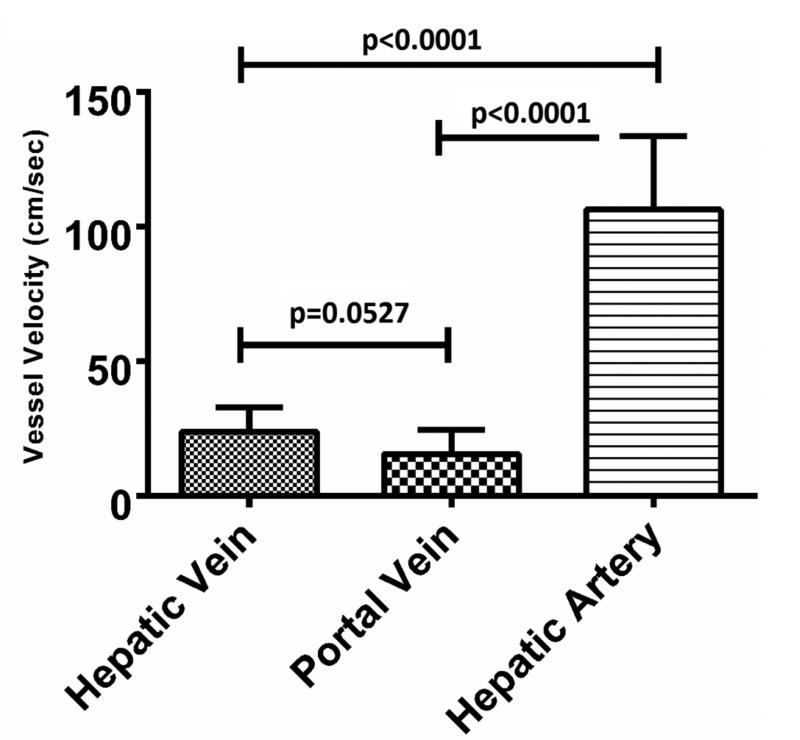
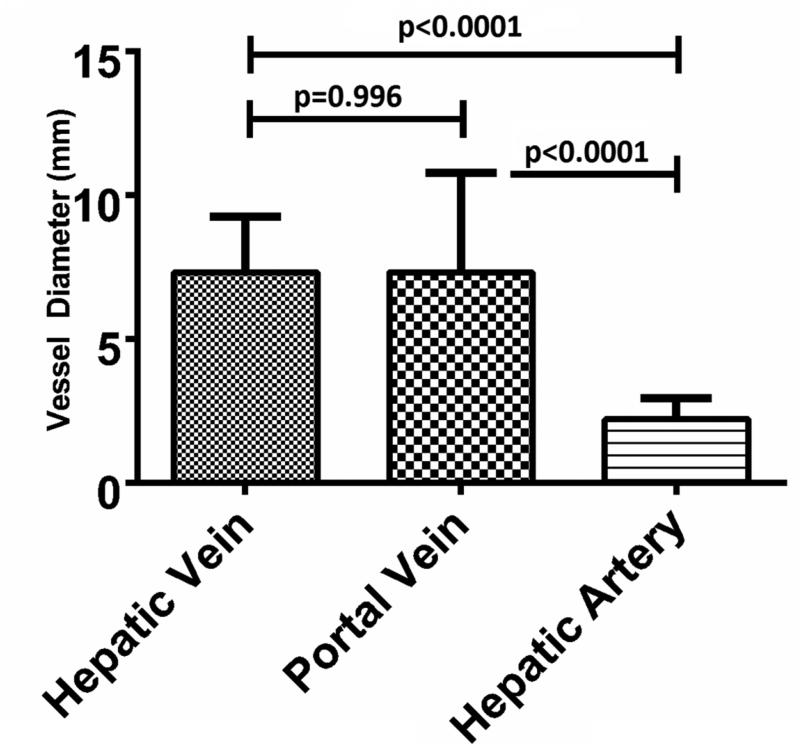
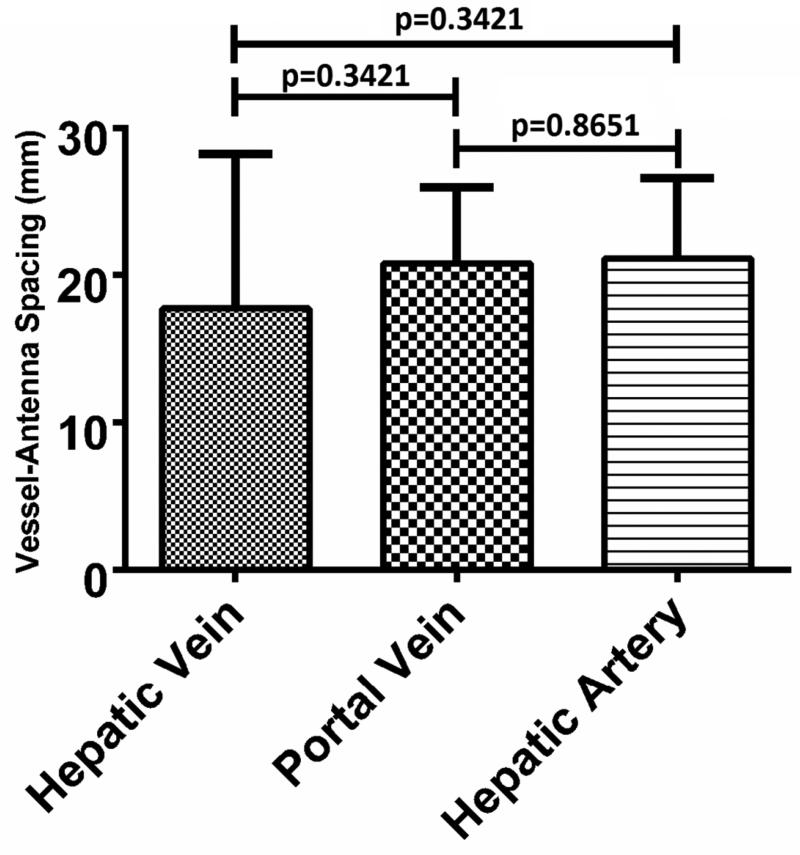
A sample size of n=15 was collected for each vessel type. The mean hepatic artery diameter was 2.2 mm (range: 1.1- 3.7 mm), peak blood velocity was 106.3 cm/sec (range: 74.8 – 185.0 cm/sec) and vessel- antenna spacing was 21.1 mm (range: 10.0 – 29.4 mm). As expected, the peak velocity of the hepatic artery was significantly greater than that of the hepatic vein or portal vein (106.3 ± 27.2 cm/sec [mean ± 1 SD], 24.0 ± 8.9 cm/sec and 15.6 ± 9.0 cm/sec, respectively; p<0.0001) (Figure 3A). The hepatic artery diameter was significantly smaller than that of the hepatic vein or portal vein (2.2 ± 0.2 mm, 7.3 ± 1.9 mm and 7.3 ± 3.4 mm, respectively p<0.0001) (Figure 3B). No differences were noted in vessel-antenna spacing between the microwave antenna and hepatic arteries, hepatic veins or portal veins (21.1 ± 5.5 mm, 17.7 ± 10.5 mm and 20.7 ± 5.2 mm, respectively, p>0.05) (Figure 3C).
3.
Summary of the vessels that were targeted with microwave ablations. A) Hepatic arteries had significantly faster peak velocities (106.3 cm/sec) compared to portal (24.1 cm/sec) and hepatic veins (15.6 cm/sec); B) Hepatic arteries were also significantly smaller in diameter (2.2 mm) compared to portal (7.3 mm) and hepatic veins (7.3 mm); C) There was no significant difference between any of the vessels in terms of antenna spacing (21.1 cm vs 17.8 vs 20.7 cm).
Thrombosis Analysis
Hepatic Artery
No thrombus formations were identified in any hepatic arteries. Due to the absence of thrombus formation, a logistic function and its corresponding ROC curve could not be created.
Hepatic Vein
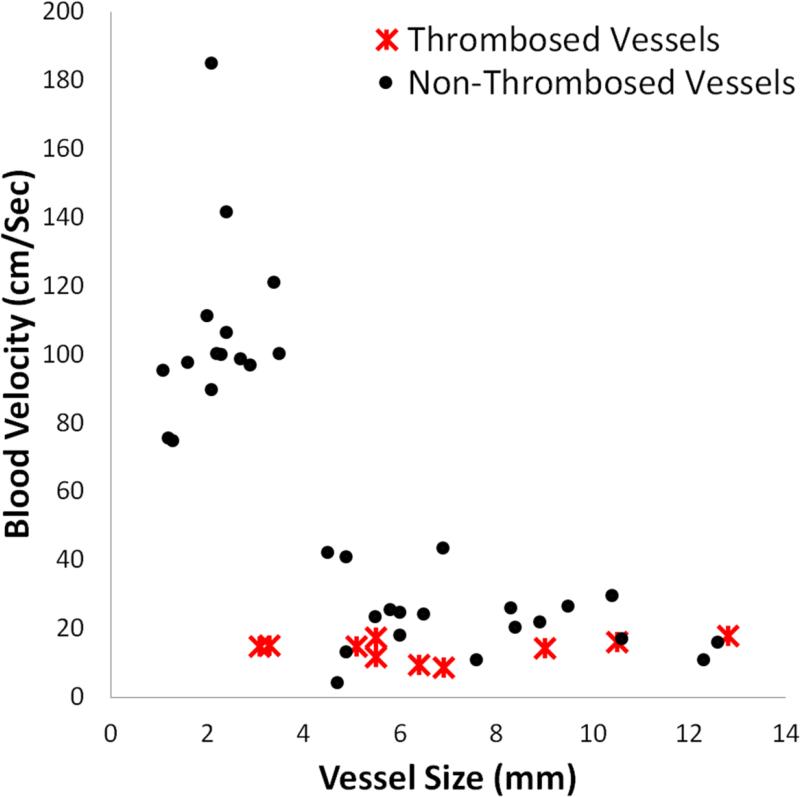
A total of 13% of the hepatic veins (2/15; 1/15 partial and 1/15 full occlusions) demonstrated thrombus formation (Figure 4). Logistic regression showed a significant negative correlation between thrombus formation and blood flow velocity (p=0.032) or vessel-antenna spacing (p=0.014) and a strong negative correlation with vessel diameter (p=0.083). Thus, thrombus formation was more likely with slower flow, smaller vessels and shorter vessel-antenna spacing in hepatic veins (Figure E1). Univariate modeling predicted a 50% chance of thrombus formation for peak blood flow velocity less than 12.45 cm/sec, vessel diameter less than 5.10 mm or the vessel-antenna spacing less than 3.75 mm. The areas under the ROC curve generated from each univariate logistic function was high (0.885, 0.904, 0.923 for the velocity, vessel diameter and vessel-antenna spacing predictors, respectively), indicating that the selected factors of vessel diameter, blood flow velocity and vessel-antenna spacing were able to separate thrombosis and non-thrombosis events in hepatic veins (Figure E2). Details of the quantitative statistical metrics are outlined in Table 1.
4.
Thrombosis versus non-events as a function of vessel size and blood velocity. The cluster of points in the upper left-hand corner shows the hepatic arteries, which were small in diameter and fast in blood velocity. The rest of the data points, on the bottom portion of the chart show portal and hepatic veins, which were slower and larger on average than the hepatic arteries.
Table 1.
Individual Contributions of Peak Velocity, Vessel Size and Vessel-Antenna Spacings Toward Thrombus Formation in Hepatic Veins.
| Unadjusted Univariate Contributions from Hepatic Vein Characteristics | Receiver Operator Characteristic Curve | ||||
|---|---|---|---|---|---|
| Variables | Odds Ratio (OR) | 95% Confidence Interval (CI) | P-Value | Area | 95% CI |
| Peak Velocity (cm/sec) | 0.773 | 0.5292-1.1280 | 0.0832 | 0.885 | 0.617-0.989 |
| Vessel Size (mm) | 0.096 | 0.0018-5.2305 | 0.0321* | 0.904 | 0.641-0.994 |
| Vessel-Antenna Spacing (mm) | 0.725 | 0.4718-1.1143 | 0.0136* | 0.923 | 0.667-0.997 |
Multi-variate logistic regression, which adjusted an individual variable to account for the confounding effect of the other two variables, showed an inflated area under the ROC curve due to low sample size. Using vessel diameter, blood flow velocity and vessel-antenna spacing simultaneously did not show improvements in predictive power over an individual variable alone. Perfect separability between events and non-events also caused unreliable estimates of standard errors, preventing further significance testing.
Portal Vein
A total of 53% of the portal vein (8/15; 4/15 partial and 4/15 full occlusions) demonstrated thrombus formation. In contrast to the results found for hepatic veins, peak flow velocity (p=0.264), vessel diameter (p=0.563) and vessel-antenna spacing (p=0.256) were found not to be significant predictors of thrombosis in portal veins. This could be seen from the fact that portal vein thrombosis occurred across a range of peak flow velocities, vessel diameters and vessel-antenna spacings (Figure E3). Correspondingly, the area under the ROC curve of the portal vein logistic functions were significantly less than those of the hepatic veins (0.607, 0.536 and 0.607 for the velocity, vessel diameter and vessel-antenna spacing predictors, respectively) (Figure E4). Details of the quantitative statistical metrics are outlined in Table 2.
Table 2.
Individual Contributions of Peak Velocity, Vessel Size and Vessel-Antenna Spacings Toward Thrombus Formation in Portal Veins.
| Unadjusted Univariate Contributions from Portal Vein Characteristics | Receiver Operator Characteristic curve | ||||
|---|---|---|---|---|---|
| Variables | Odds Ratio (OR) | 95% Confidence Interval (CI) | P-Value | Area | 95% CI |
| Peak Velocity (cm/sec) | 0.942 | 0.7875-1.0847 | 0.2642 | 0.607 | 0.329-0.842 |
| Vessel Size (mm) | 0.917 | 0.6829-1.2321 | 0.5633 | 0.536 | 0.268-0.789 |
| Vessel-Antenna Spacing (mm) | 0.881 | 0.6980-1.1114 | 0.2557 | 0.607 | 0.329-0.842 |
Multi-variate logistic regression using blood flow velocity, vessel diameter and vessel-antenna spacing simultaneously was marginally more predictive, with only a slight increase in the area under ROC curve, compared to any one univariate predictor alone (0.75 ± 0.13 versus 0.61 ± 0.16, 0.75 ± 0.13 versus 0.54 ± 0.08, and 0.75 ± 0.13 versus 0.607±0.08, respectively; p<0.05 for all comparisons).
DISCUSSION
This in-vivo pilot study demonstrated that vascular thrombosis occurs four times more commonly in portal veins than hepatic veins during microwave ablation. While vessel diameter, peak blood flow velocity and vessel-antenna spacing were predictive of hepatic vein thrombosis, those factors were unable to predict portal vein thrombosis with sufficient sensitivity and specificity. Combining factors improved predictions compared to single factors alone, but the fit of the portal vein model was still less conclusive than the hepatic vein model. No incidents of hepatic arterial thrombus were identified in this study despite the close proximity to the microwave antenna to various-sized hepatic arteries. This raises the possibility of a protective effect of rapid or pulsatile blood flow.
The primary goal of thermal ablation is to heat the target tumor and a margin of normal tissue to cytotoxic temperatures. Achieving an appropriate margin on average tumors of 2-3 cm has been challenging with existing RF ablation systems and early microwave ablation devices. In particular, the slower heating produced by those systems was not always sufficient to ablate near vascular structures great than 3-5 mm in diameter (11). More recent high-power systems have demonstrated an improved ability to overcome perfusion-mediated cooling and create larger ablation zones at a faster rate, potentially decreasing the risk for tumor recurrence, especially in perivascular tissue (12–15).
However, unintended collateral damage to hepatic vasculature structures is now a greater clinical concern, especially in patients with cirrhosis (16,17). The results of this study may help guide clinical treatment planning to avoid damage to critical vessels, particularly in cases of slow blood flow and when tumors are located in close proximity to portal vein branches. For example, analysis of portal veins showed potential utility in using multiple predictors to anticipate when a thrombus may form. One sample combination showed that vessels greater than 7 mm, coupled with a vessel-antenna spacing greater than 27 mm, predicted a less than 30% chance of thrombosis formation. Likewise, in the vicinity of a 15 mm sized vessel, the vessel-antenna spacing can be decreased to 19 mm distance while maintaining a 30% chance of thrombosis formation. Conversely, in hepatic veins, where thrombus formation is rare, a physician may want to use a more aggressive approach to treat the tumor. Multiple antennas or larger power-time combinations that deliver greater energy deposition can be utilized to ensure complete thermal necrosis in the absence of vessel occlusion.
The results reported in this study confirm the previously established relationship between vessel diameter and acute thrombosis. An early in-vivo porcine study on the effect of RF ablation on vessels found that vessels less than 3 mm in diameter had an increased risk for occlusion (1). The same group later found similar results with MW ablations, showing that vessels less than 6 mm in diameter had an increased risk for thrombosis, while larger vessels had less of a risk for thrombosis (18). Importantly, neither study distinguished between vessel types. Clinical studies of hepatic RF ablation have also demonstrated that the incidence of inadvertent portal vein thrombosis (0.87%; 12/1379) is greater than hepatic vein thrombosis (0.29%; 4/1379) (19). These findings are concordant with our study, albeit at lower overall rates of thrombosis. Our higher rates can be attributable to the fact that we specifically targeted vessels in normal liver parenchyma, compared to placing antennas in the center of a tumor.
The underlying reasons for the observed differences in thrombosis rates, or the substantially lower ability for basic geometry parameters to predict portal vein thromboses are not immediately clear. A plausible explanation is the difference in blood flow dynamics. Specifically, portal vein flow is relatively steady and into a capillary bed (hepatic sinusoids). Thus, thrombus or increased portal pressure caused by elimination of the capillary bed is likely to increase resistance to forward flow. The resulting stagnation would subsequently increase the chances of activating the coagulation cascade. This is especially true in patients with portal hypertension where portal venous resistance is already elevated. In contrast, hepatic vein flow is pulsatile, which decreases the likelihood of thrombus formation due to turbulence, and hepatic veins empty into progressively larger vessels leading into the heart (20–22). Thus, any hepatic venous thrombus that does develop is more likely to be dislodged from the vessel.
There were multiple sources of limitations to this study due to the simultaneous interplay of heat transfer, blood flow and clotting in an in-vivo environment. Evaluating a broad range of vessel-antenna spacing and velocity combinations (needed to assess their relationship to thrombus formation) was challenging. In particular, we had limited control over blood flow velocity. Such control may be more possible in an ex-vivo system, but the use of anti-coagulated blood or fluids in such systems would not allow us to evaluate clotting. In an effort to reduce variability between ablations, we used a single ablation setting of 100 W for 5 minutes. Our results can potentially be generalized to other power-time settings by integrating a scaling factor, but such broad analysis was beyond the scope of this investigation. Another limitation of this study was the lack of a tumor model. The vasculature near or within a tumor is different from that seen in normal tissue and can affect how microwave energy and heat propagate. These considerations need to be taken into account when extrapolating the results of this study to a clinical environment where liver cirrhosis and tumor are present. With regards to sample size, the low number of thrombus formations in hepatic veins led to difficulties in performing error analysis. While there are drawbacks to forming conclusions on such a small number of events, the results still illustrate the resistance of hepatic veins toward thrombus formation. Finally, the objective of our study was to focus on acute thrombus formation. Rates of delayed thrombus formation, which would result from not only the decreased blood flow from upstream acute thrombus but also the thermally-damaged endothelial layers, were not studied (8). In human patients with cirrhosis, arterio-venous shunts near tumors, and portal hypertension, portal vein velocities would be expected to be lower than healthy pig livers and thus experience a higher rate of thrombosis compared to what was seen in this study.
In conclusion, our in-vivo study demonstrated that portal veins exhibit more frequent but less predictable rates of thrombus formation than hepatic veins during microwave ablation. Hepatic veins showed a clear correlation between thrombus risk and peak flow velocity, vessel diameter, and vessel-antenna spacing. We did not identify thrombus formation in any hepatic arteries. Follow-up studies to further refine the risk of vascular thrombosis in the clinical setting would be helpful for procedural planning and establishing risk profiles.
Supplementary Material
Acknowledgements
The authors wish to thank Lisa Sampson, CVT, BS for her assistance in experimental setup. This work was funded by the National Institutes of Health, 1 R01 CA142737 and F30 CA165548.
Footnotes
Publisher's Disclaimer: This is a PDF file of an unedited manuscript that has been accepted for publication. As a service to our customers we are providing this early version of the manuscript. The manuscript will undergo copyediting, typesetting, and review of the resulting proof before it is published in its final citable form. Please note that during the production process errors may be discovered which could affect the content, and all legal disclaimers that apply to the journal pertain.
Citations
- 1.Lu DSK, Raman SS, Vodopich DJ, Wang M, Sayre J, Lassman C. Effect of vessel size on creation of hepatic radiofrequency lesions in pigs: assessment of the “heat sink” effect. Am J Roentgenol. 2002;178:47–51. doi: 10.2214/ajr.178.1.1780047. [DOI] [PubMed] [Google Scholar]
- 2.Ayav A, Germain A, Marchal F, Tierris I, Laurent V, Bazin C, et al. Radiofrequency ablation of unresectable liver tumors: factors associated with incomplete ablation or local recurrence. Am J Surg. 2010;200:435–9. doi: 10.1016/j.amjsurg.2009.11.009. [DOI] [PubMed] [Google Scholar]
- 3.Wright AS, Lee FTJ, Mahvi DM. Hepatic microwave ablation with multiple antennae results in synergistically larger zones of coagulation necrosis. Ann Surg Oncol. 2003;10:275–83. doi: 10.1245/aso.2003.03.045. [DOI] [PubMed] [Google Scholar]
- 4.Wright AS, Sampson LA, Warner TF, Mahvi DM, Lee FTJ. Radiofrequency versus microwave ablation in a hepatic porcine model. Radiology. 2005;236:132–9. doi: 10.1148/radiol.2361031249. [DOI] [PubMed] [Google Scholar]
- 5.Parikh S, Shah R, Kapoor P. Portal Vein Thrombosis. Am J Med. 2010;123:111–9. doi: 10.1016/j.amjmed.2009.05.023. [DOI] [PubMed] [Google Scholar]
- 6.Handa P, Crowther M, Douketis JD. Portal Vein Thrombosis: A Clinician-Oriented and Practical Review. Clin Appl Thromb Off J Int Acad Clin Appl Thromb. 2013;20:498–506. doi: 10.1177/1076029612473515. [DOI] [PubMed] [Google Scholar]
- 7.Kojima Y, Suzuki S, Sakaguchi T, Tsuchiya Y, Okamoto K, Kurachi K, et al. Portal vein thrombosis caused by microwave coagulation therapy for hepatocellular carcinoma: report of a case. Surg Today. 2000;30:844–8. doi: 10.1007/s005950070071. [DOI] [PubMed] [Google Scholar]
- 8.Meloni MF, Andreano A, Lava M, Lazzaroni S, Okolicsanyi S, Sironi S. Segmental portal vein thrombosis after microwave ablation of liver tumors: Report of two cases. Eur J Radiol Extra. 2010;76:95–98. [Google Scholar]
- 9.Guide for the Care and Use of Laboratory Animals. Eighth Edition. The National Academies Press; Washington, D.C.: 2010. Committee for the Update of the Guide for the Care and Use of Laboratory Animals; National Research Council. [Google Scholar]
- 10.DeLong ER, DeLong DM, Clarke-Pearson DL. Comparing the areas under two or more correlated receiver operating characteristic curves: a nonparametric approach. Biometrics. 1988;44:837–45. [PubMed] [Google Scholar]
- 11.Kim JH, Yim HJ, Lee KG, Kim SY, Jung ES, Jung YK, et al. Recurrence rates and factors for recurrence after radiofrequency ablation combined with transarterial chemoembolization for hepatocellular carcinoma: a retrospective cohort study. Hepatol Int. 2011;6:505–10. doi: 10.1007/s12072-011-9290-y. [DOI] [PubMed] [Google Scholar]
- 12.Dodd GD, 3rd, Dodd NA, Lanctot AC, Glueck DA. Effect of Variation of Portal Venous Blood Flow on Radiofrequency and Microwave Ablations in a Blood-perfused Bovine Liver Model. Radiology. 2013;267:129–36. doi: 10.1148/radiol.12120486. [DOI] [PubMed] [Google Scholar]
- 13.Andreano A, Brace CL. A Comparison of Direct Heating During Radiofrequency and Microwave Ablation in Ex Vivo Liver. Cardiovasc Intervent Radiol. 2013;36:505–11. doi: 10.1007/s00270-012-0405-1. [DOI] [PMC free article] [PubMed] [Google Scholar]
- 14.Brace CL. Radiofrequency and microwave ablation of the liver, lung, kidney, and bone: what are the differences? Curr Probl Diagn Radiol. 2009;38:135–43. doi: 10.1067/j.cpradiol.2007.10.001. [DOI] [PMC free article] [PubMed] [Google Scholar]
- 15.Brace CL. Microwave tissue ablation: biophysics, technology, and applications. Crit Rev Biomed Eng. 2010;38:65–78. doi: 10.1615/critrevbiomedeng.v38.i1.60. [DOI] [PMC free article] [PubMed] [Google Scholar]
- 16.Livraghi T, Meloni F, Solbiati L, Zanus G, Collaborative Italian Group using AMICA system Complications of microwave ablation for liver tumors: results of a multicenter study. Cardiovasc Intervent Radiol. 2012;35:868–74. doi: 10.1007/s00270-011-0241-8. [DOI] [PubMed] [Google Scholar]
- 17.Swan RZ, Sindram D, Martinie JB, Iannitti DA. Operative microwave ablation for hepatocellular carcinoma: complications, recurrence, and long-term outcomes. J Gastrointest Surg Off J Soc Surg Aliment Tract. 2013;17:719–29. doi: 10.1007/s11605-013-2164-y. [DOI] [PubMed] [Google Scholar]
- 18.Yu NC, Raman SS, Kim YJ, Lassman C, Chang X, Lu DSK. Microwave liver ablation: influence of hepatic vein size on heat-sink effect in a porcine model. J Vasc Interv Radiol. 2008;19:1087–92. doi: 10.1016/j.jvir.2008.03.023. [DOI] [PubMed] [Google Scholar]
- 19.Kim AY, Rhim H, Park M, Lee MW, Kim Y-S, Choi D, et al. Venous thrombosis after radiofrequency ablation for hepatocellular carcinoma. Am J Roentgenol. 2011;197:1474–80. doi: 10.2214/AJR.11.6495. [DOI] [PubMed] [Google Scholar]
- 20.Frericks BB, Ritz JP, Albrecht T, Valdeig S, Schenk A, Wolf K-J, et al. Influence of intrahepatic vessels on volume and shape of percutaneous thermal ablation zones: in vivo evaluation in a porcine model. Invest Radiol. 2008;43:211–8. doi: 10.1097/RLI.0b013e31815daf36. [DOI] [PubMed] [Google Scholar]
- 21.Mohamed AlAmiri A. Fluid-Structure Interaction Analysis of Pulsatile Blood Flow and Heat Transfer in Living Tissues During Thermal Therapy. J Fluids Eng. 2013;135:041103–041103. [Google Scholar]
- 22.Persoons T, Saenen T, Donose R, Baelmans M. Heat transfer enhancement due to pulsating flow in a microchannel heat sink.. Presented at the 15th International Workshop on Thermal Investigations of ICs and Systems; Leuvin, Belgium. October 7-9, 2009. [Google Scholar]
Associated Data
This section collects any data citations, data availability statements, or supplementary materials included in this article.


