

Abstract
Virus infection of a cell involves the appropriation of host factors and the innate defensive response of the cell. The identification of proteins critical for virus replication may lead to the development of novel, cell-based inhibitors. In this study we mapped the changes in T-cell nuclei during human immunodeficiency virus type 1 (HIV-1) at 20 hpi. Using a stringent data threshold, a total of 13 and 38 unique proteins were identified in infected and uninfected cells, respectively, across all biological replicates. An additional 15 proteins were found to be differentially regulated between infected and control nuclei. StringDB analysis identified four clusters of protein-protein interactions in the data set related to nuclear architecture, RNA regulation, cell division, and cell homeostasis. Immunoblot analysis confirmed the differential expression of several proteins in both C8166-45 and Jurkat E6-1 T-cells. These data provide a map of the response in host cell nuclei upon HIV-1 infection.
Keywords: HIV-1, nuclear isolation, proteomics, label-free MS/MS, virus-host interactions
Introduction
Acquired immune deficiency syndrome (AIDS) is a devastating disease that has claimed the lives of an estimated 36 million people. The etiologic agent of AIDS is human immunodeficiency virus type 1 (HIV-1), a constituent of the lentiviridae subfamily of retroviruses. HIV-1 infects cells of the immune system, specifically CD4+ T-cells, macrophages, and dendritic cells. Left untreated, HIV-1 infection results in chronic activation and eventual destruction of the immune system followed by an onslaught of opportunistic infections. HIV-1 has a small genome and expresses only 15 proteins but exhibits a complex life-cycle. Like all viruses it is dependent on host cell proteins and factors for productive replication and spread. These interactions with host factors promote replication, neutralize host defenses, and elicit pathogenesis.
Uncovering the network of host cell responses to viral invasion may reveal novel targets for cell-based anti-viral therapeutics. To this end, an extensive number of genetic and proteomic analyses of the cellular changes during HIV-1 infection have been completed (reviewed in (Giri et al., 2006)). Multiple whole genome small interfering RNA (siRNA) screens were completed to identify host factors critical for replication ((Brass et al., 2008; Konig et al., 2008; Liu et al., 2011; Zhou et al., 2008); summarized in (Bushman et al., 2009) and others). There have also been whole-genome association screens to discover host polymorphisms associated with virus acquisition, set point, and control (Fellay et al., 2007; Lingappa et al., 2011; Petrovski et al., 2011). Proteomic studies have investigated a wide variety of cellular and viral proteomes including T cell (Ringrose et al., 2008; Sheng and Wang, 2009), macrophage (Haverland et al., 2014; Kraft-Terry et al., 2010), intact HIV particles (Bregnard et al., 2013; Chertova et al., 2006; Saphire et al., 2006), purified HIV cores (Fuchigami et al., 2002; Santos et al., 2012), and HIV reverse transcription and preintegration complexes (Raghavendra et al., 2010; Schweitzer et al., 2013). Individual viral protein interactomes have also been mapped, including the viral proteins Gag (Engeland et al., 2014), Nef (Mukerji et al., 2012), Tat (Coiras et al., 2006), and Rev (Naji et al., 2012), as well as a comprehensive study of all HIV-1 proteins (Jager et al., 2011). Subcellular studies of the nucleolus (Jarboui et al., 2012) and the nuclear membrane (Monette et al., 2011) have also been reported. Comprehensive summaries of the current interactome of HIV-1 can be found on the National Institutes of Health NCBI website (http://www.ncbi.nlm.nih.gov/projects/RefSeq/HIVInteractions/).
The goal of this study was to investigate the changes in the nuclear proteome of T-cells during HIV-1 infection. Subtle changes to the nuclear proteome either through translocation of cytosolic proteins or induction of regulatory factors can contribute to the successful integration of the viral genome, changes in viral gene expression, as well as modulate the host cell defense against viral infection. Numerous host transcription and regulatory factors have been identified as required for HIV-1 integration, transcription, splicing, and RNA export (summarized in (Bushman et al., 2009)). To identify and characterize novel nuclear proteins associated with HIV-1 infection we used mass spectrometry to investigate the changes in nuclear proteins at 20 hours post infection (hpi) in C8166-45 cells. Using a high threshold of identification, a total of 51 proteins were identified as unique in the nuclei of infected or control cells in at least two biological replicates. An additional 15 proteins were predicted to be differentially expressed by having a greater than two-fold change in total Proteome Discoverer score between the infected and control samples. We validated the MS analysis by examining the subcellular expression of several candidate proteins by immunoblot. Differences in the nuclear expression of eight proteins between control and infected cells were confirmed in an independent T-cell line across a time-course infection. Combined these data map changes in the nuclei proteome of HIV infected T-cells as well as confirm the altered expression of several candidate proteins during infection.
Results
Experimental approach
The objective of this study was to identify changes in the expression of nuclear proteins during the early steps of HIV-1 infection. We previously defined a method to produce large quantities of preintegration complexes by infecting C8166-45 cells with HIV-1 pseudotyped with the glycoprotein of vesicular stomatitis virus (VSVg) using the spinoculation technique (Schweitzer et al., 2013). Because this method employs replication competent virus, a burst of co-infection occurs and a high level of reverse transcription and preintegration complexes are recovered at 20 hpi. We therefore hypothesized that this time-point may be enriched for factors that promote integration and/or activate virus transcription. The overall experimental approaches (both biological and bioinformatic) are summarized in Fig. 1. Nuclear fractions were isolated using a subcellular fraction kit which separated: 1) the cytosol; 2) the membranes and membrane-bound organelles; 3) the nuclear; and 4) cytoskeletal and insoluble proteins (Fig. 1A). In this protocol the nuclear fractions are treated with benzonase and therefore contain both soluble and nucleic acid bound proteins. Proteins were separated by one dimensional SDS-PAGE, parsed into 28 slices, digested in-gel with trypsin, and analyzed by LC-MS/MS. Proteins assignments were made using Proteome Discoverer software. Each biological replicate in the study represented an independent infection, nuclear isolation, and MS analysis.
Figure 1. Schematic of experimental approach used to investigate nuclei of HIV-1 infected cells.

Work-flow shown is representative of one complete biological replicate is shown in (a). Bioinformatic analyses scheme is shown in (b).
Since the yield and purity of nuclear isolations is dependent on the method and cell type used (Ori et al., 2014), the infection and quality of nuclear isolation of each biological replicate was confirmed by western blot analysis (Fig. 2). The integrity of the nuclear fractions was assessed by immunoblot of Glyceraldehyde-3-phosphate Dehydrogenase (GAPDH) and topoisomerase IIa (TOPO IIa; Fig 2. top two panels). GAPDH was consistently detected in the cytosolic, membrane, and insoluble fractions, but not the nuclei of C8166-45 cells, indicating an absence of cytosolic or membrane/organelle contamination in the nuclear samples. TOPO IIa was detected predominantly in the nuclear fraction, with a small amount in the cytoskeletal/insoluble fraction, confirming that the nuclei remained intact during the extraction procedure. The infection of cells was confirmed by checking for the presence of the viral Integrase and Matrix proteins (Fig 2, bottom two panels). At 20 hpi, both viral proteins were readily detected in the infected samples. Integrase was detected in all 4 fractions, but predominantly found in the membrane fraction. Matrix was readily detected in the cytosolic, membrane, and nuclear fractions, but only slightly in the insoluble fraction. Interestingly we consistently observed different migrating forms of Matrix in each fraction. Three forms of Matrix were observed: The expected size (17 kDa), a slightly smaller form of Matrix (15–16 kDa) in the membrane/organelle and nuclear fractions, and a second much smaller MW form (~7–8 kDa) in nuclei.
Figure 2. Infection of C8166-45 cells used in proteomic screen.

Western blot analysis of subcellular fractions of infected (left panels) and uninfected (right panels) C8166-45 cells used for proteomic analyses. Cells were fractionated into cytosolic (Cy), membrane/organelle (Me), nuclear (Nu), and cytoskeletal/insoluble (In) fractions. The proteins detected are listed on the left. Blots were performed for all biological replicates and representative blots are shown.
Database search and protein identification
The overall summary of the data work-flow is shown in Fig. 1B. Peptides were identified from the MS/MS scans with Proteome Discoverer 1.2 software utilizing the NCBI protein database. The total number of peptides identified across all experimental replicates was 8093 and 5339 (control and infected, respectively; Fig. 3A). Protein assignments were initially designated by NCBI GeneInfo Identifier (GI) number for each peptide. Based on individual GI numbers, a total of 3868 protein assignments were made. Collating the data to account for duplicate identifications across biological replicates resulted in the identification of 1738 proteins in the control set and 1054 in the infected set (Fig. 3B). The ratio of identified proteins (control/infected) was 1.65, suggesting that the final results would contain an overrepresentation of factors in the control samples and possibly mask some low abundant proteins in the infected samples. Next, the data sets were purged of all non-human records, any records marked as “removed” in the NCBI database, and all keratin records, which were considered background contamination.
Figure 3. Summary of MS data.
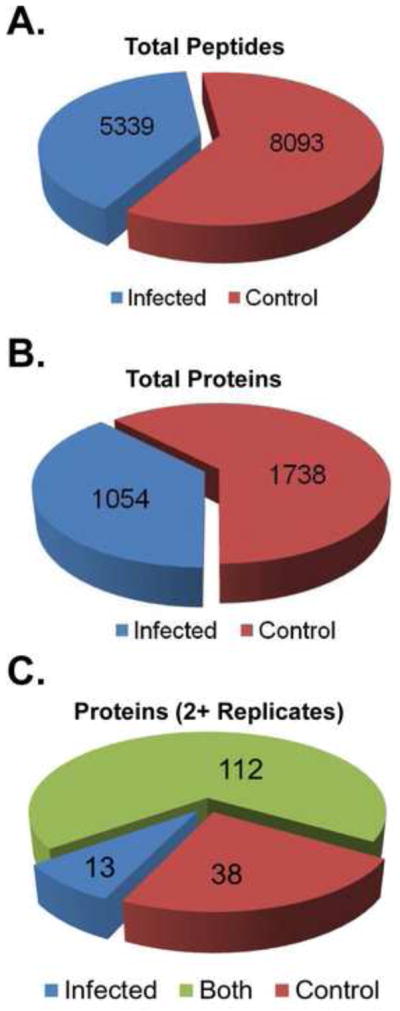
Graphical representation of the overall number of peptides identified (a), and proteins identified (b) from all biological replicates. (C) Chart of the number of cellular proteins identified in two or more biological replicates across the study.
The data was further transformed for additional bioinformatic analyses. The remaining NCBI GI numbers were converted to Uniprot IDs using the SwissProt knowledgebase. This step removed protein redundancies and formatted the data set for Centrality analysis (see below). Finally, the Uniprot IDs were converted to NCBI Gene IDs. This data set was used for the subtractive analysis to identify unique proteins, the protein-protein interaction analysis, as well as the knowledge-based analyses shown on the right of Tables 1–3.
Table 1.
GI numbers unique to infected samples1
| Gene ID2 | Gene Name | PD Score3 | Previous Studies4
|
|||||||
|---|---|---|---|---|---|---|---|---|---|---|
| NCBI HIV | Brass | Konig | Chertova | Raghavendra | Jäger | Kraft-Terry | Haverland | |||
| 1915 | EEF1A1, eukaryotic translation elongation factor 1 alpha 1 | 99.48 | ■ | |||||||
| 7913 | DEK oncogene | 66.79 | ||||||||
| 55646 | LYAR, Ly1 antibody reactive | 63.01 | ||||||||
| 1973 | EIF4A1, eukaryotic translation initiation factor 4A1 | 60.76 | ■ | ■ | ||||||
| 1786 | DNMT1, DNA (cytosine-5-)- methyltransferase 1 | 60.69 | ||||||||
| 10212 | DDX39A, DEAD (Asp-Glu-Ala-Asp) box polypeptide 39A | 54.05 | ||||||||
| 55749 | CCAR1, cell division cycle and apoptosis regulator 1 | 48.15 | ■ | ■ | ||||||
| 3315 | HSPB1, heat shock 27kDa protein 1 | 31.06 | ■ | |||||||
| 26135 | SERBP1, SERPINE1 mRNA binding protein 1 | 23.38 | ■ | |||||||
| 9276 | COPB2, coatomer protein complex, subunit beta 2 (beta prime) | 22.13 | ||||||||
| 6625 | SNRNP70, small nuclear ribonucleoprotein 70kDa (U1) | 21.81 | ■ | |||||||
| 26986 | PABPC1, poly(A) binding protein, cytoplasmic 1 | 20.29 | ■ | |||||||
| 3418 | IDH2, isocitrate dehydrogenase 2 (NADP+), mitochondrial | 18.27 | ■ | |||||||
Ranked by Proteome Discoverer Score.
NCBI Gene name linked to GI number identified in study. Unknown protein hits were identified by BLAST homology search.
The sum total of Proteome Discoverer (PD) scores for all identifications across the study.
The summary of previous HIV-1 protein interaction studies cited in text.
Table 3.
GI numbers two fold or greater changed between groups1
| Gene ID2 | Gene Name | PD Score Ratio (Inf/Cont) | Previous Studies3
|
|||||||
|---|---|---|---|---|---|---|---|---|---|---|
| NCBI HIV | Brass | Konig | Chertova | Raghavendra | Jäger | Kraft-Terry | Haverland | |||
| 7153 | TOP2A, DNA topoisomerase II,alpha | 6.558 | ■ | |||||||
| 71 | ACTG1, actin, gamma 1 | 3.898 | ■ | |||||||
| 4691 | NCL, nucleolin | 3.398 | ■ | ■ | ■ | |||||
| 10382 | TUBB, tubulin, beta class I | 3.022 | ■ | ■ | ||||||
| 3148 | HMGB2, high mobility group box 2 | 2.736 | ||||||||
| 3326 | HSP90AB1, heat shock protein 90kDa alpha (cytosolic), class B member 1 | 2.709 | ■ | ■ | ||||||
| 8243 | SMC1A, structural maintenance of chromosomes 1A | 2.7 | ■ | |||||||
| 8607 | RUVBL1, RuvB-like 1 | 2.479 | ■ | ■ | ■ | |||||
| 10992 | SF3B2, splicing factor 3b, subunit 2 | 2.369 | ■ | ■ | ||||||
| 6426 | SRSF1, serine/arginine-rich splicing factor 1 | 2.364 | ■ | |||||||
| 3017 | HIST1H2BC, histone cluster 1, H2bc | 2.314 | ■ | ■ | ||||||
| 7112 | TMPO, thymopoietin | 2.302 | ■ | ■ | ||||||
| 81 | ACTN4, alpha actinin 4 | 2.268 | ■ | ■ | ||||||
| 5479 | PPIB, peptidylprolyl isomerase B (cyclophilin B) | 2.235 | ■ | ■ | ■ | ■ | ||||
| 5245 | PHB, prohibitin | 0.414 | ■ | ■ | ||||||
Ranked by fold enrichment as measured by the ratio of total Proteome Discover (PD) score in the infected versus uninfected samples for indicated GI number.
NCBI Gene name linked to GI number identified in study. Unknown protein hits were identified by BLAST homology search.
The summary of previous HIV-1 protein interaction studies cited in text.
Identification of uniquely expressed proteins
The main objective of our study was to identify proteins which were enriched or depleted in HIV-infected nuclei. A simple subtractive analysis was used to measure relative protein abundance and identify differentially expressed factors. The control cell data set was used as reference to identify unique proteins in the HIV-1-infected nuclear samples and the vice versa performed to discover unique proteins in the uninfected samples. The thresholds of identification were set as at least two peptides per protein identified with not less than 99% confidence, which favored the identification of moderately to highly abundant proteins, and the criterion that any given protein must be identified in at least two or more of the five biological replicates. Based on these criteria, our subtractive analysis narrowed list of proteins to 163 proteins: 13 and 38 proteins were unique to the infected and control data sets, respectively; and 112 proteins were common to both (Fig. 3C) making the list of candidates for follow-up validation manageable. Forty three of these proteins are not currently listed in the HIV interaction database. Table 1 shows the 13 proteins found only in infected cell nuclei data set. The list is ranked by the total Proteome DiscovererTM protein score across all biological replicates, which is the sum of the scores of the individual peptides from any given protein identified in the analyzed samples. The protein score provided by Proteome DiscovererTM correlates with a spectral count which is relative to the abundance of a peptide (Bridges et al., 2007; Stevenson et al., 2009; Tu et al., 2014). Therefore a higher protein score reflects higher peptide abundance thus higher relative quantity of a protein across the samples.
A knowledge-based analysis with several previous RNAi (Brass et al., 2008; Konig et al., 2008) and proteomic studies (Chertova et al., 2006; Haverland, Fox, and Ciborowski, 2014; Jager et al., 2011; Kraft-Terry et al., 2010; Raghavendra et al., 2010), as well as the NCBI HIV interaction database (Fu et al., 2009) was performed to identify factors with known HIV interactions. Factors identified previously in those studies are denoted in the columns to the right of the table. Eight of the proteins in Table 1 have previously described interactions with HIV, five of those were interactions defined on the NCBI website.
Table 2 lists the 15 candidate proteins from the control samples with the highest total Proteome DiscovererTM score. These were factors found only in the control samples and may represent proteins that are down-regulated or removed from the nucleus during HIV infection of the cell. As seen in Table 2, a large percentage of the top 15 are previously described HIV factors. Overall, 30 of the 38 proteins in the control dataset have HIV-1 interactions defined in the referenced studies and/or the NCBI database. The complete list of the proteins in the dataset is provided in Additional file 1.
Table 2.
Top unique proteins identified in control cell nuclei1
| Gene ID2 | Gene Name | PD Score3 | Previous Studies4
|
|||||||
|---|---|---|---|---|---|---|---|---|---|---|
| NCBI HIV | Brass | Konig | Chertova | Raghavendra | Jäger | Kraft-Terry | Haverland | |||
| 58 | ACTA1, actin, alpha 1, skeletal muscle | 302.04 | ■ | |||||||
| 3008 | HIST1H1E, histone cluster 1, H1e | 109.82 | ■ | ■ | ||||||
| 55226 | NAT10, N-acetyltransferase 10 (GCN5-related) | 53.54 | ■ | |||||||
| 3010 | HIST1H1T, histone cluster 1, H1t | 47.24 | ||||||||
| 117159 | DCD, dermcidin | 41.03 | ■ | |||||||
| 55660 | PRPF40A, PRP40 pre-mRNA processing factor 40 homolog A | 36.27 | ||||||||
| 103 | ADAR, adenosine deaminase, RNA-specific | 65.18 | ■ | |||||||
| 3106 | HLA-B, major histocompatibility complex, class I, B | 31.81 | ■ | ■ | ■ | |||||
| 4869 | NPM1, nucleophosmin | 27.52 | ■ | |||||||
| 4926 | NUMA1, nuclear mitotic apparatus protein 1 | 25.28 | ■ | |||||||
| 27044 | SND1 staphylococcal nuclease and tudor domain containing 1 | 25.1 | ■ | ■ | ■ | |||||
| 292 | SLC25A5, solute carrier family 25,member 5 | 24.03 | ■ | |||||||
| 10291 | SF3A1, splicing factor 3a, subunit 1, 120kDa | 23.24 | ■ | ■ | ||||||
| 6742 | SSBP1, single-stranded DNA binding protein 1 | 22.75 | ■ | ■ | ||||||
| 255626 | HIST1H2BA, histone cluster 1,H2ba | 21.45 | ■ | |||||||
Ranked by Proteome Discoverer Score.
NCBI Gene name linked to GI number identified in study. Unknown protein hits were identified by BLAST homology search.
The sum total of Proteome Discoverer (PD) scores for all identifications across the study.
The summary of previous HIV-1 protein interaction studies cited in text.
Identification of Other Candidate factors
Focusing solely on unique proteins using stringent thresholds may miss important factors with less moderate changes in expression. To expand the number of proteins of interest, we sought to identify proteins differentially regulated between the control and infected nuclei. To do this we utilized an approach we used previously in a comparative proteomic study of HIV preintegration complexes (Schweitzer et al., 2013) in which we compared the total Proteome DiscovererTM score of each protein assignment across the infected and control samples to identify up- and down-regulated proteins. We distinguished those proteins with a greater than two-fold change in total score between the infected and control nuclei. These are listed in Table 3 and the ratio of the infected/control score is provided. Fourteen proteins were found with a >2-fold higher score in infected nuclei, whereas only one protein, Prohibitin, was found to be enriched in control cell nuclei. The knowledge-based analysis found that of these 15 proteins, 14 had previously defined interactions with HIV.
Bioinformatic analysis
Next, protein-protein interaction and centrality analysis were performed on the candidate proteins to identify important pathways and protein networks within the data set that might be missed by looking solely at individual proteins. First, protein-protein interaction analysis was performed with StringDB (v9.1, searched Jan. 6, 2014 (Franceschini et al., 2013); Fig. 4A). The algorithm produced four distinct clusters of interacting proteins (denoted with roman numerals in Fig. 4A). A small cluster (I) at the center of the map connected to the other three clusters. The three central proteins in this cluster were Nucleolin (NCL), Nucleophosmin (NPM1), and RuvBL1. NPM1 alone connected to all clusters. Cluster II included several factors associated with cell homeostasis, including Heat Shock Protein 90 (HSP90AB1), Actin (ACTG1), and PolyA Binding Protein (PABPC). The largest cluster (III) contained eight proteins, and was comprised of numerous splicing factors including SRSF1, SF3A1, and SF3B2. The fourth cluster contained four proteins, TOP2A, TMP0, HMGB2, and DEK, associated with chromosomal and nuclear architecture. To complement the protein-protein interaction analysis we also measured the summed ranked for Centrality for the candidate proteins ((Smoot et al., 2011); Fig. 4B). This analysis scored proteins based on their position relative to the center of cellular pathways. Identifying these factors may point toward pathways important for HIV infection. Consistent with the protein-protein interaction analysis, NPM1 was the factor with the highest rank and three of the top four proteins were from the central cluster (I) in Fig. 4A. Combined the bioinformatic results indicated that HIV infection alters the nuclear expression of proteins involved in splicing, chromosomal and nuclear architecture, as well as nuclear homeostasis.
Figure 4. Bioinformatic analysis of candidate proteins.

(A) Cluster analysis of unique and differentially regulated proteins. Analysis was performed using STRING db (Jan 17, 2014) to generate a protein-protein interaction network containing experimental, co-expression, database, and textmining evidence. Lines between factors denote known or predicted interactions and stronger associations are represented by thicker lines. (B) Rank of centrality of the candidate factors. Centrality was analyzed for all factors identified in unique and differentially regulated data sets (see text). Bars are coded to data set as indicated by legend.
Validation of MS data
The proteomic approach we used made protein identifications and rankings based on probability algorithms, necessitating the biochemical validation of the phenotypes of candidate proteins. To confirm protein assignments we examined the expression profiles of selected candidate proteins in the subcellular fractions of C8166-45 cells by immunoblot. For these studies all four subcellular compartments were analyzed since not all the candidate proteins are reported in the literature to be exclusively nuclear. Equal quantities of fraction were analyzed by SDS-PAGE and immunoblot for candidate proteins. The factors that were detected as predicted by MS in two or more biological replicates are shown in Fig. 5.
Figure 5. Validation of candidate factors identified using MS.

Western blot confirmation of candidate factors identified in MS studies. Proteins detected are listed on the left and the subcellular fractions are the same as described in Fig 1. (A) Proteins identified as unique to HIV-1 infected cells (Table 1). (B) Factors from unique control data set (Table 2). (C) Expression of protein predicted to be changed in infected nuclei (Table 3). (D) Nucleolar factors from cluster I of Fig. 4A bioinformatic analysis. Blots are representative of two or more biological replicates.
The factors from Table 1 that showed distinct phenotypes are presented in Fig. 5A. Eukaryotic translation elongation factor 1 alpha 1 (EEF1A1) was the highest ranked protein based on Proteome Discoverer score. This was not surprising as it interacts with several HIV proteins including Matrix (Cimarelli and Luban, 1999), Rev (Naji et al., 2012), Tat (Wu-Baer et al., 1996), Integrase (Allouch and Cereseto, 2011; Warren et al., 2012), and Reverse Transcriptase (Warren et al., 2012). The level of EEF1A1 was confirmed to be higher in the nuclei of infected versus uninfected C8166-45 cells (Fig. 5A, top panels, compare lane 3 to 7). In addition to its predicted size, we observed the presence smaller MW bands in the nuclei of infected cells. These smaller bands may represent be products of cleavage as EEF1A1 is cleaved by HIV-1 protease (Cimarelli and Luban, 1999). Several other proteins from Table 1, including DEK oncogene (DEK), Ly1 Antibody Reactive (LYAR), and Serpin Peptidase Inhibitor member 1 (SERPINE1) mRNA binding protein 1 (SERBP1) were also validated by immunoblot to be present at substantially higher levels in infected cell nuclei (Fig. 5A). SERBP1 was originally identified as a SERPINE1 mRNA interacting protein (Heaton et al., 2001). SERPINE1 is a regulatory protein of the fibrinolytic system that acts on tissue plasminogen activator and urokinase to limit activation of the fibrinolytic pathway (Binder et al., 2002). In addition to the increase in nuclear SERBP1 in infected cells, we also discovered that levels of SERBP1 in the membrane/organelle fraction were substantially reduced in infected cells compared to uninfected cells (4th panel, compare lane 2 to 6), suggesting deregulation of its intracellular localization.
A number of the candidate proteins found at the threshold cutoff to be unique to control data set or predicted to be down regulated in infected cells were evaluated by immunoblot. Prohibitin (PHB) and N-acetyltransferase 10 (NAT10) were the only proteins confirmed to have lower expression in the nuclei of HIV infected C8166-45 cells by immunoblot (Fig. 5B). PHB levels were also decreased in the cytoskeletal/insoluble fraction of infected cells, but showed increased expression in the membrane/organelle fraction. PHB is a multifunctional protein involved in cell signaling, growth and tumor suppression. It can be a negative regulator of the cell cycle as well as regulate mitochondrial metabolism and cellular aging (Coates et al., 2001). Previous reports of PHB expression during HIV infection are mixed. PHB appears to be over-expressed when cells were exposed to HIV envelope protein (Molina et al., 2007), but Vpr expression reduces PHB levels (He et al., 2009). Recently PHB was found to interact directly with HIV-1 envelope protein (Emerson et al., 2010; Jager et al., 2011). Overall NAT10 levels in the nuclei of C8166-45 cells were low compared to the insoluble fraction, and decrease further upon HIV infection (Fig. 5B, lower panel lanes 3 vs. 7). NAT10 is a lysine acetyltransferase involved in histone acetylation, telomerase activity, and microtubular organization and nuclear architecture (Larrieu et al., 2014; Lv et al., 2003; Shen et al., 2009). Inhibition of NAT10 reduces DNA damage signaling and improves cell health, suggesting that down-regulation during HIV infection may support T-cell survival and enhanced virus replication.
Fig. 5C shows the immunoblot analysis of two candidate proteins from Table 3, CypB and HSP90AB. Consistent with MS data, peptidyl prolyl isomerase B, or cyclophilin B (CypB) showed higher nuclear levels in HIV infected cells (top panels). Two additional higher MW bands were also observed in the nuclear fraction of infected cells (lane 3). CypB levels were also higher in the cytosolic fractions of infected cells (lane 1 vs. 5). CypB is a member of the immunomodulatory cyclophilin family. It shares significant homology in its core domain with Cyclophilin A (CypA), a well-described HIV-1 co-factor that interacts with HIV-1 Capsid and is required for efficient HIV replication. However, the expression of CypA was distinct from CypB (middle panels). The overall levels of CypA appeared lower in HIV infected cells, but it was absent in the nuclear fractions of both infected and control cells. Combined this demonstrated that despite their homology, the expression of CypB and CypA are differentially regulated in HIV infected cells. The overall expression of HSP90AB, including in the nucleus, was higher in HIV infected cells, consistent with infection-induced cellular stress (lower panels). Notably, HSP90 can promote HIV-1 replication by increasing HIV transcription (Roesch et al., 2012).
Finally we focused on the proteins in cluster I of Fig. 4A- NCL, NPM1, and RuvBL1. Only low levels of NCL were found in uninfected C8166-45 cells, but upon HIV infection there was a distinct increase in its nuclear levels. (Fig. 5D, top panels). Two distinct bands were detected in the NCL blots, possibly consistent with auto-cleavage that induces apoptosis (Li et al., 2009). In multiple replicates we saw a decrease of NPM1 in the cytosolic and membrane/organelle fractions, but only a slight increase in nuclei (middle panels). RuvBL1 exhibited slightly higher levels in infected C8166-45 nuclei, as well as an increase in the cytoskeletal/insoluble fraction (lower panels). It was less abundant in the membrane/organelle fraction of infected cells and predominantly expressed in the insoluble fraction where its levels appeared to increase during HIV infection. Overall, these data demonstrate that HIV infection modulates nucleolar protein expression.
Independent confirmation of localization phenotypes
The above experiments investigated the nuclear expression of the candidate proteins as predicted by MS in the same cells used for the MS analysis. To extend these observations and confirm the altered nuclear expression of the candidate proteins during HIV-1 infection we investigated each protein in an independent infection model using Jurkat E6-1 T-cells. For these experiments we performed a series of time-course infections and harvested cells at 24, 48, and 72 hpi to provide more data points of analysis. Cells were fractioned into subcellular compartments as before. Infections were monitored by anti-Gag immunoblot (Fig. 6A, top panel) and we consistently detected p55 Gag and p24 capsid beginning at 24 hpi in the cytosolic and membrane fractions. The integrity of nuclear fractions was again confirmed by the absence of GAPDH and the presence of TOPO IIa only in nuclear fractions (Fig. 6A, bottom two panels).
Figure 6. Independent validation of candidate proteins.

Immunoblot evaluation of candidate factors during time course infection of Jurkat E6-1 cells. Infected Jurkat cells were harvested and fractionated at hours post infection (hpi) indicated at top. Proteins listed at left were evaluated as described in Figs 1 and 5. Control blots (a), factors upregulated in infected (b) and control (c) cells, and cluster I factors (d) are shown. Data is representative of at least two independent infection experiments.
All of the proteins mentioned above were investigated in the Jurkat experiments. Those proteins that showed a notable phenotype are shown in Fig. 6B–D. CypB, and SERBP1 both showed an increase in the nuclei of HIV infected cells verses uninfected cells, confirming the phenotype we observed in C8166-45 T-cells. In addition to an increased nuclear accumulation, CypB also showed a slight increase in cytoplasmic levels in infected Jurkat cells. Notably, we did not observe the presence of the large MW bands in Jurkat lysates, suggesting that those forms were unique to C8166-45 cells. As with the C8166-45 experiments, we also looked at the distribution of CypA. In the Jurkat cells CypA localized distinctly to the cytoplasmic fraction, and its levels did not appear to change substantially. SERBP1 showed a very similar response to HIV infection in the Jurkat cells as with the C8166-45 cells. In uninfected cells it was present in both the cytosolic and membrane/organelle fractions. As HIV infection progressed there was a loss of membrane/organelle-associated SERBP1 and a gain of SERBP1 in the nuclear fraction, suggesting that its intracellular localization changed, but the overall levels of SERBP1 did not.
In contrast to the C8166-45 cells, PHB was not detected in the nuclei of Jurkat cells. Low levels were detected in the membrane/organelle fraction of the Jurkat cells, and it increased during HIV-1 infection (Fig. 6C, top panels). The phenotype of NAT10 during HIV infection of Jurkat cells was similar to that seen with the C8166-45 cells- expression in the nuclear and insoluble fractions, both of which were reduced during HIV replication (middle panels). Of note, ADAR, a candidate found unique in control nuclei that we were unable to validate in the C8166 samples, showed a reduction in nuclei over the course of Jurkat cell infection (bottom panels).
The Cluster I factors- NCL, NPM1, and RuvBL1 are shown in Fig. 6D. In contrast to the C8166-45 cells, NCL showed strong cytosolic localization in uninfected Jurkat cells. This is consistent with previous observations of leukemic cells (Otake et al., 2007). In agreement with the C8166-45 infection data, the nuclear level of NCL also increased in infected Jurkat E6-1 cells (Fig 6D, top panels). Notably however, only a single band was detected in the Jurkat cells compared to the C8166-45 cells. NPM1 showed a decrease in the cytosolic and membrane/organelle fractions similar to the C8166-45 cells, but we did not see any remarkable change in nuclei (middle panels). In contrast to the C8166-45 infection, RuvBL1 levels appeared to decrease in the nuclei of HIV-1 infected Jurkat cells and the higher molecular weight isoform decreased in the insoluble fraction (bottom panels).
Discussion
Combined antiretroviral therapy (cART) effectively controls HIV infection, but it does not lead to virus eradication. Moreover, resistance to available antivirals continues to rise. Targeting of the host cell factors or pathways is a promising approach to address these issues and augment existing therapies. Numerous MS studies have sought to define the role of host factors during HIV-1 infection (Birse et al., 2013; Chen et al., 2012; Engeland et al., 2014; Haverland, Fox, and Ciborowski, 2014; Naji et al., 2012; Schweitzer et al., 2013), nevertheless this area remains underexplored. The approach used in this study, examining the changes in the proteome of T-cell nuclei upon HIV-1 infection, aimed to identify nuclear proteins important for HIV pathogenesis either as factors that promote HIV replication or ones that combat virus infection. Such factors may reflect the translocation of a protein in or out of the nucleus, or de novo synthesis or degradation of a resident nuclear protein. Overall, our data analysis strategy identified fifty one unique factors in either infected or control nuclei and an additional 15 differentially regulated proteins between the two conditions. Forty three of these factors are not currently listed on the NCBI HIV interaction database. The validation experiments distinguished 13 candidate proteins that had altered expression patterns in either the C8166-45 or Jurkat E6-1 cells by immunoblot.
Our goal was to map the global changes in protein expression in HIV infected nuclei. Two other proteomic studies have focused on the nuclear compartment, specifically changes to the nucleolus upon Tat expression (Jarboui et al., 2012), and alterations in the nuclear membrane of HIV-infected T-cells (Monette, Pante, and Mouland, 2011). Our data had little overlap with the results of the Tat over-expression study. This might be because of our use of replicating virus, but may also suggest that our study captured more factors related to nuclear import and/or integration. Consistent with that, we saw a greater overlap with the nuclear membrane study which observed changes in NCL, NPM1, and CypB (among other factors). Notably, our approach likely removed the nuclear membrane as we did not detect nucleoporins or other nuclear membrane proteins. Interestingly, both ADAR and HSP90AB were common factors to all three nuclear studies, suggesting they have important roles in the nuclear compartment during HIV infection.
The NCBI HIV interaction database continues to grow. Overall, a majority of the proteins identified in this study to be differentially regulated in both uninfected and infected samples have been previously reported as HIV-1 dependent factors (Tables 1–3). Analysis of protein-protein interactions identified four clusters of factors. The central cluster contained NCL, NPM1, and RuvBL1, which were three of the top four proteins in the Centrality analysis of the data set. These proteins are components of nucleoli and involved in ribosomal synthesis (Penman et al., 1966; Perry, 1962), cell cycle progression (Liu and Yung, 1999), as well as cell signaling (Inder et al., 2009). In our studies, NCL was found to be upregulated in the nuclei of both C8166-45 and Jurkat cells. Several studies suggest that NCL is an important HIV factor: It is present in HIV-1 virions possibly through interaction with the HIV RNA via its 4 RNA binding domains (Ghisolfi-Nieto et al., 1996); and it also interacts with HIV-1 Envelope protein (Nisole et al., 2002), and both the Gag polyprotein and Matrix in budding virions (Ueno et al., 2004). Both NPM1 and RuvBL1 also showed changed expression in HIV infected cells, although the changes were more notable in the cytoslic and membrane/organelle fractions. Combined, these data suggest strongly that this cluster of proteins play an important role in HIV replication or pathology and warrant further investigation. Interestingly, another factor our screen identified, LYAR, reportedly plays a critical role in the nucleolar stabilization of NCL. The nuclear levels of LYAR, like NCL, increased during infection. LYAR is a nucleolar zinc finger protein initially identified in T-cell leukemia. The exact function of LYAR is not understood, but it has been implicated in cell growth, tumorgenesis, self-renewal of embryonic stem cells, and medulloblastoma (Li et al., 2009; Su et al., 1993; Swartling et al., 2010). Thus, it is tempting to speculate that the upregulation of LYAR in nuclei may serve an anti-apoptotic mechanism in HIV infected T-cells.
CypB showed increased nuclear levels during infection of both C8166-45 and Jurkat cells. CypB is a member of the cyclophilin family, known for inducing immunosuppression when complexed with Cyclosporine A (CsA). CypA and B are the two primary members of the family and share significant homology in their core domains. CypB has longer N- and C-termini- the CypB N-terminus contains an ER leader and nuclear localization sequence (Rycyzyn et al., 2000); and the C-terminus has an ER retention signal (Arber et al., 1992). CypB has been shown to be involved multiple cellular processes such as the interferon-3 response to viral infection through modulating IRF3 translocation to the nucleus (Obata et al., 2005). CypB is also essential for the nuclear retrotransport of Prolactin (PRL) following internalization of Prolactin-bound receptor (PRL/PRLr). Finally, CD147 stimulation by CypB induces intracellular Ca2+ flux stimulating T cell proliferation and produces a chemotactic response in primary human neutrophils (Yurchenko et al., 2001).
Both CypA and CypB were identified as HIV-1 Gag binding proteins in a yeast two-hybrid cDNA screen (Luban et al., 1993). Subsequent studies found CypB binds at a stronger affinity due to a hydrophobic N-terminal ER signal sequence rendering the Gag-CypB interaction less sensitive to disruption by CsA compared to Gag-CypA complexes (Braaten et al., 1997). CypB has not been investigated at as an independent factor, likely due to the assumption that with its homology to CypA it has similar functions. Our results demonstrate clearly that the expression of CypB is independently regulated during HIV infection, arguing that it may play a distinct role in HIV infection. Our continuing studies are investigating what that role may be.
SERBP1 showed a consistent phenotype in both C8166-45 and Jurkat cells, suggesting that it plays an important role in HIV-1 infection. Consistent with that idea it was previously identified in a proteomic screen of HIV-1 preintegration complexes (Raghavendra et al., 2010). SERBP1 is an RNA binding protein that binds the cyclic nucleotide-responsive sequence of the SERPINE1 mRNA and may regulate its stability (Heaton et al., 2001), although its exact effect is not known. SERPINE1 is a key component of the fibrinolytic pathway that regulates blood coagulation (Binder et al., 2002). It blocks tissue plasminogen activator and urokinase to limit activation of the fibrinolytic pathway. Blood levels of SERPINE1 are elevated in HIV Associated Lipidodystrophy Syndrome which may be the cause of the associated thrombocytosis (He et al., 2005). The regulatory mechanisms for the expression of SERPINE1 are not fully understood. It is tempting to speculate that HIV-1 induced expression of SERPBP1 expression may be involved in SERPINE1 regulation. However, we did not detect the 45 kDa form of SERPINE1 in either the C8166-45 or Jurkat E6-1 cells (data not shown). SERBP1 also interacts with the C-terminal region of the chromo-helicase-DNA-binding domain protein 3 (CHD-3), which suggests it could play a role in the regulation of other nuclear functions such as chromatin remodeling (Lemos et al., 2003). Interestingly, both SERPINE1 and CHD-3 have been shown to interact with HIV-1 Tat. A recent study found that SERBP1 localizes to nucleoli upon stress (Lee et al., 2014). Ongoing studies are working to determine what role the up-regulation of nuclear SERBP1 plays during HIV infection.
As these studies show, mass spectrometry is a powerful tool to uncover cellular networks and pathways associated with disease. As will all “omics” studies, there are limitations to this study, including the use of a single cell line and virus clone, and a high MOI. In general, at least four issues heavily influence progress in discovering cellular proteins that might be used as potential targets for new therapies in infectious disease. First is the high dynamic range of abundance between constitutively expressed structural or housekeeping proteins (on the high end) versus specialized, less abundant regulatory factors (on the low end). Second is the short time span when the differential expression of cellular proteins can be measured and detected during infection. Third is the distribution of specific factors between cellular compartments where proteins perform their function(s). Fourth is the accurate representation of in vivo pathology by in vitro models. The first issue is addressed at the level of instrumentation and methods of data acquisition. New technologies, such as SWATH-MS (Haverland, Fox, and Ciborowski, 2014), show promise for high resolution mapping of a wide range of expression levels in single samples. The solution for the second issue lies in experimental design, while the third issue can be resolved by interrogating organelle proteomes. The solution to the fourth issue is less transparent. Cell lines are advantageous in proteomic experiments for their reproducible infections and homogenous proteomes as compared to primary cells which can suffer from donor to donor variability. Moreover, a more consistent level of infection can be achieved across biological replicates, thus addressing issue two. However, as demonstrated by our data, factors may show disparate expression and/or subcellular localization between cell lines. Even with the small number of proteins we looked at, several proteins showed different expression patterns between the C8166-45 and Jurkat E6-1 cell lines. These differences may result from the cause of transformation- C8166-45 cells derive from an HTLV-infected leukemia (Salahuddin et al., 1983), whereas the Jurkat cells are a clonal derivative from a non-viral leukemia (Weiss et al., 1984). Additional studies utilizing primary peripheral blood mononuclear cells or monocyte-derived macrophages may more closely mimic the in vivo situation in infected individuals. Again, new technology and approaches, such as SWATH-MS should be able to address the issues of donor-to-donor variation or variability in infection kinetics between donors to identify factors important for HIV infection in vivo.
Methods
Cell culture, infections and nuclear isolations
C8166-45 and Jurkat E6-1 cells were cultured in RPMI 1640 media. 293T cells were cultured in DMEM media. All media was supplemented with 10% fetalclone III (Hyclone, Logan, UT USA), 8 mM L-glutamine, 100 U/mL penicillin, and 100 U/ml streptomycin. Cells were cultured in humidified incubators at 37°C and 5% CO2. HIV-1 NLX virus stocks were produced by transient transfection of 293T cells using Polyethylenimine (PEI) as previously described (Schweitzer et al., 2013). Viral supernatants were collected over 72 hours, filter concentrated and stored at –80° C. Virus was treated with 100 U/ml Turbo DNase (Ambion, Austin, TX USA) for 60 min at 37° C prior to infecting cells. For nuclear isolation experiments 1x10⁸ C8166-45 cells were infected by the spinoculation technique as described previously (O'Doherty et al., 2000; Schweitzer et al., 2013). At 20 hours post infection the subcellular compartments (cytosol, membrane/organelle, nuclear, and cytoskeleton/insoluble) were isolated using the Qproteome Cell Compartment kit as described by the manufacturer (Qiagen, Valencia, CA USA). Protein concentrations were determined by BCA protein assay (Thermo Scientific, Rockford, IL USA). For time-course experiments, 4x10⁷ Jurkat E6-1 cells were spinoculated with VSVg pseudotyped HIV-1 NLX virus. At each time-point (24, 48, 72 hpi), 1x10⁷ cells were removed and subcellular compartments isolated and processed as described above.
In-gel tryptic digests
Nuclear fractions (20 μg/lane) were separated by standard SDS-PAGE and protein bands were visualized by staining with Coomassie brilliant blue. Each lane was cut into 28 individual slices that were processed individually in glass tubes. In-gel tryptic digests were performed essentially as described before (Schweitzer et al., 2012) using a modified protocol adapted from (Shevchenko et al., 2001). Briefly, the Coomassie blue stain was removed by washing with 50% H2O/50% acetonitrile (ACN) followed by 50% ACN/50 mM NH4HCO3, and 50% ACN/10 mM NH4HCO3. Each slice was dried by centrifugation under vacuum and incubated with 10 μL (0.1 μg/μL) modified trypsin (Promega, Madison, WI USA) at room temperature for 10 minutes. Then 50 μL NH4HCO3 was added and the sample incubated overnight at 37° C. Digested peptides were extracted with three washes of 0.1% Trifluroacetic acid in 60% ACN with shaking for 60 minutes at room temperature. The washes were combined and peptides purified using C18 Zip Tips® according to manufacturer's procedure (Millipore, Billerica, MA USA). Samples were dried by vacuum centrifugation and resuspended in 0.1% formic acid in HPLC-grade water for LC-MS/MS analysis.
Nano-LC-MS/MS
LC-MS/MS was performed as described in (Schweitzer et al., 2013). Briefly, samples were separated using an Eksigent nano-LC system equipped with two alternating peptide traps and a PicoFrit C18 column-emitter from New Objectives (Woburn, MA USA) and analyzed with a LTQ Orbitrap XL (Thermo Scientific, Inc., San Jose, CA USA). Samples were loaded onto the peptide trap with 2% acetonitrile (ACN) + 1% formic acid and eluted using a 60 minute linear gradient of 2–60% ACN + 1% formic acid. The data-dependant mode was used for the acquisition method with one precursor scan in the Orbitrap, followed by fragmentation of the 5 most abundant peaks in the CID, detected in the LTQ. Resolution of the precursor scan was set to 60,000, scanning from 300–2000 m/z. Precursor peaks with a minimum signal count of 50,000 were dynamically excluded after two selections for 60 seconds within a range +/−10 ppm with Monoisotopic Precursor selection (MIPS) enabled. Previously found background peaks were included in a mass rejection list. Collision energy was set to 35 using an isolation width of 2 and an activation Q of 0.250.
Proteome DiscovererTM 1.2 software (Thermo Fisher Scientific) was used to generate peak lists. The method outline used in the spectrum selector node of the Proteome DiscovererTM software included the following scan event filters: fragmentation method, ionization source, and Unrecognized Activation Type Replacements parameters. All filters listed above and the precursor charge state (high/low), retention time, minimum peak count, total intensity threshold value were all set to default settings. The Max and Min precursor mass settings were 5000 Da and 350 Da, respectively. The NCBI.fasta database from http://ftp.ncbi.nih.gov was created on November 2011 with a file size of 118783 kB and was restricted to Homo sapiens. The search parameters were: Fully tryptic digested peptides only, two missed cleavages allowed, variable modifications of oxidized methionine (+15.995Da), and fixed modification of carboxymethyl cysteine (+58.00Da). The spectra were searched using Sequest™ algorithm in Proteome Discoverer 1.2 software (Thermo Scientific Inc.) using the following parameters: threshold for Dta generation = 10000, peptide tolerance for ion trap ms/ms was 1.80Da, and precursor ion mass tolerance = 10 ppm. Database NCBI.fasta from http://ftp.ncbi.nih.gov was used for protein identification with at least two unique peptides and two missed cleavage sites allowed for identification. The criteria used for acceptance of peptide assignments are as follows: The minimal X-corr value for charge state > 7 was 1.0, minimal X-corr value for each charged state ranging from 1 to 7 was 1.50, 2.0, 2.25, 1.0, 1.0, 1.0 and 1.0 respectively. Two target values, a strict FDR of 0.01 and a relaxed FDR of 0.05 were applied for a decoy database search.
Bioinformatic analyses
Bioinformatic analysis was performed only on the 163 proteins identified in the study. Protein-protein interactions were investigated using STRING 9.1 (http://string-db.org) and contain experimental, co-expression, database, and text mining evidence using a confidence setting of greater than 0.4 (medium confidence). Centrality analysis was performed using Cytoscape v. 3.0.2 (www.cytoscape.org) and the CentiScaPe 2.0 plug-in. Node eccentricity, radiality and closeness within the network were individually ranked and the summed rank was used for the total centrality measure.
Immunobloting
Protein concentrations of all samples were measured by BCA protein assay (Pierce Biotechnology). Samples were normalized by protein concentration with PBS, mixed 1:1 with 2x SDS-PAGE loading buffer, boiled for 10 min. and separated by SDS-PAGE. Proteins were transferred to PVDF and detected by Western blot using the following primary antibodies: anti-ADAR (D-8), anti-CypA (C-14), anti-CypB (C-15), anti-DEK (H-300), anti-EEF1A1 (CBP-KK1), anti-GAPDH (6C5), anti-SERBP1/PAI-RBP1 (1B9), anti-HSP90AB (N-17), anti-PHB (H-80), anti-NAT10 (B-4), anti-RuvBL1 (N-15), anti-B23/NPM1 (H-106), and anti-C23/NCL (MS-3) were all obtained from Santa Cruz Biotechnology (Santa Cruz, CA USA); anti-TOPO IIa (31) from BD Biosciences (San Jose, CA USA); and the anti-LYAR antibody (P01) from Abnova (Taipei City Taiwan). HRP conjugated anti-rabbit, anti-mouse IgG secondary (GE Healthcare, Piscataway, NJ USA) or anti-goat IgG secondary (Sigma, St. Louis, MO USA) antibody were used to detect primary antibody and visualized by chemiluminescent staining (Pierce Biotechnology). Images were captured using radiographic film, scanned to computer, adjusted for brightness and contrast if necessary, and cropped for size.
Supplementary Material
HIGHLIGHTS.
We identify changes in the expression of nuclear proteins during HIV-1 infection.
163 nuclear proteins were found differentially regulated during HIV-1 infection.
Bioinformatic analysis identified several nuclear pathways altered by HIV infection.
Candidate factors were validated in two independent cell lines.
Acknowledgments
This work was supported by grants from the National Institutes of Health (A1080348 (M.B.) and DA030962 (P.C.)). Jason DeBoer is funded by the US Army's Medical Service Corp Long Term Health Education Program.
Appendix A. Supplementary data
Additional file 1 contains a complete list of all proteins identified as unique in infected nuclei, unique in control nuclei, as well as proteins that were differentially expressed between the two experimental groups.
Footnotes
Author Contributions
JD performed the majority of the experiments and wrote the manuscript. TJ performed the mass spectrometry experiments. CM carried out infection and immunoblot experiments. NH performed data and bioinformatic analyses. PC helped conceive the study, designed the proteomic and bioinformatic approaches and oversaw their implementation, and helped write the manuscript. MB conceived of the study, participated in its design and implementation, performed immunoblots, and helped write the manuscript.
Publisher's Disclaimer: This is a PDF file of an unedited manuscript that has been accepted for publication. As a service to our customers we are providing this early version of the manuscript. The manuscript will undergo copyediting, typesetting, and review of the resulting proof before it is published in its final citable form. Please note that during the production process errors may be discovered which could a3ect the content, and all legal disclaimers that apply to the journal pertain.
References
- Allouch A, Cereseto A. Identification of cellular factors binding to acetylated HIV-1 integrase. Amino Acids. 2011;41(5):1137–45. doi: 10.1007/s00726-009-0444-3. [DOI] [PubMed] [Google Scholar]
- Arber S, Krause KH, Caroni P. s-cyclophilin is retained intracellularly via a unique COOH-terminal sequence and colocalizes with the calcium storage protein calreticulin. The Journal of cell biology. 1992;116(1):113–25. doi: 10.1083/jcb.116.1.113. [DOI] [PMC free article] [PubMed] [Google Scholar]
- Binder BR, Christ G, Gruber F, Grubic N, Hufnagl P, Krebs M, Mihaly J, Prager GW. Plasminogen activator inhibitor 1: physiological and pathophysiological roles. News Physiol Sci. 2002;17:56–61. doi: 10.1152/nips.01369.2001. [DOI] [PubMed] [Google Scholar]
- Birse KM, Burgener A, Westmacott GR, McCorrister S, Novak RM, Ball TB. Unbiased proteomics analysis demonstrates significant variability in mucosal immune factor expression depending on the site and method of collection. PLoS One. 2013;8(11):e79505. doi: 10.1371/journal.pone.0079505. [DOI] [PMC free article] [PubMed] [Google Scholar]
- Braaten D, Ansari H, Luban J. The hydrophobic pocket of cyclophilin is the binding site for the human immunodeficiency virus type 1 Gag polyprotein. Journal of Virology. 1997;71(3):2107–13. doi: 10.1128/jvi.71.3.2107-2113.1997. [DOI] [PMC free article] [PubMed] [Google Scholar]
- Brass AL, Dykxhoorn DM, Benita Y, Yan N, Engelman A, Xavier RJ, Lieberman J, Elledge SJ. Identification of host proteins required for HIV infection through a functional genomic screen. Science. 2008;319(5865):921–6. doi: 10.1126/science.1152725. [DOI] [PubMed] [Google Scholar]
- Bregnard C, Zamborlini A, Leduc M, Chafey P, Camoin L, Saib A, Benichou S, Danos O, Basmaciogullari S. Comparative proteomic analysis of HIV-1 particles reveals a role for Ezrin and EHD4 in the Nef-dependent increase of virus infectivity. J Virol. 2013;87(7):3729–40. doi: 10.1128/JVI.02477-12. [DOI] [PMC free article] [PubMed] [Google Scholar]
- Bridges SM, Magee GB, Wang N, Williams WP, Burgess SC, Nanduri B. ProtQuant: a tool for the label-free quantification of MudPIT proteomics data. BMC bioinformatics. 2007;8(Suppl 7):S24. doi: 10.1186/1471-2105-8-S7-S24. [DOI] [PMC free article] [PubMed] [Google Scholar]
- Bushman FD, Malani N, Fernandes J, D'Orso I, Cagney G, Diamond TL, Zhou H, Hazuda DJ, Espeseth AS, König R, Bandyopadhyay S, Ideker T, Goff SP, Krogan NJ, Frankel AD, Young JAT, Chanda SK. Host Cell Factors in HIV Replication: Meta-Analysis of Genome-Wide Studies. PLoS Pathog. 2009;5(5):e1000437. doi: 10.1371/journal.ppat.1000437. [DOI] [PMC free article] [PubMed] [Google Scholar]
- Chen KC, Wang TY, Chan CH. Associations between HIV and human pathways revealed by protein-protein interactions and correlated gene expression profiles. PLoS One. 2012;7(3):e34240. doi: 10.1371/journal.pone.0034240. [DOI] [PMC free article] [PubMed] [Google Scholar]
- Chertova E, Chertov O, Coren LV, Roser JD, Trubey CM, Bess JW, Jr, Sowder RC, 2nd, Barsov E, Hood BL, Fisher RJ, Nagashima K, Conrads TP, Veenstra TD, Lifson JD, Ott DE. Proteomic and biochemical analysis of purified human immunodeficiency virus type 1 produced from infected monocyte-derived macrophages. J Virol. 2006;80(18):9039–52. doi: 10.1128/JVI.01013-06. [DOI] [PMC free article] [PubMed] [Google Scholar]
- Cimarelli A, Luban J. Translation elongation factor 1-alpha interacts specifically with the human immunodeficiency virus type 1 Gag polyprotein. J Virol. 1999;73(7):5388–401. doi: 10.1128/jvi.73.7.5388-5401.1999. [DOI] [PMC free article] [PubMed] [Google Scholar]
- Coates PJ, Nenutil R, McGregor A, Picksley SM, Crouch DH, Hall PA, Wright EG. Mammalian prohibitin proteins respond to mitochondrial stress and decrease during cellular senescence. Experimental cell research. 2001;265(2):262–73. doi: 10.1006/excr.2001.5166. [DOI] [PubMed] [Google Scholar]
- Coiras M, Camafeita E, Ureña T, López JA, Caballero F, Fernández B, López-Huertas MR, Pérez-Olmeda M, Alcamí J. Modifications in the human T cell proteome induced by intracellular HIV-1 Tat protein expression. PROTEOMICS. 2006;6(S1):S63–S73. doi: 10.1002/pmic.200500437. [DOI] [PubMed] [Google Scholar]
- Emerson V, Holtkotte D, Pfeiffer T, Wang IH, Schnölzer M, Kempf T, Bosch V. Identification of the Cellular Prohibitin 1/Prohibitin 2 Heterodimer as an Interaction Partner of the C-Terminal Cytoplasmic Domain of the HIV-1 Glycoprotein. Journal of Virology. 2010;84(3):1355–1365. doi: 10.1128/JVI.01641-09. [DOI] [PMC free article] [PubMed] [Google Scholar]
- Engeland CE, Brown NP, Börner K, Schümann M, Krause E, Kaderali L, Müller GA, Kräusslich H-G. Proteome analysis of the HIV-1 Gag interactome. Virology. 2014;460–461:194–206. doi: 10.1016/j.virol.2014.04.038. [DOI] [PubMed] [Google Scholar]
- Fellay J, Shianna KV, Ge D, Colombo S, Ledergerber B, Weale M, Zhang K, Gumbs C, Castagna A, Cossarizza A, Cozzi-Lepri A, De Luca A, Easterbrook P, Francioli P, Mallal S, Martinez-Picado J, Miro JM, Obel N, Smith JP, Wyniger J, Descombes P, Antonarakis SE, Letvin NL, McMichael AJ, Haynes BF, Telenti A, Goldstein DB. A Whole-Genome Association Study of Major Determinants for Host Control of HIV-1. Science. 2007;317(5840):944–947. doi: 10.1126/science.1143767. [DOI] [PMC free article] [PubMed] [Google Scholar]
- Franceschini A, Szklarczyk D, Frankild S, Kuhn M, Simonovic M, Roth A, Lin J, Minguez P, Bork P, von Mering C, Jensen LJ. STRING v9.1: protein-protein interaction networks, with increased coverage and integration. Nucleic acids research. 2013;41(Database issue):D808–15. doi: 10.1093/nar/gks1094. [DOI] [PMC free article] [PubMed] [Google Scholar]
- Fu W, Sanders-Beer BE, Katz KS, Maglott DR, Pruitt KD, Ptak RG. Human immunodeficiency virus type 1, human protein interaction database at NCBI. Nucleic acids research. 2009;37(Database issue):D417–22. doi: 10.1093/nar/gkn708. [DOI] [PMC free article] [PubMed] [Google Scholar]
- Fuchigami T, Misumi S, Takamune N, Takahashi I, Takama M, Shoji S. Acid-labile formylation of amino terminal proline of human immunodeficiency virus type 1 p24(gag) was found by proteomics using two-dimensional gel electrophoresis and matrix-assisted laser desorption/ionization-time-of–flight mass spectrometry. Biochem Biophys Res Commun. 2002;293(3):1107–13. doi: 10.1016/S0006-291X(02)00329-7. [DOI] [PubMed] [Google Scholar]
- Ghisolfi-Nieto L, Joseph G, Puvion-Dutilleul F, Amalric F, Bouvet P. Nucleolin is a sequence-specific RNA-binding protein: characterization of targets on pre-ribosomal RNA. J Mol Biol. 1996;260(1):34–53. doi: 10.1006/jmbi.1996.0380. [DOI] [PubMed] [Google Scholar]
- Giri MS, Nebozhyn M, Showe L, Montaner LJ. Microarray data on gene modulation by HIV-1 in immune cells: 2000–2006. J Leukoc Biol. 2006;80(5):1031–43. doi: 10.1189/jlb.0306157. [DOI] [PubMed] [Google Scholar]
- Haverland NA, Fox HS, Ciborowski P. Quantitative Proteomics by SWATH-MS Reveals Altered Expression of Nucleic Acid Binding and Regulatory Proteins in HIV-1-Infected Macrophages. Journal of Proteome Research. 2014;13(4):2109–19. doi: 10.1021/pr4012602. [DOI] [PMC free article] [PubMed] [Google Scholar]
- He F, Zeng Y, Wu X, Ji Y, He X, Andrus T, Zhu T, Wang T. Endogenous HIV-1 Vpr-mediated apoptosis and proteome alteration of human T-cell leukemia virus-1 transformed C8166 cells. Apoptosis. 2009;14(10):1212–1226. doi: 10.1007/s10495-009-0380-4. [DOI] [PMC free article] [PubMed] [Google Scholar]
- He G, Andersen O, Haugaard SB, Lihn AS, Pedersen SB, Madsbad S, Richelsen B. Plasminogen activator inhibitor type 1 (PAI-1) in plasma and adipose tissue in HIV-associated lipodystrophy syndrome. Implications of adipokines. Eur J Clin Invest. 2005;35(9):583–90. doi: 10.1111/j.1365-2362.2005.01547.x. [DOI] [PubMed] [Google Scholar]
- Heaton JH, Dlakic WM, Dlakic M, Gelehrter TD. Identification and cDNA cloning of a novel RNA-binding protein that interacts with the cyclic nucleotide-responsive sequence in the Type-1 plasminogen activator inhibitor mRNA. J Biol Chem. 2001;276(5):3341–7. doi: 10.1074/jbc.M006538200. [DOI] [PubMed] [Google Scholar]
- Inder KL, Lau C, Loo D, Chaudhary N, Goodall A, Martin S, Jones A, van der Hoeven D, Parton RG, Hill MM, Hancock JF. Nucleophosmin and nucleolin regulate K-Ras plasma membrane interactions and MAPK signal transduction. The Journal of biological chemistry. 2009;284(41):28410–9. doi: 10.1074/jbc.M109.001537. [DOI] [PMC free article] [PubMed] [Google Scholar]
- Jager S, Cimermancic P, Gulbahce N, Johnson JR, McGovern KE, Clarke SC, Shales M, Mercenne G, Pache L, Li K, Hernandez H, Jang GM, Roth SL, Akiva E, Marlett J, Stephens M, D'Orso I, Fernandes J, Fahey M, Mahon C, O'Donoghue AJ, Todorovic A, Morris JH, Maltby DA, Alber T, Cagney G, Bushman FD, Young JA, Chanda SK, Sundquist WI, Kortemme T, Hernandez RD, Craik CS, Burlingame A, Sali A, Frankel AD, Krogan NJ. Global landscape of HIV-human protein complexes. Nature. 2011;481(7381):365–70. doi: 10.1038/nature10719. [DOI] [PMC free article] [PubMed] [Google Scholar]
- Jarboui MA, Bidoia C, Woods E, Roe B, Wynne K, Elia G, Hall WW, Gautier VW. Nucleolar protein trafficking in response to HIV-1 Tat: rewiring the nucleolus. PLoS One. 2012;7(11):e48702. doi: 10.1371/journal.pone.0048702. [DOI] [PMC free article] [PubMed] [Google Scholar]
- Konig R, Zhou Y, Elleder D, Diamond TL, Bonamy GM, Irelan JT, Chiang CY, Tu BP, De Jesus PD, Lilley CE, Seidel S, Opaluch AM, Caldwell JS, Weitzman MD, Kuhen KL, Bandyopadhyay S, Ideker T, Orth AP, Miraglia LJ, Bushman FD, Young JA, Chanda SK. Global analysis of host-pathogen interactions that regulate early-stage HIV-1 replication. Cell. 2008;135(1):49–60. doi: 10.1016/j.cell.2008.07.032. [DOI] [PMC free article] [PubMed] [Google Scholar]
- Kraft-Terry S, Gerena Y, Wojna V, Plaud-Valentin M, Rodriguez Y, Ciborowski P, Mayo R, Skolasky R, Gendelman HE, Melendez LM. Proteomic analyses of monocytes obtained from Hispanic women with HIV-associated dementia show depressed antioxidants. Proteomics Clin Appl. 2010;4(8–9):706–14. doi: 10.1002/prca.201000010. [DOI] [PMC free article] [PubMed] [Google Scholar]
- Larrieu D, Britton S, Demir M, Rodriguez R, Jackson SP. Chemical Inhibition of NAT10 Corrects Defects of Laminopathic Cells. Science. 2014;344(6183):527–532. doi: 10.1126/science.1252651. [DOI] [PMC free article] [PubMed] [Google Scholar]
- Lee YJ, Wei HM, Chen LY, Li C. Localization of SERBP1 in stress granules and nucleoli. The FEBS journal. 2014;281(1):352–64. doi: 10.1111/febs.12606. [DOI] [PubMed] [Google Scholar]
- Lemos TA, Passos DO, Nery FC, Kobarg J. Characterization of a new family of proteins that interact with the C-terminal region of the chromatin-remodeling factor CHD-3. FEBS Lett. 2003;533(1–3):14–20. doi: 10.1016/s0014-5793(02)03737-7. [DOI] [PubMed] [Google Scholar]
- Li H, Wang B, Yang A, Lu R, Wang W, Zhou Y, Shi G, Kwon SW, Zhao Y, Jin Y. Ly-1 antibody reactive clone is an important nucleolar protein for control of self-renewal and differentiation in embryonic stem cells. Stem Cells. 2009;27(6):1244–54. doi: 10.1002/stem.55. [DOI] [PubMed] [Google Scholar]
- Lingappa JR, Petrovski S, Kahle E, Fellay J, Shianna K, McElrath MJ, Thomas KK, Baeten JM, Celum C, Wald A, de Bruyn G, Mullins JI, Nakku-Joloba E, Farquhar C, Essex M, Donnell D, Kiarie J, Haynes B, Goldstein D for the Partners in Prevention HSVHIVTST. Genomewide Association Study for Determinants of HIV-1 Acquisition and Viral Set Point in HIV-1 Serodiscordant Couples with Quantified Virus Exposure. PLoS One. 2011;6(12):e28632. doi: 10.1371/journal.pone.0028632. [DOI] [PMC free article] [PubMed] [Google Scholar]
- Liu HT, Yung BY. In vivo interaction of nucleophosmin/B23 and protein C23 during cell cycle progression in HeLa cells. Cancer letters. 1999;144(1):45–54. doi: 10.1016/s0304-3835(99)00184-6. [DOI] [PubMed] [Google Scholar]
- Liu L, Oliveira NM, Cheney KM, Pade C, Dreja H, Bergin AM, Borgdorff V, Beach DH, Bishop CL, Dittmar MT, McKnight A. A whole genome screen for HIV restriction factors. Retrovirology. 2011;8:94. doi: 10.1186/1742-4690-8-94. [DOI] [PMC free article] [PubMed] [Google Scholar]
- Luban J, Bossolt KL, Franke EK, Kalpana GV, Goff SP. Human immunodeficiency virus type 1 Gag protein binds to cyclophilins A and B. Cell. 1993;73(6):1067–78. doi: 10.1016/0092-8674(93)90637-6. [DOI] [PubMed] [Google Scholar]
- Lv J, Liu H, Wang Q, Tang Z, Hou L, Zhang B. Molecular cloning of a novel human gene encoding histone acetyltransferase-like protein involved in transcriptional activation of hTERT. Biochemical and biophysical research communications. 2003;311(2):506–13. doi: 10.1016/j.bbrc.2003.09.235. [DOI] [PubMed] [Google Scholar]
- Molina L, Grimaldi M, Robert-Hebmann V, Espert L, Varbanov M, Devaux C, Granier C, Biard-Piechaczyk M. Proteomic analysis of the cellular responses induced in uninfected immune cells by cell-expressed X4 HIV-1 envelope. Proteomics. 2007;7(17):3116–3130. doi: 10.1002/pmic.200700306. [DOI] [PubMed] [Google Scholar]
- Monette A, Pante N, Mouland AJ. HIV-1 remodels the nuclear pore complex. The Journal of cell biology. 2011;193(4):619–31. doi: 10.1083/jcb.201008064. [DOI] [PMC free article] [PubMed] [Google Scholar]
- Mukerji J, Olivieri KC, Misra V, Agopian KA, Gabuzda D. Proteomic analysis of HIV-1 Nef cellular binding partners reveals a role for exocyst complex proteins in mediating enhancement of intercellular nanotube formation. Retrovirology. 2012;9:33. doi: 10.1186/1742-4690-9-33. [DOI] [PMC free article] [PubMed] [Google Scholar]
- Naji S, Ambrus G, Cimermancic P, Reyes JR, Johnson JR, Filbrandt R, Huber MD, Vesely P, Krogan NJ, Yates JR, 3rd, Saphire AC, Gerace L. Host cell interactome of HIV-1 Rev includes RNA helicases involved in multiple facets of virus production. Molecular & cellular proteomics : MCP. 2012;11(4):M111 015313. doi: 10.1074/mcp.M111.015313. [DOI] [PMC free article] [PubMed] [Google Scholar]
- Nisole S, Krust B, Hovanessian AG. Anchorage of HIV on permissive cells leads to coaggregation of viral particles with surface nucleolin at membrane raft microdomains. Exp Cell Res. 2002;276(2):155–73. doi: 10.1006/excr.2002.5522. [DOI] [PubMed] [Google Scholar]
- O'Doherty U, Swiggard WJ, Malim MH. Human immunodeficiency virus type 1 spinoculation enhances infection through virus binding. J Virol. 2000;74(21):10074–80. doi: 10.1128/jvi.74.21.10074-10080.2000. [DOI] [PMC free article] [PubMed] [Google Scholar]
- Obata Y, Yamamoto K, Miyazaki M, Shimotohno K, Kohno S, Matsuyama T. Role of cyclophilin B in activation of interferon regulatory factor-3. J Biol Chem. 2005;280(18):18355–60. doi: 10.1074/jbc.M501684200. [DOI] [PubMed] [Google Scholar]
- Ori A, Andres-Pons A, Beck M. The use of targeted proteomics to determine the stoichiometry of large macromolecular assemblies. Methods in cell biology. 2014;122:117–46. doi: 10.1016/B978-0-12-417160-2.00006-0. [DOI] [PubMed] [Google Scholar]
- Otake Y, Soundararajan S, Sengupta TK, Kio EA, Smith JC, Pineda-Roman M, Stuart RK, Spicer EK, Fernandes DJ. Overexpression of nucleolin in chronic lymphocytic leukemia cells induces stabilization of bcl2 mRNA. Blood. 2007;109(7):3069–75. doi: 10.1182/blood-2006-08-043257. [DOI] [PMC free article] [PubMed] [Google Scholar]
- Penman S, Smith I, Holtzman E. Ribosomal RNA synthesis and processing in a particulate site in the HeLa cell nucleus. Science. 1966;154(3750):786–9. doi: 10.1126/science.154.3750.786. [DOI] [PubMed] [Google Scholar]
- Perry RP. THE CELLULAR SITES OF SYNTHESIS OF RIBOSOMAL AND 4S RNA. Proceedings of the National Academy of Sciences. 1962;48(12):2179–2186. doi: 10.1073/pnas.48.12.2179. [DOI] [PMC free article] [PubMed] [Google Scholar]
- Petrovski S, Fellay J, Shianna KV, Carpenetti N, Kumwenda J, Kamanga G, Kamwendo DD, Letvin NL, McMichael AJ, Haynes BF, Cohen MS, Goldstein DB. Common human genetic variants and HIV-1 susceptibility: a genome-wide survey in a homogeneous African population. AIDS. 2011;25(4):513–8. doi: 10.1097/QAD.0b013e328343817b. [DOI] [PMC free article] [PubMed] [Google Scholar]
- Raghavendra NK, Shkriabai N, Graham R, Hess S, Kvaratskhelia M, Wu L. Identification of host proteins associated with HIV-1 preintegration complexes isolated from infected CD4+ cells. Retrovirology. 2010;7:66. doi: 10.1186/1742-4690-7-66. [DOI] [PMC free article] [PubMed] [Google Scholar]
- Ringrose JH, Jeeninga RE, Berkhout B, Speijer D. Proteomic studies reveal coordinated changes in T-cell expression patterns upon infection with human immunodeficiency virus type 1. J Virol. 2008;82(9):4320–30. doi: 10.1128/JVI.01819-07. [DOI] [PMC free article] [PubMed] [Google Scholar]
- Roesch F, Meziane O, Kula A, Nisole S, Porrot F, Anderson I, Mammano F, Fassati A, Marcello A, Benkirane M, Schwartz O. Hyperthermia stimulates HIV-1 replication. PLoS pathogens. 2012;8(7):e1002792. doi: 10.1371/journal.ppat.1002792. [DOI] [PMC free article] [PubMed] [Google Scholar]
- Rycyzyn MA, Reilly SC, O'Malley K, Clevenger CV. Role of cyclophilin B in prolactin signal transduction and nuclear retrotranslocation. Mol Endocrinol. 2000;14(8):1175–86. doi: 10.1210/mend.14.8.0508. [DOI] [PubMed] [Google Scholar]
- Salahuddin SZ, Markham PD, Wong-Staal F, Franchini G, Kalyanaraman VS, Gallo RC. Restricted expression of human T-cell leukemia--lymphoma virus (HTLV) in transformed human umbilical cord blood lymphocytes. Virology. 1983;129(1):51–64. doi: 10.1016/0042-6822(83)90395-1. [DOI] [PubMed] [Google Scholar]
- Santos S, Obukhov Y, Nekhai S, Bukrinsky M, Iordanskiy S. Virus-producing cells determine the host protein profiles of HIV-1 virion cores. Retrovirology. 2012;9(1):65. doi: 10.1186/1742-4690-9-65. [DOI] [PMC free article] [PubMed] [Google Scholar]
- Saphire AC, Gallay PA, Bark SJ. Proteomic analysis of human immunodeficiency virus using liquid chromatography/tandem mass spectrometry effectively distinguishes specific incorporated host proteins. J Proteome Res. 2006;5(3):530–8. doi: 10.1021/pr050276b. [DOI] [PubMed] [Google Scholar]
- Schweitzer CJ, Jagadish T, Haverland N, Ciborowski P, Belshan M. Proteomic analysis of early HIV-1 nucleoprotein complexes. Journal of Proteome Research. 2013;12(2):559–72. doi: 10.1021/pr300869h. [DOI] [PMC free article] [PubMed] [Google Scholar]
- Schweitzer CJ, Matthews JM, Madson CJ, Donnellan MR, Cerny RL, Belshan M. Knockdown of the Cellular Protein LRPPRC Attenuates HIV-1 Infection. PLoS One. 2012;7(7):e40537. doi: 10.1371/journal.pone.0040537. [DOI] [PMC free article] [PubMed] [Google Scholar]
- Shen Q, Zheng X, McNutt MA, Guang L, Sun Y, Wang J, Gong Y, Hou L, Zhang B. NAT10, a nucleolar protein, localizes to the midbody and regulates cytokinesis and acetylation of microtubules. Experimental cell research. 2009;315(10):1653–67. doi: 10.1016/j.yexcr.2009.03.007. [DOI] [PubMed] [Google Scholar]
- Sheng WY, Wang TC. Proteomic analysis of the differential protein expression reveals nuclear GAPDH in activated T lymphocytes. PLoS One. 2009;4(7):e6322. doi: 10.1371/journal.pone.0006322. [DOI] [PMC free article] [PubMed] [Google Scholar]
- Shevchenko A, Loboda A, Ens W, Schraven B, Standing KG. Archived polyacrylamide gels as a resource for proteome characterization by mass spectrometry. Electrophoresis. 2001;22(6):1194–203. doi: 10.1002/1522-2683()22:6<1194::AID-ELPS1194>3.0.CO;2-A. [DOI] [PubMed] [Google Scholar]
- Smoot ME, Ono K, Ruscheinski J, Wang PL, Ideker T. Cytoscape 2.8: new features for data integration and network visualization. Bioinformatics. 2011;27(3):431–2. doi: 10.1093/bioinformatics/btq675. [DOI] [PMC free article] [PubMed] [Google Scholar]
- Stevenson SE, Chu Y, Ozias-Akins P, Thelen JJ. Validation of gel-free, label-free quantitative proteomics approaches: applications for seed allergen profiling. Journal of proteomics. 2009;72(3):555–66. doi: 10.1016/j.jprot.2008.11.005. [DOI] [PubMed] [Google Scholar]
- Su L, Hershberger RJ, Weissman IL. LYAR, a novel nucleolar protein with zinc finger DNA-binding motifs, is involved in cell growth regulation. Genes Dev. 1993;7(5):735–48. doi: 10.1101/gad.7.5.735. [DOI] [PubMed] [Google Scholar]
- Swartling FJ, Grimmer MR, Hackett CS, Northcott PA, Fan QW, Goldenberg DD, Lau J, Masic S, Nguyen K, Yakovenko S, Zhe XN, Gilmer HC, Collins R, Nagaoka M, Phillips JJ, Jenkins RB, Tihan T, Vandenberg SR, James CD, Tanaka K, Taylor MD, Weiss WA, Chesler L. Pleiotropic role for MYCN in medulloblastoma. Genes Dev. 2010;24(10):1059–72. doi: 10.1101/gad.1907510. [DOI] [PMC free article] [PubMed] [Google Scholar]
- Tu C, Li J, Sheng Q, Zhang M, Qu J. Systematic assessment of survey scan and MS2-based abundance strategies for label-free quantitative proteomics using high-resolution MS data. Journal of Proteome Research. 2014;13(4):2069–79. doi: 10.1021/pr401206m. [DOI] [PMC free article] [PubMed] [Google Scholar]
- Ueno T, Tokunaga K, Sawa H, Maeda M, Chiba J, Kojima A, Hasegawa H, Shoya Y, Sata T, Kurata T, Takahashi H. Nucleolin and the packaging signal, psi, promote the budding of human immunodeficiency virus type-1 (HIV-1) Microbiol Immunol. 2004;48(2):111–8. doi: 10.1111/j.1348-0421.2004.tb03496.x. [DOI] [PubMed] [Google Scholar]
- Warren K, Wei T, Li D, Qin F, Warrilow D, Lin MH, Sivakumaran H, Apolloni A, Abbott CM, Jones A, Anderson JL, Harrich D. Eukaryotic elongation factor 1 complex subunits are critical HIV-1 reverse transcription cofactors. Proceedings of the National Academy of Sciences. 2012;109(24):9587–9592. doi: 10.1073/pnas.1204673109. [DOI] [PMC free article] [PubMed] [Google Scholar]
- Weiss A, Wiskocil RL, Stobo JD. The role of T3 surface molecules in the activation of human T cells: a two-stimulus requirement for IL 2 production reflects events occurring at a pre-translational level. Journal of immunology. 1984;133(1):123–8. [PubMed] [Google Scholar]
- Wu-Baer F, Lane WS, Gaynor RB. Identification of a Group of Cellular Cofactors That Stimulate the Binding of RNA Polymerase II and TRP-185 to Human Immunodeficiency Virus 1 TAR RNA. Journal of Biological Chemistry. 1996;271(8):4201–4208. doi: 10.1074/jbc.271.8.4201. [DOI] [PubMed] [Google Scholar]
- Yurchenko V, O'Connor M, Dai WW, Guo H, Toole B, Sherry B, Bukrinsky M. CD147 is a signaling receptor for cyclophilin B. Biochem Biophys Res Commun. 2001;288(4):786–8. doi: 10.1006/bbrc.2001.5847. [DOI] [PubMed] [Google Scholar]
- Zhou H, Xu M, Huang Q, Gates AT, Zhang XD, Castle JC, Stec E, Ferrer M, Strulovici B, Hazuda DJ, Espeseth AS. Genome-scale RNAi screen for host factors required for HIV replication. Cell Host Microbe. 2008;4(5):495–504. doi: 10.1016/j.chom.2008.10.004. [DOI] [PubMed] [Google Scholar]
Associated Data
This section collects any data citations, data availability statements, or supplementary materials included in this article.