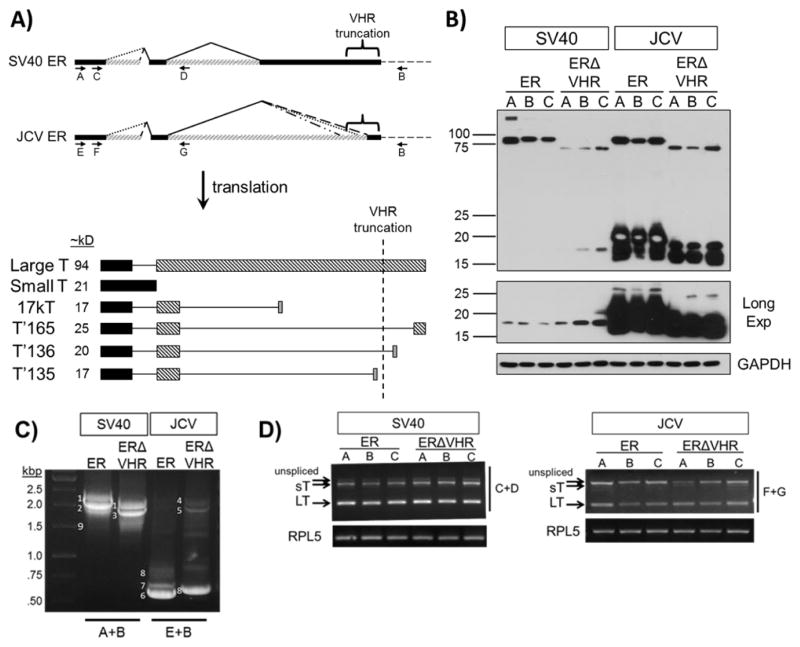
Figure 2. Expression of T antigens from full length or VHR-truncated SV40 and JCV early region in MEFs.
A) Transcripts and proteins encoded by the SV40 and JCV viral early region (ER). Both the SV40 and JCV ER produce multiple T antigen transcripts by alternative splicing (top panel). Translation of these transcripts results in a large T (LT), small T (sT), and one or more smaller T proteins (lower panel). Bars of the same color or pattern represent an expressed region of the protein within the same reading frame, while continuous lines represent regions that are removed due to alternative splicing of the early region pre-mRNA. Approximate sizes of the different T antigen proteins are listed. Removal of the VHR region in JCV prevents the expression of T′165 and T′136. Both SV40 and JCV VHR truncations produce a smaller LT protein. B) T antigen protein expression in MEFs from full length or VHR-truncated SV40 and JCV ER. Three individual pools are shown (labeled A, B, and C) for each construct. Equivalent amounts of whole cell lysates were separated by SDS-PAGE, transferred to PVDF, and blotted for T antigens with a mixture of SV40 (416, 419) and JCV specific antibodies (962, 2003). GAPDH, loading control. C) T antigen transcripts amplified by RT-PCR using primers that surround the entire open reading frame (A and B or E and B, indicated by arrows in panel A). Each band corresponds to a different T antigen transcript: 1) SV40 sT, 2) SV40 LT, 3) SV40 LT ΔVHR, 4) JCV sT, 5) JCV LT ΔVHR, 6) JCV T′165, 7) JCV T′136, 8) JCV T′135 9) SV40 17kT. D) RT-PCR specific for LT and sT transcripts (using primers C and D or F and G, indicated by the arrows in panel A). Rpl5 transcript levels were tested to verify that equal amounts of total cDNA were used for each sample.

