

Abstract
Dysfunctional stem cell differentiation into placental lineages is associated with gestational diseases. Of the differentiated lineages available to trophoblast stem cells (TSC), elevated O2 and mitochondrial function are necessary to placental lineages at the maternal-placental surface and important in the etiology of preeclampsia. TSC lineage imbalance leads to embryonic failure during uterine implantation. Stress at implantation exacerbates stem cell depletion by decreasing proliferation and increasing differentiation. Implantation site O2 is normally ~2%. In culture, exposure to 2% O2 and fibroblast growth factor (FGF)4 enabled highest mouse TSC multipotency and proliferation. In contrast, hypoxic stress (0.5% O2) initiated the most TSC differentiation after 24 hr despite FGF4. However, hypoxic stress supported differentiation poorly after 4–7 days, despite FGF4 removal. At all tested O2 levels, FGF4 maintained Warburg metabolism; mitochondrial inactivity and aerobic glycolysis. However, hypoxic stress suppressed mitochondrial membrane potential, maintained low mitochondrial cytochrome c oxidase (oxidative phosphorylation/OxPhos), and high pyruvate kinase M2 (glycolysis) despite FGF4 removal. Inhibiting OxPhos inhibited differentiation at the differentiation optimum at 20% O2. Moreover, adding differentiation-inducing hyperosmolar stress failed to induce differentiation during hypoxia. Thus, differentiation depended on OxPhos at 20% O2; hypoxic and hyperosmolar stresses did not induce differentiation at 0.5% O2. Hypoxia-limited differentiation and mitochondrial inhibition and activation suggest that differentiation into two lineages of the labyrinthine placenta requires O2>0.5–2% and mitochondrial function. Stress-activated protein kinase increases an early lineage and suppresses later lineages in proportion to the deviation from optimal O2 for multipotency, thus it is the first enzyme reported to prioritize differentiation.
Keywords: trophoblast stem cells; hypoxia; SAPK (aka, JNK); mitochondria; multipotency; differentiation; terminal differentiation markers
Introduction
As an embryo implants into the uterus, stress can diminish placental trophoblast stem cell (TSC) proliferation inducing differentiation to create more essential differentiated product/fewer cells1–3. This “compensatory” differentiation thus further depletes the size of the population of multipotent TSC. Multipotency is the stemness program mediated by transcription factors that oppose expression of genes mediating lineage allocation or terminal parenchymal function. Most human embryos are lost before birth and the greatest decrease occurs soon after implantation4. Understanding the cellular and molecular mechanisms of TSC stress responses will inform strategies to ameliorate their consequences during implantation.
Implantation site O2 is normally ~2%, which is optimal for many stem cell types, but the placenta adapts to hypoxic stress at <2% O2. The pre-implantation uterine lumen and implantation site itself tend toward low O2 levels. Assays for three mammals, rhesus monkey, golden hamsters and rabbits showed that O2 at the time of implantation were ~1.5–2%, 5.3% and 3.5% respectively 5. The intrauterine O2 for humans, during the entire menstrual cycle was relatively constant at ~2% 6. In two studies rat intrauterine O2 was about 4%7, 8. Modeling O2 consumption in the preimplantation blastocyst with experimentally determined O2 usage suggests that the inner cell mass of the implanting blastocyst is hypoxic when the external trophectoderm epithelium only one layer thick is exposed to 5% O2 9 and this is supported by differential O2 usage by the inner cells 10, 11. This suggests that after implantation as the proliferative TSCs are removed by just a few layers of overlying cells in the shell of trophoblasts in contact with maternal blood, and then their O2 exposure will be less. Burton and colleagues point out the function of the first trimester human placenta is to reduce O2 levels behind the trophoblast plug that blocks maternal blood vessels that will supply the maternal-fetal interface after the plug dissolves at the start of the second trimester 12, 13. Enders and colleagues showed that in the first 6 days after implantation in baboons, the first trophoblast invasion of blastocyst-dependent permeabilized vasculature may also begin to impede blood flow during the earliest post-implantation, lacunar stage 14, 15. Thus the trophoblast mediated decrease in O2 delivery to the placental interface is likely to begin at implantation and subsurface stem cells will be exposed to still lower O2 levels than overlying cells at the interface. From the beginning of placental interaction with the endometrium the placental surface, and underlying stem cells, are at low O2 levels under normal conditions and these favor stem cell growth16, 17. But elevated O2 and mitochondrial function is required as stem cells at the maternal-fetal interface of the placenta differentiate. At this point continuing hypoxia below the normal low optimum may drive compensatory differentiation that is imbalanced and not conducive to the production of later placental lineages and function. There are many etiologies of preeclampsia, with lack of invasion of the spiral artery trophoblast and subsequent failure to produce a low resistance blood flow to the placental surface a primary cause18–21. However failure to vascularize the villous placenta in human or labyrinthine placenta in mouse, or to produce a fully function surface epithelium may also lead to disease22, 23.
Previous in vitro characterization of compensatory TSC differentiation was performed at 20% O2 with a dose of benzopyrene or hyperosmolar stress that activated maximal stress enzyme3, 24. When O2 levels are optimized, highest growth and least stress (activation of stress-activated protein kinase/SAPK) is at 2% O217. Although stress at 20% is greater than at 2% O2, only O2<2% activates high levels of SAPK that are comparable to other stresses at 20% O2, describing a U-shaped curve for stress that is proportional to levels of SAPK and inversely proportional to growth. SAPK mediates adaptive responses of cultured mouse TSCs and embryos to all stressors tested to date, but double knockouts of the two ubiquitously expressed SAPK genes (aka mitogen-activated protein kinase – MAPK8/9) have no early developmental defects. Thus SAPK appears to become important during responses to elevated stress but is not essential to normal development or stress that arises normally1, 16, 25.
Hypoxic stress for stem cells at 0.5% O2 combined with FGF4 is maximal for priming TSC for differentiation by producing the lowest levels of three nuclear multipotency factors (Inhibitor of differentiation (Id)2 Caudal related homeobox Cdx(2), Estrogen receptor related, (Err)beta). A nuclear multipotency factor is characterized by normal expression unique to stem cells, characterized DNA binding (or inhibition of nuclear binding for Id2) or nuclear location, and by loss of function leading to premature differentiation, typically with fewer cells and favoring one lineage over another, and/or transgenic constitutive expression preventing differentiation19, 26–31
The next class of factors provide information on lineage allocation and restricted potency and for this we used two nuclear factors (heart and neural differentiation Hand(1) necessary for of non-chorionic giant cells32 and glial cells missing Gcm(1) of chorionic syncytiotrophoblasts33, and a non-nuclear factor trophoblast specific binding protein Tpbp(a) that marks stem cells of the ectoplacental cone and spongiotrophoblasts34.
The third class of markers provides evidence that terminal differentiation has occurred and lineages that are derived from mTSCs are producing parenchymal functions that arise only after implantation. These five markers are cathepsin Q (Ctsq), Placental lactogens 1 and (PL1 and PL2), syncytin A (SynA), and proliferin (Plf)34–37.
Fibroblast growth factor (FGF)4 is synthesized in the implanting embryo1 and is necessary for maintaining TSC proliferation and multipotency in culture38 and in the embryo39. To better emulate preimplantation stress effects, TSC culture was performed here for 24 hr in the presence of FGF4. Our previous studies used this paradigm since the ESC and TSC lineages arise at E3.5 and the embryo implants 24 hr later at E4.51, 25. However, there are fields of TSCs in the postimplantation embryo within 10 cell diameters of the FGF4 source40, so the TSCs cultured in the presence of FGF4 would also model this population. With increasing developmental time after implantation, greater numbers of cells will be pushed by population pressure away from FGF4 sources. To study the longer period of postimplantation development as cells move away from the FGF4 source, culture was extended to 7 days with FGF4 removed to stimulate normal differentiation.
During normal postimplantation placental development, the first lineage differentiating from TSC is parietal trophoblast giant cells (pTGC) at E4.5 (4.5 days after fertilization), followed by spongiotrophoblasts at E7.0 and labyrinthine, chorionic syncytiotrophoblasts (synT) and sinusoidal TGC (sTGC) at E7.534, 36 (supplemental table, S1). SAPK is needed to mediate stress-induced suppression of placental cell cycle and TSC differentiation to the earliest lineage, pTGC, in placental cells41,2. We have proposed that stress “prioritizes” differentiation as hyperosmolar stress induces TSCs to differentiate into the earliest postimplantation lineage/marker (e.g., pTGC/Hand1) but not later lineages/markers (e.g., synTA/Gcm1)1. Prioritization was evident from global studies of the transcriptional response of TSCs to hyperosmolar sorbitol where early, but not later, postimplantation markers were induced42. It is also apparent that hyperosmolar stress induces the essential first differentiated lineage in mouse ESCs and suppresses two later lineages43.
Because SAPK mediates hyperosmolar stress-induced Hand1 and Hand1-dependent PL12, we tested whether stress-induced lineage choice during hypoxia was SAPK-dependent. Since hyperosmolar stress induces the first lineage but not later lineages from TSC42, and SAPK mediates the induction of first lineage markers2, we hypothesize that SAPK will mediate induction of the first lineage/marker (pTGC/Hand1) and suppression of later lineage/marker (synTA/Gcm1) induced by hypoxic stress.
Here we test for the effects on multipotency and lineage differentiation in cultured TSC of FGF4 removal during TSC culture with O2 levels at 20, 2, 0.5, and 0%. We found that FGF4 maintains Warburg metabolism (suppression of mitochondrial electron transport chain and activation of aerobic glycolysis) at all O2 levels. During hypoxic stress at 0.5% O2 with FGF4 removed, TSC differentiation was induced at days 1–2 that were insufficient to support increased mitochondrial activity or suppress aerobic glycolysis at days 4–7. This led to a rapid but incomplete differentiation and lineage imbalance as two lineages at the maternal interface of the later-developing chorionic placenta are largely suppressed at all O2 levels <20%. Imbalanced TSC differentiation early in pregnancy is one predicted etiology of preeclampsia in humans44–47. An understanding of how hypoxic stress causes lineage imbalance early during mTSC differentiation in a mouse model should produce an understanding of the types of adaptive responses can also lead to maladaptive pathologies. Mouse models associated with spontaneous miscarriage48, 49, preeclampsia50, 51, intrauterine growth retardation52, and preterm labor have been produced and 80% of genes causing placental phenotypes in mouse are expressed in human placentation53. Thus the understanding of response of mTSCs induced by hypoxia <2% O2 should provide insight into early placental pathology in humans.
Materials and Methods
Materials
Reagents for maintaining TSC, delivering [O2]s and for SAPK and actin antibodies and SAPK inhibitors were described previously2, 17 and are detailed in the Supplement. The primary antibodies for pyruvate kinase embryonic form (PKM)2 (CS3198), PKM2 Tyr105 (CS3827) were from Cell signaling (Danvers MA), and pyruvate kinase adult form (PKM)1 antibody (AP7476b) was purchased from Abgent (San Diego, CA). Cyto-oxygenase (COX) subunit I antibody (MS404) was purchased from MitoSciences (Eugene, OR). The mitochondrial membrane potential (ΔΨm) stains tetramethylrhodamine methyl ester (TMRM), MitoTracker red, and 5,5′,6,6′-tetrachloro-1,1′,3,3′-Tetra-ethylbenzimidazolylcarbo-cyanine iodide (JC1) were purchased from Molecular probes (Grand Island, NY). Mitochondrial inhibitors antimycin A and cyanide, the mitochondrial activator dichloroacetate (DCA), and the OxPhos uncoupler Carbonyl cyanide 4-(trifluoromethoxy) phenylhydrazone (FCCP) were purchased from Sigma (St. Louis, MO).
Cell lines and culture conditions
The mouse TSC sources and culture conditions were described previously2, 17 and in detail in Supplement. Since the stem cells of the peri-implantation embryo grow rapidly and are in log phase growth, we pass stem cells at a dilution so that approximately 24 hr after passage and recovery from passage stress, the cells are in the range of 20–30% confluent and are in log phase growth at Tzero. We also use pre-equilibrated media so that the exposure to new target O2 is instantaneous. More highly stressed TSCs will not grow well after Tzero and need to be plated for biochemical assays in as many as 4–5 times the number of plates compared with TSCs cultured at 20% O2 that grow to 100% confluence by Tfinal.
RNA isolation and quantitative reverse transcription-PCR (qRT-PCR)
All steps in RNA isolation, cDNA synthesis and qPCR performance and analysis were described previously17 and are detailed in the Supplement. Relative mRNA expression levels, compared to stress resistant 18S rRNA42, were determined by the ΔΔCT method. Fold change in normalized expression of individual genes in experimental samples was determined by comparison to expression in cells cultured at 20% O2. Primers used are shown in Supplemental Table 2. All primer pairs were confirmed for specificity using BLAST analysis and by both agarose gel electrophoresis and thermal dissociation curves to ensure amplification of a single product.
Mitochondrial staining by MitoTracker dye
TSC were cultured at different O2 levels at least 24 h stained with DAPI (D21490, Invitrogen) alone or with either MitoTracker Red FM (Invitrogen), TMRM (T668), or JC-1 (T3168, Invitrogen) alone or with the uncoupler FCCP (Sigma), and analyzed under a DM-IRE2 fluorescence microscope (Leica, Germany) using Simple PCI image acquisition software (Hamamatsu, Sewickley, PA). Details are in the Supplement
Western analysis
TSC were lysed, protein assayed, separated by PAGE-SDS, immunoblotted and films exposed and analyzed as done previously17. Details are in the Supplement.
ATP measurements
TSC were washed, collected, centrifuged, frozen on dry ice, and stored. Cell pellets were boiled, lysed, iced, and solubilized by ultrasonication. [ATP]s were determined using the ATP bioluminescence assay kit HS II (Roche Applied Science) by the manufacturer’s protocol. Data were standardized to the protein concentration. Details are in the Supplement
ROS measurements at 20% O2
TSC were trypsinized, centrifuged, washed, and incubated with the ROS-sensitive probe 2′,7′-dichlorodihydrofluorescein diacetate (Molecular Probes), and analyzed on an Ascent Fluoroskan plate reader. Experiments were performed in triplicated and data standardized to cell number. As a control, cells were incubated in the presence of 100 μM H2O2. Details are in the Supplement
Statistical analysis
The data in this study are representative of three independent experiments and indicated as mean ± s.e.m. Data were analyzed with SPSS v. 19.0 using the Kruskal-Wallis non-parametric ANOVA for not normally distributed values, and if significant, the pairs of treatments were tested using the Mann-Whitney U-test with a Bonferroni correction for multiple comparisons. Groups were considered to be significantly different if p<0.05.
Results
SAPK increases the first lineage and decreases later lineages proportional to the deviation from the optimal O2 at 2%
Two SAPK inhibitors with different mechanisms, SP600125 and LJNKl1, were used to limit possible off-target effects. Both SAPK inhibitors prompted a 3–7-fold increase in the later chorionic lineage (Gcm1), with the highest inhibition occurring at 0.5% and 20% O2 (Figs. 1A and S4). Both SAPK inhibitors also increased later spongiotrophoblast lineage (Tpbpa) at all O2 levels. In contrast, both inhibitors suppressed early lineage pTGC (Hand1) mRNA (Figs. 1A and S4) with suppression being highest at 0.5% and 20% O2. Furthermore, both SAPK inhibitors suppressed later lineages (Tpbpa and Gcm1) and increased the earliest lineage (Hand1, Fig. 1B and Fig. S3, S4). Methods of analysis and normalization to control 18S rRNA are discussed in Methods. The smallest effects on Hand1, Tpbpa, and Gcm1 occurred at 2% O2, but as O2 levels deviated from 2% the mRNA levels are influenced by SAPK level upward for Hand1 and downward for Gcm1 (Fig. 1B).
Fig. 1.

SAPK mediates decreased Gcm1 and Tpbpa and increased Hand1 at all O2 levels. There are greater effects as O2 deviates from the stemness optimum of 2% O2. TSCs were passaged and cultured at 20, 2, or 0.5% O2 overnight. FGF4 was replenished the next day at time zero, and SAPK inhibitor SP600125 (10μm or 50μM) was co-incubated with TSCs for 2 days at the indicated O2 levels ± SP600125. Markers were quantitated using qPCR. (B) is a graph derived from data in (A), where the highest inhibited group was subtracted from the uninhibited group at each O2 level (the subtracted difference is shown as a color inset in the histogram bars of highest expression of each marker). The difference at 2% O2 was set to a baseline of “0” as we previously showed that 2% O2 was the optimal level that produces the least stress (activated SAPK) and highest proliferation17. In (C) Cdx2, Id2, and Errβ decreased at 0.5% O2 in the presence of FGF4, but SAPK inhibitor had no effect at any O2 level.
The mRNA levels for 3 multipotency factors (Cdx2, Id2, and Errβ) were unaffected by 48 hr of O2 at 2–20% but were greatly reduced at 0.5% O2, despite FGF4. Neither SAPK inhibitor affected multipotency factors maintenance at 2–20% O2, or the decrease of the 3 multipotency factors at 0.5% O2 (Fig. 1C). Hence during hypoxic stress, SAPK mediated prioritized differentiation (Fig. S4), but not multipotency decrease.
Decrease of multipotency and increase in differentiation is O2-dependent, and hypoxia suppresses labyrinthine placenta
We first tested whether the most stressful 0.5% O2 level induces most decrease of multipotency factor transcripts and increased differentiation after FGF4 removal. We found that following FGF4 removal, the caudal homeobox related (Cdx2), Inhibitor of Differentiation (Id)2, and estrogen receptor related (Err)β – multipotency-mediating mRNA – were the most rapidly lost by 24 hr at 0–0.5% O2 (Fig. 2A, S1, Table S1). In contrast by day 7 0.5% O2 sustained the highest multipotency factor mRNA levels while the lowest average level of the multipotency factors were observed at 20% O2.
Fig. 2.
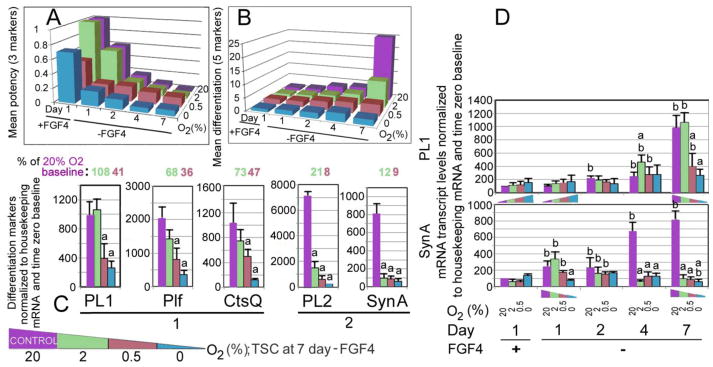
Multipotency factors undergo rapid decrease on day 1 at 0.5% O2 with FGF4 present, but the least decrease after 7 days of FGF4 absence. Terminal differentiation is lowest at 0.5% O2 and highest at 20% O2 after 7 days, and labyrinthine placental lineages are dependent on 20% O2. (A) shows averages of decrease of a mean of three multipotency factors, (B) the increase of a mean of five differentiation factors during seven days of differentiation caused by removal of FGF4 dependent on four O2 levels, and (C) shows the five differentiation factors averaged in (B), but only at highest differentiation at day 7. There are three types of O2-dependence from left to right; (1) Pl1 has no difference between 20 and 2, but decreases at hypoxic 0.5% O2 to 41% O2. (2) Plf and Ctsq marker decrease increased at each O2 level; 2-0.5-0% O2. (3) Two markers, PL2 and SynTa have the greatest O2-dependence, decreasing greatly to 21 and 12% at 2% O2 and 8 and 9% at 0.5% O2, respectively.
TSCs were grown at 20% O2 then switched to 0–20% O2 for 1 day ± FGF4, which was removed after 1 day, and then cells were cultured for 1–7 days. mRNA markers were quantitated using qPCR. (A) shows time on the x axis, O2 levels on the y axis, and average levels of the 3 multipotency factors on the z axis from individual markers in Table S1. (B) shows time-dependent and O2-dependent induction of an average of the 5 terminal differentiation markers from Table S1 and (C). (C) shows mRNA transcripts from 5 terminal differentiation markers after 7 days of TSC culture without FGF4 and with 0–20% O2. (D) shows the oxygen-dependent accumulation of mRNA of a marker of the first lineage (PL1) and a later lineage (synTA). Note that synTA always requires highest O2 but PL1 is induced by hypoxic stress early but requires highest O2 levels at day 7.
We next tested for effects of O2 on one of the most O2-dependent differentiation markers, synTa, and on one of the least O2-dependent markers, PL1, over the seven days of FGF4 removal (Fig. 2D). At 24 h, 2 markers for the first lineage pTGC showed stress-induced differentiation (PL1, Plf, Fig. 2B, C, Fig. S2, Table S1). The induction of PL1 at lowest O2 is itself not significant, but repeated measures ANOVA suggests that the shape of the PL1 induction towards lowest O2 at day 1 is significantly different than the PL1 induction that is highest towards highest O2 at day 7 (p<0.05). First lineage markers PL1 and Plf were 2–3-fold higher at 0–0.5% than at 20% O2 after 24 hr, Two later lineages found at the placental surface, sTGC (PL2+CtsQ) and syncytiotrophoblast A cells (synTA) were not increased (Fig. 2C, Table S1). Markers of first and secondary pTGC, Hand1 and Tpbpa were upregulated in the first 24 hr at O2<2% (Fig. S3). Thus the early response to hypoxic stress <2% O2 is to differentiate to the first, but not later lineages. A marker of first lineage (PL1) was induced by O2<2%, but differentiation did not increase greatly at low O2 and by day 7 PL1 was most highly expressed at 20% O2 (Fig. 2D, Fig. S2). In contrast a marker of a later lineage (synTa) was not disproportionally upregulated by O2<2% and was always most highly expressed at 20% O2.
Through day 4, the average differentiation increased threefold at all O2 levels over day 0. However, by day 7, while 0–0.5% O2 maintained this threefold increase, increases of 10-fold and 25-fold were observed for 2% and 20% O2, respectively. First lineage markers PL1 and Plf were much more highly induced at 2–20% than at <2% O2 but by day 7 all five differentiation markers were highest at 20% O2 (Fig. S2). Thus, after a fast, early increase in differentiation of especially the first lineage, differentiation stalled at hypoxic 0–0.5% O2 but increased greatly at 2–20% O2.
Proliferin [Plf], placental lactogen [PL]1, CtsQ, and synTa had a maximal increase of 7–10 fold, and 1 marker (placental lactogen, [PL]2) had a 70-fold increase by day 7 at 20% O2 (Fig. 2B, C, Table S2). The two placental surface lineages, sTGC and synTA cells appear least supported by O2 at <20%. Markers of these two lineages were suppressed by hypoxic stress at 0.5% O2 to ~10% of levels at 20% O2 (Fig. 2C). The five terminal differentiation markers were of two types; the type 1 markers showed no significant differences in magnitude of expression between 20% and 2% O2 and the type 2 markers were expressed at significantly higher magnitude at 20% O2 compared with than any other O2 level.
Hyperosmolar stress that induces differentiation at 20% O2 cannot induce differentiation at hypoxic 0.5% O2
O2 at 0.5% does not support later differentiation at 4–7 days, but also does not activate as much SAPK as 100mM sorbitol at >20% O217. Thus, we added 100mM sorbitol, which increases SAPK ~5 fold and induces differentiation at 20% O2 despite FGF42, 3, 42, 54. However, the added stress did not increase mRNA expression of any of the 3 terminal differentiation markers (PL1, Plf, and synTa) during hypoxia (Fig. 3A). Thus, 0.5% O2 cannot support differentiation after FGF4 removal or sorbitol addition.
Fig. 3.

(A) TSCs that differentiated without FGF4 for 7 days had the highest ATP levels at 0.5% O2 and the lowest ATP in the rank order 20%<2%<0% compared with baseline stem cells at 20% O2 + FGF4. TSCs were cultured in 0–20% O2 for 0–7 days ± FGF4 as indicated, rapidly frozen, and assayed for free ATP (n=4). (B) At 7 days, FGF4 absence increased terminal differentiation markers 8–20 fold at 20% O2, but lower differentiation levels at 0.5% O2 were not increased by a sorbitol dose, which induces high levels of differentiation at 20% O2. TSCs were cultured for 7 days ± FGF4 at 20% or 0.5% O2 ± 100mM sorbitol. mRNA was purified and reverse transcribed, then analyzed for relative amounts of 3 terminal differentiation markers that were normalized to housekeeping mRNAs. Triplicate experiments are shown, with mean ± s.e.m. (error bars). (a) shows that sorbitol does not significantly increase differentiation markers at 0.5% O2 (C) Mitochondrial membrane charged increased between 2–3 days after FGF4 removal. (D) Correspondingly, at 7 days, mitochondrial ΔΨm increased only at O2≥2% with FGF4 removal. TSCs were cultured for 7 days at 20% O2 (a, d), 2% O2 (b, e), or 0.5% O2 (c, f) with FGF4 (a–c) or without FGF4 (d–f) and stained with JC1. Micron bar in micrograph A indicates 50μM. Green fluorescence indicates monomeric stain and low membrane charge and red fluorescence indicates polymeric stain and high charge.
Multipotent TSCs that differentiated for 2 days after FGF4 removed showed increased mitochondrial membrane potentials (ΔΨm)
We determined the roles of FGF4 and O2 on ΔΨm associated with ATP production. TSCs were incubated for 2 days with or without FGF4 and stained with the ΔΨm-sensitive probes MitoTracker (Fig. S5), JC1, or TMRM in the presence or absence of the ΔΨm uncoupler FCCP (Fig. S6). At 2 or 20% O2, FGF4 maintained mitochondria with low ΔΨm. Some cells had high ΔΨm at epithelial edges despite FGF4. Similar to the MitoTracker stain findings (Fig. S5), both JC1 and TMRM stains showed increased ΔΨm levels only after FGF4 removal (Fig. S6). FCCP completely depolarizes the ΔΨm, showing the specificity of the ΔΨm effects (Fig. S6). Thus, FGF4 maintains mitochondrial inactivity in TSCs at all O2 levels and O2 does not play a role in mitochondrial initiation to full activity.
FGF4 and hypoxia co-regulate low ΔΨm, but ΔΨm does not increase with FGF4 removal during hypoxia after 7 days
We used JC1 stain to assay ΔΨm and to test whether hypoxia limited ΔΨm generation when differentiation was maximal after FGF4 removal for 7 days (as in Fig. 2). There were 4 levels of JC1 stain color and intensity. FCCP produced no fluorescence, indicating complete ΔΨm depolarization (Fig. 3B). TSCs cultured with FGF4 at 0.5% O2 showed a low level of green fluorescence, indicating low ΔΨm, but TSCs cultured at 2% or 20% O2 with FGF4 removed showed two levels of increasing red fluorescence, indicating higher ΔΨm. FGF4 and hypoxia play additive, regulatory roles for ΔΨm but even with FGF4 removed, 0.5% O2 could not sustain high ΔΨm levels.
Hypoxia at O2<0.5% induced morphological changes in mTSCs that produced TGCs despite FGF4
At 0.5% O2, stress significantly increases nuclear size despite FGF4 and nearly all TSCs with small nuclei were lost and all differentiated cells were TGC (Fig. 3B, C). Hypoxic stress-induced giant cells in panel C with FGF4 were the same size as those induced by FGF4 removal at 2% or 0.5% O2 (panels, E, F), but 20% O2 sustained the largest giant cells (micrograph panel D). This finding is similar to hyperosmolar stress at 20% O2, where all cells lost Id2 and expressed the TGC marker PL12, 3. Multinuclear synTA cells and giant cells were visible at 20% O2 with FGF4 removed, but synTA cells were not observed or extremely rare at 0.5% O2. Although hypoxic stress initiates differentiation to TGC morphologically while suppressing syncytiotrophoblasts, terminal differentiation as defined by mRNA markers, does not complete at 7 days (Fig. 2B) and size of TGC is lower at 7 days at 0.5%<20% O2. Thus, FGF4 is most important in suppressing ΔΨm when O2 is ≥2%, but O2≤0.5% limits ΔΨm generation, and differentiation of TSCs, assayed by size or mRNA markers, is limited at 0–0.5% O2.
Cytochrome c oxidase (COX) and pyruvate kinase embryonic form M2 (PKM2) are co-regulated by FGF4 and hypoxia, and their total protein levels do not change during hypoxia despite FGF4 removal
A likely mechanism for decreased differentiation at 0.5% O2 is insufficient mitochondrial OxPhos, which normally consumes >90% of cellular O2. COX is the terminal, proposed rate-limiting enzyme of the electron transport chain (ETC)55, 56. COX, with other ETC complexes, generates the ΔΨm which is required for increased ATP synthesis, but also increased mitochondrial ROS.
To biochemically corroborate our findings regarding ΔΨm inactivity; we assayed the amount of COX protein and its inactive Tyr304-phosphorylated form57, 58. At all O2 levels COX is maintained at highest, phosphorylated (inactivated) state by FGF4 (Fig. 4A), corresponding to low ΔΨm in Fig. 3B, Total COX is low at O2≤2% levels, and highest at 20% O2 when FGF4 is removed (Fig. 4B). Interestingly, if phosphorylated COX were normalized to total COX at 20% O2 when FGF4 is removed a much smaller subpopulation of COX would be phosphorylated, further increasing the COX activity levels Significantly, total COX levels do not increase with FGF4 removal at 0.5% O2.
Fig. 4.

FGF4 maintained COX subunit I and PKM2 in the phosphorylated state at all O2 levels, but total COX and PKM2 levels are regulated by hypoxia and did not change with FGF4 removal. TSCs were cultured for 2 days ± FGF4 at 0–20% O2 and assayed by immunoblot for phosphorylated cytochrome c oxidase (pCOX) using a phospho-specific antibody 58(A), total COX (B), actin b (ACTB) and, pPKM2 (C), PKM1 (D), or PKM2 (E). Histograms show the pCOX, total COX levels, PKM1, PKM2, and pPKM2 normalized to ACTB, with bars showing the average of 3 experiments ± s.e.m.
Highly proliferative stem cells require high anabolic rates that require aerobic glycolysis. Aerobic glycolysis, as is probable when FGF4 is present in (Fig. 3B), is mediated by pyruvate kinase embryonic form PKM2 59, 60. PKM2 mediates the irreversible terminal step of glycolysis. In its Tyr105 form, however, PKM2 does not homotetramerize, which is necessary to bind phospho-enol pyruvate and catalyze pyruvate production59, 60. PKM2 is also a nuclear cofactor for hypoxia inducible factors for genes involved in glycolysis and glucose uptake61. Similar to COX phosphorylation, FGF4 maintained phosphorylation of PKM2 on Tyr105 at all O2 concentrations (compare Fig. 4A and C). However, for PKM2, O2≤2% without FGF4 resulted in the highest protein levels, with less PKM2 protein at O2>2% (Fig. 4E). At 20% O2, PKM2 protein decreased after FGF4 removal. The adult splice variant, PKM1, was higher with 2–20% O2, but there was no coherent pattern of regulation by FGF4 or O2 (Fig. 4D). Despite FGF4 removal, hypoxic O2 at 0.5% O2 maintains high glycolysis by maintaining high PKM2 protein levels.
Mitochondrial antagonists and an agonist show that mitochondrial function is necessary and sufficient to mediate the differentiation of two labyrinthine placental lineages
To test the necessity and sufficiency of mitochondrial function for TSC differentiation, we used 2 mitochondrial inhibitors and an agonist. The mitochondrial activator dichloroacetate (DCA) was tested at 0.5%-20% O2 (Fig. 5A). There were no effects at 0.5% or 20% O2. But at 2% O2, of 5 markers only 2 markers increased ~2 fold with DCA treatment; PL2 and synTa. These are markers of sTGC and synTA cells of the labyrinthine placenta, although PL2 is detected in other cell types. The other 3 markers were equally highly expressed at 20% and 2% O2, suggesting maximal differentiation at 2% O2 that could not be increased (type 1 markers in Fig. 1). Thus, DCA increased the 2 lineages that could be increased at 2% O2 (type 2 markers in Fig. 1). In contrast 0.5% O2 is likely to be insufficient to support increases in differentiation induced by DCA.
Fig. 5.

In TSCs cultured for 7 days at 20% O2, all terminal differentiated lineages were O2 sensitive, but PL2 and CtsQ were most inhibited by the mitochondrial inhibitors cyanide and antimycin A, and PL2 was most highly induced by the mitochondrial activator DCA at 2% O2. (A) TSCs were incubated for 7 days ± FGF4 at 20%, 2%, or 0.5% O2 with the mitochondrial activator DCA. TSCs were cultured for 7 days at 20% O2, ± FGF4, and with mitochondrial inhibitors antimycin A or cyanide (B). The cells were then lysed and assayed by qPCR for the relative levels of 5 terminal differentiation markers PL1, PL2, Plf, CtsQ, and synTa. The experiment was repeated 3 times and bars show the average ± s.e.m., (a) indicates no significant difference and (b) indicates a significant difference (p<0.05) between TSCs with FGF4 removed without or with mitochondrial agonist or antagonist. Where changes in markers are significant (b), the increase or decrease due to mitochondrial agonist or antagonist is shown above the histogram bar.
Cyanide and antimycin A inhibit COX (part of mitochondrial complex IV) and complex III, respectively, and were used to inhibit the ETC and thus the generation of ΔΨm for 7 days of culture at optimal differentiation conditions (Fig. 5B). Sublethal concentrations of inhibitors were used that had significant effects on mitochondria. For all 5 differentiation markers tested, both mitochondrial inhibitors decreased mRNA levels. Markers emphasized (PL2; inhibited 98% and 56%) or specific (Ctsq; inhibited 81% and 71%) for labyrinthine sTGCs were decreased greatly by antimycin and cyanide respectively (Fig. 5B, Table S1). A marker specific for labyrinthine synTA cells (synTa; inhibited 42% and 34%) was inhibited by antimycin and cyanide respectively (Fig. 5B, Table S1). Thus, mitochondrial antagonists block differentiation of 2 lineages of the labyrinthine placenta under conditions mediating maximal differentiation, whereas a mitochondrial agonist increased those lineages at 2% O2.
ATP decreases in an O2-dependent manner as TSCs differentiate from day 4–7, but highest ATP accumulation occurs where hypoxic differentiation from day 4–7 is lowest
To understand energy use during O2-dependent differentiation, TSCs were cultured for 1–7 days without FGF4, and ATP levels were determined on days 1, 2, 4, and 7, the same as those used to test differentiation (Fig. 2B, C). At 0%, 2%, and 20% O2, ATP decreased most greatly from days 4–7, with the lowest ATP in TSCs cultured at 2% or 20% O2 at day 7 (Table 1). Thus, energy levels were lowest when differentiation was highest.
Table 1.
Summary
| SAPK-dependent/mitochondria-independent | Mitochondria-dependent/SAPK-independent | ||||||
|---|---|---|---|---|---|---|---|
| Day | 0 | 1 | 2 | 4 | 7 | ||
| Growth: | + | + | 2% confluent1 | 20% O2 confluent | 0.5% O2 confluent | ||
|
| |||||||
| SAPK-dependent Effects: | Hand1 ↑ PL1 ↑ |
Hand1 ↑ PL1 ↑ Gcm1 ↓Tpbpa ↓ Cdx2, Id2, ErrB none |
ND | Sorbitol2 no effect Plf/PL1/SynA |
|||
|
| |||||||
| ATP (free): | |||||||
| 20% | 1 | 0.7 | 0.8 | 0.3 | ~0 | ||
| 2% | 1 | 1 | 1 | 0.3 | 0.1 | ||
| 0.5% | 1 | 1 | 1 | 1.3 | 1.8 | ||
| 0% | 1 | 1 | 0.6 | 0.5 | 0.4 | ||
|
| |||||||
| Morphology (poidy3): | FGF4+ | FGF4− | |||||
| 20% O2 | 2N/4N | >4N ↑ | ND | 2.3+/−0.04N | 29.1+/−0.09N | ||
| 2% O2 | 2N/4N | >4N ↑ | ND | 2.5+/−0.03N | 17.8+/−0.03N | ||
| 0.5% O2 | 2N/4N | >4N ↑↑ | ND | 12.4+/−0.09N | 19.3+/−0.06N | ||
|
| |||||||
| ΔΨm: | 0/edge | 0/edge | most cells | all cells all cells | |||
|
| |||||||
| Multipotency (O2-dependence)(20/2/0.5/0% O2): | |||||||
| X - 3 markers | 10 | 6/6/2/2 | 1.6/1.8/2.0/0.9 | 0.7/0.8/1.4/0.5 | 0.1/0.3/1.0/0.5 | ||
|
| |||||||
| Terminal Differentiation (O2-dependence)(20/2/0.5/0% O2)4: | |||||||
| X - 5 markers | 1 | 1/2/2/2 | 3/3/3/2 | 4/4/4/3 | 25/10/4/2 | ||
| PL1 (early) | 1 | 1/1/2/2 | 2/2/2/1 | 2/5/4/4 | 10/11/4/3 | (type 1) | |
| SynA (later) | 1 | 2/3/2/1 | 2/2/2/2 | 7/1/1/1 | 8/1/1/1 | (type 2) | |
| PL2 (later) | 1 | 1/3/2/4 | 8/5/3/5 | 6/6/8/6 | 71/15/6/2 | (type 2) | |
|
| |||||||
| Mitochondrial antagonists (20% O2, FGF4−) and agonist (2% O2, FGF4−): | |||||||
| Antimycin A | Ctsq, 81%, PL2, 98% ↓ | ||||||
| Cyanide | Ctsq, 71% ↓ | ||||||
| DCA5 | SynA, 93%, PL2, 98% ↑ | ||||||
|
| |||||||
| Regulation of ETC and glycolysis shown by activity level changes after removing FGF4 at 20% and 0.5% O2: | |||||||
| day 2 | −FGF4 at 20% O2 | −FGF4 at 0.5% O2 | |||||
| COX activity6 | +13.34 | +1.36 | |||||
| PKM2 activity7 | −3x | −19.74 | |||||
The precise timing of confluence was variable but the variability was not measured.
SAPK-dependence was not measured directly at 7 days, but SAPK was activated by sorbitol and there were no effects on the three markers of terminal differentiation measured so we conclude there were no SAPK-dependent effects as at 2 days.
Two reports show roughly equivalent 2N and 4N peaks in cycling mTSCs at 20% O2 with FGF438, 85, so we set the average ploidy at “3”. Image J was used to compute area of nuclei from the micrographs of the triplicate biological experiments that produced Figure 3D in this area was used to compute r=radius and volume=4/3 r3. This series of micrographic analysis and computations was done for the variables of FGF4+/− and O2=20/2/0.5% in Figure 3D, panels A–F. Ecadherin staining was used to define the grouped 2N nuclei inside syncytiotrophoblasts to exclude these from the computation of ploidy of endoreduplicating giant cells.
Type 1 and Type 2 terminal differentiation markers are those that have no significant difference in magnitude at 20% or 2% O2, or a significant difference, respectively.
In some ways the measures of DCA sensitivity and the type 2 terminal differentiation markers are the same, since the DCA sensitive markers are those that are less at 2% O2 than are at 20% and can be improved by DCA.
COX and PKM2 activity are a product of the change in total protein multiplied by the change in phosphorylation and this product is multiplied by the total protein at that O2 level. Calculations are tabulated in the Supplemental Materials and Methods.
In contrast, in TSCs cultured at 0.5% O2 ATP increased from days 4–7. The greatest decrease in ATP at 2–20% O2 occurred between days 4 and 7, when differentiation increased most (Fig. 2B, C) but cells were already confluent (data not shown) and thus proliferation does not consume ATP. Highest ATP consumption correlates with highest differentiation at 20% O2, but surprisingly during hypoxic stress when differentiation is lowest ATP accumulates. Thus ATP is not the only factor that limits differentiation during hypoxia.
FGF4 suppresses ROS generation by TSCs
FGF4 regulates mitochondrial function through COX1 and PKM2 phosphorylation, which reduces ETC by preventing carbon entry into mitochondria. Mitochondria produce ROS, which can endanger DNA and are suppressed in stem cells 62. TSCs produce approximately twice as much ROS (H2O2) 48 h after FGF4 removal (Fig. S7). Thus FGF4 maintains low ROS.
Discussion
Since the seminal work from the Fisher lab, O2 effects during imbalanced or blocked placental stem cell differentiation have focused on the insufficient “hypoxia” at 2% 63O2 which does not support differentiation. We corroborate and extend those findings here; 2% O2 provides for insufficient placental differentiation for almost all lineages. Specifically 2% O2 is insufficient for the full development of two lineages at the surface of the labyrinthine placenta; gas exchange-mediating synTA cells and secretory sTGCs. In the first trimester in humans it is likely that 2% O2 is normoxic for the villous surface and this sustains differentiation for type 1 markers described here, but type 2 markers require O2>2%. Moreover, in the lacunar stage of all mammals with invasive trophoblasts that support to later hemochorial placentation development of complete differentiated function, as represented by type 2 markers, will be truncated. But hypoxia <2% O2 also does not support continuing increase in PL1 from days 4–7 after an early disproportionate increase in PL1 induced by hypoxic stress at day 1. The early increase in Hand1 and decrease in Gcm1 is SAPK-dependent and this enzyme supports Hand1-dependent endoreduplication to produce giant cells and production of PL1 while suppressing the development of the later-arising lineages of the chorion that are Gcm1-dependent (Table 1). Suppression of Gcm1 and syncytiotrophoblast formation is associated with preeclampsia23, 64–67.
The support of syncytiotrophoblast formation at 20% but not 1% O2 has been reported in first and third trimester cytotrophoblasts, but alternate lineage choice or intracellular enzymatic regulation of the process was not studied68, 69. It has been reported that glycogen synthase kinase (GSK)3 increase and phosphoinositol 3 kinase (PI3K-Akt) activity decrease is causal for hypoxia-induced Gcm1 protein degradation also at 1% O2 which also occurs in hypoxia associated preeclampsia23. Taken together with these data, the data here suggest that mechanisms mediated by SAPK early and mitochondrial insufficiency later will play a role in human placental differentiation and disease during responses to hypoxia.
Unlike the paradigm of “hypoxia” at 2% O2 emphasized by studies like those of the Fisher lab, we emphasize that “hypoxic” stress for stem cells occurs at lower levels of O2 at ~0.5% which induce differentiation in the first 2 days that favors the first lineage, but fails to support differentiation at 4–7 days. Hypoxic stress creates an approximation of the higher stress levels (SAPK activation) for TSC caused by sorbitol or benzopyrene at 20% O22,3, 24. Like other stresses at 20% O2, hypoxic stress at 0.5% O2 induces multipotency factor decrease and increase of differentiation factors and induces giant cell formation. Specifically, hypoxia-induced Hand1 mediates differentiation of the first lineage, pTGC. Hand1 is necessary for PL1 expression and endoreduplication during normal differentiation70, and 0.5% O2 induces giant cell formation by day 7 despite FGF4 (Fig. 3D, panel C). O2 at 0.5% induces Hand1 at day 1–2 with or without FGF4 before mitochondria activate and PL1 also increases most at 0.5% O2 at day 1–2. But, PL1 expression is relatively low by day 7 after FGF4 removal and mitochondria activation at higher O2 levels. In addition, PL1 expression is low despite the observed differentiation of nearly all TSCs into being giant cells at 0.5% O2. Rapid decrease of multipotency factors and increase of differentiation factors are induced dominantly by stress with or without FGF4. However, 20% O2 provides for an exit from aerobic glycolysis and an increase in mitochondrial membrane charge (ΔΨm) that supports the most energy-requiring lineages from 4–7 days after FGF4 removal. The average differentiation at all O2 levels is equivalent at 4 days after FGF4 removal. But, differentiation increases to much higher levels only at 2–20% O2 where free ATP levels approach zero as highest differentiation is reached at day 7. The highest level of ΔΨm, highest level of differentiation, and lowest ATP suggests that the final increase in differentiation requires the levels of energy supplied by efficient mitochondrial OxPhos, not aerobic glycolysis. It has been suggested that proliferation requires aerobic glycolysis to preserve carbon for proliferation, but cells are confluent at 2–20% O2 by day 4 (Table 1). Lack of cell death or proliferation at day 7 suggests nearly all ATP would support differentiation and that ATP production limits differentiation as free ATP approaches zero.
It is only at 20% O2 that total COX protein increases and total PKM2 protein decreases. COX activity (a product of both total COX increase and phosphorylated COX decreases) increases 13 fold with FGF4 removal at 20% O2 but only slightly >1 fold at 0.5% O2 (Table 1). Interestingly, since total PKM2 is maintained at high levels at 0.5% the removal of FGF4-maintained PKM2 phosphorylation leads to a 19 fold decrease in the block of pyruvate formation that completes glycolysis. This would significantly slow proliferation as carbon would not be shunted into anabolic pathways in steps of glycolysis prior to pyruvate formation60, 71. It is only after FGF4 removal that tyrosine phosphorylation of COX and PKM2 proteins decreases. This decrease in phosphorylation of COX and PKM2 leads to increased ΔΨm and efficiency of ATP production, and decreased aerobic glycolysis, respectively. Thus 0.5% O2 cannot support the differentiation initiated by hypoxic stress or added hyperosmolar stress that induces robust differentiation of TSC at 20% O2. A key problem during the hypoxic stress at 0–0.5% O2 is that it induces TSC differentiation in the first 24–48 hr increase, marked by increases in cell size and PL1 and Plf levels (early lineage markers), but these markers are less than at 20% O2 between days 4–7 due to mitochondrial insufficiency. The tendency is that first lineage markers, which are favored early with hypoxic stress here and by all stresses at 20% O2 as reported here and previously 2, 72, have a low “ceiling” of differentiation at 0.5% O2 after 7 days with or without sorbitol. This suggests that energy or another mitochondrial function is rate-limiting.
Several lines of evidence suggest that mitochondrial insufficiency and failure to leave glycolysis (Warburg metabolism) are the fundamental limits to normal differentiation after FGF4 removal. These lines of evidence also pinpoint the two lineages at the labyrinthine surface as the highest energy- and mitochondrial function-requiring lineages. First although FGF4 is dominant over oxygen at all oxygen levels in maintaining phosphorylation of COX subunit 1 and PKM2, oxygen is dominant over FGF4 at low oxygen levels where total COX cannot increase and PKM2 cannot decrease with FGF4 removal. This suggests that mitochondrial ETC cannot increase at low O2 and the inefficiency of glycolytic production of ATP cannot change at low O2, even after FGF4 is removed and differentiation begins. Also, both mitochondrial inhibitors decrease all differentiated lineages but the largest effects are on the labyrinthine surface lineages. But the highest inhibition occurs in the order 20>2≫0.5% O2 after FGF4 removal, suggesting that mitochondrial function is required only at levels of O2 that support full development of ΔΨm and OxPhos. In addition the mitochondrial agonist has no effects at 20% or 0.5% O2. At 20% O2, this suggests that differentiation is already maximized 7 days after FGF4 removal to the point that ATP is depleted and rate-limiting. At 0.5% O2, this suggests there are no agonist’s effects because mitochondria are inactive due to high PKM2 diverting carbon from the mitochondria, and insufficient COX and O2 to enable OxPhos. Taken together, these lines of evidence suggest that full mitochondrial activity is needed to enable full differentiation after the mitochondria are fully active three days after FGF4 removal
It should be noted that the highest accumulation of ATP increasing most between 4–7 days of FGF4 removal occurs at 0.5% O2. This suggests that other factors besides ATP insufficiency truncate differentiation. Two candidates are residual high multipotency factors or induced hypoxia inducible factors (HIFs) that attenuate TSC differentiation73. HIFs are a prime candidate since they can maintain glucose uptake and aerobic glycolysis74, 75 and may contribute to the mechanism that prevents PKM2 decrease with FGF4 removal at 0.5% O2. Another candidate is reactive oxygen species (ROS) generation by mitochondria which generally rise with increasing ETC activity and increasing ΔΨm and which may be attenuated during hypoxia. We show here that ROS, as well as the ETC and ΔΨm, is suppressed by FGF4 at 20% O2. ROS is known to support differentiation of some stem cells76, 77. Hypothetically, experimental increases of ROS at 0.5% O2 would deplete ATP, enable higher differentiation. But, decreased rates of ATP synthesis at 0.5% O2 would still prevent full parenchymal function compared with cells cultured at 20% O2. Testing of these candidate mechanisms that would limit differentiation is underway, but underlying mitochondrial ATP insufficiency due to hypoxia remains a fundamental problem aside from the other candidates.
Despite FGF4, at 20% O2 hyperosmolar stress induces TSCs to differentiate to the first lineage, producing Hand1 positive pTGC and Hand1-dependent PL12. Analysis of global mRNA markers during induction of pTGC by hyperosmolar stress suggest that later lineages such as sTGCs or synTA cells at 20% O2 do not arise42. This study suggests that stress prioritizes TSC differentiation through induction of broad programs of first but not later lineages, but did not test enzyme-dependence. Another study established that hyperosmolar stress induced-differentiation of Hand1 and PL1 proteins require SAPK enzyme function2. Similarly, departure from the optimum at 2% O2 increased stress, SAPK activity, and SAPK-dependent increase in Hand1 mRNA transcripts. Here we show for the first time that SAPK also mediates a decrease in Gcm1 mRNA transcripts proportional to the departure from the optimum O2 for stemness at 2%. Although the SAPK effects are not the dominant later effects, possibly because of mitochondrial insufficiency limiting some lineages, this is the first evidence for an enzyme that mediates prioritized (aka “default”) differentiation. SAPK double knockouts of SAPK1/2 (aka MAPK8/9) do not affect placentation in a normal vivarium1, 16 so it will be important to study the effects of gestational hypoxic stress in SAPK knockouts. Since MAPK8/9 are the SAPK genes expressed in preimplantation mouse embryos and TSCs, and human first trimester villous explants and first trimester HTR placental lines78 it is likely that crossover loss-of-function studies can be done in available stem cells and tissue samples from rodents and humans.
There are limitations to in vitro studies, the reductionist approach of focusing on a single stem cell type precludes the adaptation to gestational hypoxia that has been shown to occur over longer periods of time and in interaction with many fetal and maternal cell types79–82. However an advantage of the reductionist approach it to understand substantial periods of hypoxic stress that could occur from E2.5-E6.5 before experimental hypoxia was first applied at E6.5 in the rodent gestational model. In addition hypoxia may compound with other stressors or etiologies of hypoxia may change and synergize over time creating longer exposures, despite the adaptation occurring in the models studied to date. A pathophysiologically relevant local level of hypoxic at the implantation site is 0.5% O2, but this cannot be applied systemically to gestational females as it may cause severe systemic effects. The ability to model local hypoxic effects is another advantage of the culture model. Another profound limitation of the studies analyze here is in the use of biochemical assays to assay stress-induced changes in TSC populations which are heterogeneous before and after stress. From the studies performed here it is not possible to conclude whether all cells have a similar decrease in potency and increase in differentiation factors, or whether subpopulations of cells account for all of the potency decrease and differentiation increase. Future studies must use assays that study the stress induced changes in population size and marker intensity and also the fate of stem cells after stress. We have found that stressed, cultured ESCs also undergo prioritized differentiation and these studies were also limited by using solely of biochemical assays 43. However in a follow up study double, viable potency reporter ESCs were made and reporters and gave results similar to the biochemical assays83. The advantage of the viable reporter ESCs can also be used with flow cytometry and fluorescence activated cell sorting to determine changes in subpopulation size and intensity and also to determine the fate of the cells after potency decrease.
Gestational hypoxia has revealed that placental and uterine hormones that are unnecessary during normal development become essential during hypoxic stress in vivo1, 16. In addition, gestational hypoxia produces a phenotype in vivo that has similarities with the phenotype observed here during hypoxia in culture. In both cases there was an increase in pTGC and a suppression of labyrinthine placenta.
A key interpretation from the data analyzed here is that stress leads to decreased stem cell growth and the further depletion of stem cell multipotency to enable differentiation of early essential function. A similar outcome is seen in preeclamptic human placenta where proliferative cytotrophoblasts are depleted while differentiated villous surface functions are maintained84.
Stress induces differentiation but hypoxia for stemness, 0.5% O2, truncates this and leads to rapid but incomplete differentiation that suppresses all lineages and two lineages at the labyrinthine surface are suppressed the most probably due to failure to depart from aerobic glycolysis and activate mitochondria (Table 1). The mechanisms mediating the suppression are important to understand since diseases such as intrauterine growth retardation and preeclampsia can feature labyrinthine dysfunction. It is important to test for these hypoxic stress effects in gestational rodent models and in human first trimester villous explants or human TSCs.
Supplementary Material
Highlights.
Change from the O2 stem cell optimum induces SAPK-dependent increase in first, and decrease in later, differentiated lineages
Hypoxia induces early stem differentiation of stem cells but can’t sustain differentiation due to mitochondrial insufficiency
At all [O2]s FGF4 maintains stemness by decreasing mitochondrial electron transport chain and increasing aerobic glycolysis
Only at [O2]>2% can the rate-limiting enzyme of the electron transport chain increase to enable differentiation
Ox Phos agonists and antagonists show that markers of 2 lineages require mitochondrial activity to differentiate
Acknowledgments
This research was supported by grants to DAR from NIH (1R03HD061431 02) and from the Office of the Vice President for Research at Wayne State University.
We thank Mike Kruger and Jing Dai for advice on statistical analysis. We are also indebted to Drs. Michael Nelson, Mike Soares, Nandor Than, Sasha Drewlo, David Gardner, David Simmons, and Husam Abu-Soud for helpful discussion and criticisms parts of or the entire manuscript.
Footnotes
Publisher's Disclaimer: This is a PDF file of an unedited manuscript that has been accepted for publication. As a service to our customers we are providing this early version of the manuscript. The manuscript will undergo copyediting, typesetting, and review of the resulting proof before it is published in its final citable form. Please note that during the production process errors may be discovered which could affect the content, and all legal disclaimers that apply to the journal pertain.
References
- 1.Xie Y, Awonuga AO, Zhou S, et al. Interpreting the stress response of early mammalian embryos and their stem cells. Int Rev Cell Mol Biol. 2011;287:43–95. doi: 10.1016/B978-0-12-386043-9.00002-5. [DOI] [PubMed] [Google Scholar]
- 2.Awonuga AO, Zhong W, Abdallah ME, et al. Eomesodermin, HAND1, and CSH1 proteins are induced by cellular stress in a stress-activated protein kinase-dependent manner. Mol Reprod Dev. 2011;78:519–528. doi: 10.1002/mrd.21342. [DOI] [PMC free article] [PubMed] [Google Scholar]
- 3.Zhong W, Xie Y, Abdallah M, et al. Cellular stress causes reversible, PRKAA1/2-, and proteasome-dependent ID2 protein loss in trophoblast stem cells. Reproduction. 2010;140:921–930. doi: 10.1530/REP-10-0268. [DOI] [PMC free article] [PubMed] [Google Scholar]
- 4.Cross JC, Werb Z, Fisher SJ. Implantation and the placenta: key pieces of the development puzzle. Science. 1994;266:1508–1518. doi: 10.1126/science.7985020. [DOI] [PubMed] [Google Scholar]
- 5.Fischer B, Bavister BD. Oxygen tension in the oviduct and uterus of rhesus monkeys, hamsters and rabbits. J Reprod Fertil. 1993;99:673–679. doi: 10.1530/jrf.0.0990673. [DOI] [PubMed] [Google Scholar]
- 6.Yedwab GA, Paz G, Homonnai TZ, et al. The temperature, pH, and partial pressure of oxygen in the cervix and uterus of women and uterus of rats during the cycle. Fertil Steril. 1976;27:304–309. doi: 10.1016/s0015-0282(16)41722-x. [DOI] [PubMed] [Google Scholar]
- 7.Kaufman DL, Mitchell JA. Alterations in intrauterine oxygen tension during the estrous cycle in the rat and hamster and its regulation by ovarian steroid hormones: a comparative study. Adv Exp Med Biol. 1990;277:745–750. doi: 10.1007/978-1-4684-8181-5_85. [DOI] [PubMed] [Google Scholar]
- 8.Mitchell JA, Van Kainen BR. Effects of alcohol on intrauterine oxygen tension in the rat. Alcohol Clin Exp Res. 1992;16:308–310. doi: 10.1111/j.1530-0277.1992.tb01382.x. [DOI] [PubMed] [Google Scholar]
- 9.Byatt-Smith JG, Leese HJ, Gosden RG. An investigation by mathematical modelling of whether mouse and human preimplantation embryos in static culture can satisfy their demands for oxygen by diffusion. Hum Reprod. 1991;6:52–57. doi: 10.1093/oxfordjournals.humrep.a137258. [DOI] [PubMed] [Google Scholar]
- 10.Hewitson LC, Leese HJ. Energy metabolism of the trophectoderm and inner cell mass of the mouse blastocyst. J Exp Zool. 1993;267:337–343. doi: 10.1002/jez.1402670310. [DOI] [PubMed] [Google Scholar]
- 11.Harvey AJ, Kind KL, Thompson JG. REDOX regulation of early embryo development. Reproduction. 2002;123:479–486. doi: 10.1530/rep.0.1230479. [DOI] [PubMed] [Google Scholar]
- 12.Burton GJ. Oxygen, the Janus gas; its effects on human placental development and function. J Anat. 2009;215:27–35. doi: 10.1111/j.1469-7580.2008.00978.x. [DOI] [PMC free article] [PubMed] [Google Scholar]
- 13.Burton GJ, Jauniaux E, Charnock-Jones DS. The influence of the intrauterine environment on human placental development. Int J Dev Biol. 2010;54:303–312. doi: 10.1387/ijdb.082764gb. [DOI] [PubMed] [Google Scholar]
- 14.Enders AC. Trophoblast differentiation during the transition from trophoblastic plate to lacunar stage of implantation in the rhesus monkey and human. Am J Anat. 1989;186:85–98. doi: 10.1002/aja.1001860107. [DOI] [PubMed] [Google Scholar]
- 15.Enders AC, Lantz KC, Peterson PE, et al. From blastocyst to placenta: the morphology of implantation in the baboon. Hum Reprod Update. 1997;3:561–573. doi: 10.1093/humupd/3.6.561. [DOI] [PubMed] [Google Scholar]
- 16.Rappolee DA, Zhou S, Puscheck EE, et al. Stress responses at the endometrial-placental interface regulate labyrinthine placental differentiation from trophoblast stem cells. Reproduction. 2013;145:R139–155. doi: 10.1530/REP-12-0240. [DOI] [PubMed] [Google Scholar]
- 17.Zhou S, Xie Y, Puscheck EE, et al. Oxygen levels that optimize TSC culture are identified by maximizing growth rates and minimizing stress. Placenta. 2011;32:475–481. doi: 10.1016/j.placenta.2011.03.013. [DOI] [PMC free article] [PubMed] [Google Scholar]
- 18.Knofler M. Critical growth factors and signalling pathways controlling human trophoblast invasion. Int J Dev Biol. 2010;54:269–280. doi: 10.1387/ijdb.082769mk. [DOI] [PMC free article] [PubMed] [Google Scholar]
- 19.Janatpour MJ, McMaster MT, Genbacev O, et al. Id-2 regulates critical aspects of human cytotrophoblast differentiation, invasion and migration. Development. 2000;127:549–558. doi: 10.1242/dev.127.3.549. [DOI] [PubMed] [Google Scholar]
- 20.Winn VD, Gormley M, Paquet AC, et al. Severe preeclampsia-related changes in gene expression at the maternal-fetal interface include sialic acid-binding immunoglobulin-like lectin-6 and pappalysin-2. Endocrinology. 2009;150:452–462. doi: 10.1210/en.2008-0990. [DOI] [PMC free article] [PubMed] [Google Scholar]
- 21.Burton GJ, Jauniaux E. Placental oxidative stress: from miscarriage to preeclampsia. J Soc Gynecol Investig. 2004;11:342–352. doi: 10.1016/j.jsgi.2004.03.003. [DOI] [PubMed] [Google Scholar]
- 22.Myatt L. Review: Reactive oxygen and nitrogen species and functional adaptation of the placenta. Placenta. 2010;31 (Suppl):S66–69. doi: 10.1016/j.placenta.2009.12.021. [DOI] [PMC free article] [PubMed] [Google Scholar]
- 23.Chiang MH, Liang FY, Chen CP, et al. Mechanism of hypoxia-induced GCM1 degradation: implications for the pathogenesis of preeclampsia. J Biol Chem. 2009;284:17411–17419. doi: 10.1074/jbc.M109.016170. [DOI] [PMC free article] [PubMed] [Google Scholar]
- 24.Xie Y, Abdallah ME, Awonuga AO, et al. Benzo(a)pyrene causes PRKAA1/2-dependent ID2 loss in trophoblast stem cells. Mol Reprod Dev. 2010;77:533–539. doi: 10.1002/mrd.21178. [DOI] [PMC free article] [PubMed] [Google Scholar]
- 25.Puscheck EE, Awonuga AO, Yang Y, et al. Molecular Biology of the Stress Response in the Early Embryo and its Stem Cells. In: Henry Leese DB, editor. Cell Signaling During Mammalian Early Embro Development. Springer; 2014. [Google Scholar]
- 26.Nagata Y, Shoji W, Obinata M, et al. Phosphorylation of helix-loop-helix proteins ID1, ID2 and ID3. Biochem Biophys Res Commun. 1995;207:916–926. doi: 10.1006/bbrc.1995.1273. [DOI] [PubMed] [Google Scholar]
- 27.Sun XH, Copeland NG, Jenkins NA, et al. Id proteins Id1 and Id2 selectively inhibit DNA binding by one class of helix-loop-helix proteins. Mol Cell Biol. 1991;11:5603–5611. doi: 10.1128/mcb.11.11.5603. [DOI] [PMC free article] [PubMed] [Google Scholar]
- 28.Luo J, Sladek R, Bader JA, et al. Placental abnormalities in mouse embryos lacking the orphan nuclear receptor ERR-beta. Nature. 1997;388:778–782. doi: 10.1038/42022. [DOI] [PubMed] [Google Scholar]
- 29.Tremblay GB, Kunath T, Bergeron D, et al. Diethylstilbestrol regulates trophoblast stem cell differentiation as a ligand of orphan nuclear receptor ERR beta. Genes Dev. 2001;15:833–838. doi: 10.1101/gad.873401. [DOI] [PMC free article] [PubMed] [Google Scholar]
- 30.Chawengsaksophak K, James R, Hammond VE, et al. Homeosis and intestinal tumours in Cdx2 mutant mice. Nature. 1997;386:84–87. doi: 10.1038/386084a0. [DOI] [PubMed] [Google Scholar]
- 31.Niwa H, Toyooka Y, Shimosato D, et al. Interaction between Oct3/4 and Cdx2 determines trophectoderm differentiation. Cell. 2005;123:917–929. doi: 10.1016/j.cell.2005.08.040. [DOI] [PubMed] [Google Scholar]
- 32.Riley P, Anson-Cartwright L, Cross JC. The Hand1 bHLH transcription factor is essential for placentation and cardiac morphogenesis. Nat Genet. 1998;18:271–275. doi: 10.1038/ng0398-271. [DOI] [PubMed] [Google Scholar]
- 33.Anson-Cartwright L, Dawson K, Holmyard D, et al. The glial cells missing-1 protein is essential for branching morphogenesis in the chorioallantoic placenta. Nat Genet. 2000;25:311–314. doi: 10.1038/77076. [DOI] [PubMed] [Google Scholar]
- 34.Simmons DG, Fortier AL, Cross JC. Diverse subtypes and developmental origins of trophoblast giant cells in the mouse placenta. Dev Biol. 2007;304:567–578. doi: 10.1016/j.ydbio.2007.01.009. [DOI] [PubMed] [Google Scholar]
- 35.Simmons DG, Natale DR, Begay V, et al. Early patterning of the chorion leads to the trilaminar trophoblast cell structure in the placental labyrinth. Development. 2008;135:2083–2091. doi: 10.1242/dev.020099. [DOI] [PMC free article] [PubMed] [Google Scholar]
- 36.Simmons DG, Rawn S, Davies A, et al. Spatial and temporal expression of the 23 murine Prolactin/Placental Lactogen-related genes is not associated with their position in the locus. BMC Genomics. 2008;9:352. doi: 10.1186/1471-2164-9-352. [DOI] [PMC free article] [PubMed] [Google Scholar]
- 37.Soares MJ, Konno T, Alam SM. The prolactin family: effectors of pregnancy-dependent adaptations. Trends Endocrinol Metab. 2007;18:114–121. doi: 10.1016/j.tem.2007.02.005. [DOI] [PubMed] [Google Scholar]
- 38.Tanaka S, Kunath T, Hadjantonakis AK, et al. Promotion of trophoblast stem cell proliferation by FGF4. Science. 1998;282:2072–2075. doi: 10.1126/science.282.5396.2072. [DOI] [PubMed] [Google Scholar]
- 39.Chai N, Patel Y, Jacobson K, et al. FGF is an essential regulator of the fifth cell division in preimplantation mouse embryos. Dev Biol. 1998;198:105–115. doi: 10.1006/dbio.1997.8858. [DOI] [PubMed] [Google Scholar]
- 40.Corson LB, Yamanaka Y, Lai KM, et al. Spatial and temporal patterns of ERK signaling during mouse embryogenesis. Development. 2003;130:4527–4537. doi: 10.1242/dev.00669. [DOI] [PubMed] [Google Scholar]
- 41.Xie Y, Zhong W, Wang Y, et al. Using hyperosmolar stress to measure biologic and stress-activated protein kinase responses in preimplantation embryos. Mol Hum Reprod. 2007;13:473–481. doi: 10.1093/molehr/gam027. [DOI] [PubMed] [Google Scholar]
- 42.Liu J, Xu W, Sun T, et al. Hyperosmolar Stress Induces Global mRNA Responses in Placental Trophoblast Stem Cells that Emulate Early Post-implantation Differentiation. Placenta. 2009;30:66–73. doi: 10.1016/j.placenta.2008.10.009. [DOI] [PMC free article] [PubMed] [Google Scholar]
- 43.Slater JA, Zhou S, Puscheck EE, et al. Stress-Induced Enzyme Activation Primes Murine Embryonic Stem Cells to Differentiate toward Extraembryonic Lineages. Stem Cells Dev. 2014 doi: 10.1089/scd.2014.0157. In Resubmission. [DOI] [PMC free article] [PubMed] [Google Scholar]
- 44.Huppertz B. Placental origins of preeclampsia: challenging the current hypothesis. Hypertension. 2008;51:970–975. doi: 10.1161/HYPERTENSIONAHA.107.107607. [DOI] [PubMed] [Google Scholar]
- 45.Redman CW, Sargent IL. Latest advances in understanding preeclampsia. Science. 2005;308:1592–1594. doi: 10.1126/science.1111726. [DOI] [PubMed] [Google Scholar]
- 46.Redman CW. Current topic: pre-eclampsia and the placenta. Placenta. 1991;12:301–308. doi: 10.1016/0143-4004(91)90339-h. [DOI] [PubMed] [Google Scholar]
- 47.Roberts JM, Hubel CA. The two stage model of preeclampsia: variations on the theme. Placenta. 2009;30 (Suppl A):S32–37. doi: 10.1016/j.placenta.2008.11.009. [DOI] [PMC free article] [PubMed] [Google Scholar]
- 48.Xu Z, Zhao J, Zhang H, et al. Spontaneous miscarriages are explained by the stress/glucocorticoid/lipoxin A4 axis. J Immunol. 2013;190:6051–6058. doi: 10.4049/jimmunol.1202807. [DOI] [PubMed] [Google Scholar]
- 49.Johnson KL, Tao K, Stroh H, et al. Increased fetal cell trafficking in murine lung following complete pregnancy loss from exposure to lipopolysaccharide. Fertil Steril. 2010;93:1718–1721. e1712. doi: 10.1016/j.fertnstert.2009.08.042. [DOI] [PMC free article] [PubMed] [Google Scholar]
- 50.Ahmed A, Singh J, Khan Y, et al. A new mouse model to explore therapies for preeclampsia. PLoS One. 2010;5:e13663. doi: 10.1371/journal.pone.0013663. [DOI] [PMC free article] [PubMed] [Google Scholar]
- 51.Kumasawa K, Ikawa M, Kidoya H, et al. Pravastatin induces placental growth factor (PGF) and ameliorates preeclampsia in a mouse model. Proc Natl Acad Sci U S A. 2011;108:1451–1455. doi: 10.1073/pnas.1011293108. [DOI] [PMC free article] [PubMed] [Google Scholar]
- 52.Vogt E, Ng AK, Rote NS. A model for the antiphospholipid antibody syndrome: monoclonal antiphosphatidylserine antibody induces intrauterine growth restriction in mice. Am J Obstet Gynecol. 1996;174:700–707. doi: 10.1016/s0002-9378(96)70453-2. [DOI] [PubMed] [Google Scholar]
- 53.Cox B, Kotlyar M, Evangelou AI, et al. Comparative systems biology of human and mouse as a tool to guide the modeling of human placental pathology. Mol Syst Biol. 2009;5:279. doi: 10.1038/msb.2009.37. [DOI] [PMC free article] [PubMed] [Google Scholar]
- 54.Zhong W, Xie Y, Wang Y, et al. Use of hyperosmolar stress to measure stress-activated protein kinase activation and function in human HTR cells and mouse trophoblast stem cells. Reprod Sci. 2007;14:534–547. doi: 10.1177/1933719107307182. [DOI] [PubMed] [Google Scholar]
- 55.Villani G, Greco M, Papa S, et al. Low reserve of cytochrome c oxidase capacity in vivo in the respiratory chain of a variety of human cell types. J Biol Chem. 1998;273:31829–31836. doi: 10.1074/jbc.273.48.31829. [DOI] [PubMed] [Google Scholar]
- 56.Pacelli C, Latorre D, Cocco T, et al. Tight control of mitochondrial membrane potential by cytochrome c oxidase. Mitochondrion. 2011;11:334–341. doi: 10.1016/j.mito.2010.12.004. [DOI] [PubMed] [Google Scholar]
- 57.Lee I, Salomon AR, Ficarro S, et al. cAMP-dependent tyrosine phosphorylation of subunit I inhibits cytochrome c oxidase activity. J Biol Chem. 2005;280:6094–6100. doi: 10.1074/jbc.M411335200. [DOI] [PubMed] [Google Scholar]
- 58.Samavati L, Lee I, Mathes I, et al. Tumor necrosis factor alpha inhibits oxidative phosphorylation through tyrosine phosphorylation at subunit I of cytochrome c oxidase. J Biol Chem. 2008;283:21134–21144. doi: 10.1074/jbc.M801954200. [DOI] [PMC free article] [PubMed] [Google Scholar]
- 59.Christofk HR, Vander Heiden MG, Wu N, et al. Pyruvate kinase M2 is a phosphotyrosine-binding protein. Nature. 2008;452:181–186. doi: 10.1038/nature06667. [DOI] [PubMed] [Google Scholar]
- 60.Hitosugi T, Kang S, Vander Heiden MG, et al. Tyrosine phosphorylation inhibits PKM2 to promote the Warburg effect and tumor growth. Sci Signal. 2009;2:ra73. doi: 10.1126/scisignal.2000431. [DOI] [PMC free article] [PubMed] [Google Scholar]
- 61.Luo W, Hu H, Chang R, et al. Pyruvate kinase M2 is a PHD3-stimulated coactivator for hypoxia-inducible factor 1. Cell. 2011;145:732–744. doi: 10.1016/j.cell.2011.03.054. [DOI] [PMC free article] [PubMed] [Google Scholar]
- 62.Simon MC, Keith B. The role of oxygen availability in embryonic development and stem cell function. Nat Rev Mol Cell Biol. 2008;9:285–296. doi: 10.1038/nrm2354. [DOI] [PMC free article] [PubMed] [Google Scholar]
- 63.Genbacev O, Zhou Y, Ludlow JW, et al. Regulation of human placental development by oxygen tension. Science. 1997;277:1669–1672. doi: 10.1126/science.277.5332.1669. [DOI] [PubMed] [Google Scholar]
- 64.Baczyk D, Drewlo S, Proctor L, et al. Glial cell missing-1 transcription factor is required for the differentiation of the human trophoblast. Cell Death Differ. 2009;16:719–727. doi: 10.1038/cdd.2009.1. [DOI] [PubMed] [Google Scholar]
- 65.Tache V, Ciric A, Moretto-Zita M, et al. Hypoxia and Trophoblast Differentiation: A Key Role for PPARgamma. Stem Cells Dev. 2013;22:2815–2824. doi: 10.1089/scd.2012.0596. [DOI] [PMC free article] [PubMed] [Google Scholar]
- 66.Drewlo S, Baczyk D, Dunk C, et al. Fusion assays and models for the trophoblast. Methods Mol Biol. 2008;475:363–382. doi: 10.1007/978-1-59745-250-2_21. [DOI] [PubMed] [Google Scholar]
- 67.Soleymanlou N, Jurisicova A, Wu Y, et al. Hypoxic switch in mitochondrial myeloid cell leukemia factor-1/Mtd apoptotic rheostat contributes to human trophoblast cell death in preeclampsia. Am J Pathol. 2007;171:496–506. doi: 10.2353/ajpath.2007.070094. [DOI] [PMC free article] [PubMed] [Google Scholar]
- 68.Wich C, Kausler S, Dotsch J, et al. Syncytin-1 and glial cells missing a: hypoxia-induced deregulated gene expression along with disordered cell fusion in primary term human trophoblasts. Gynecol Obstet Invest. 2009;68:9–18. doi: 10.1159/000209396. [DOI] [PubMed] [Google Scholar]
- 69.Robins JC, Heizer A, Hardiman A, et al. Oxygen tension directs the differentiation pathway of human cytotrophoblast cells. Placenta. 2007;28:1141–1146. doi: 10.1016/j.placenta.2007.05.006. [DOI] [PubMed] [Google Scholar]
- 70.Martindill DM, Riley PR. Cell cycle switch to endocycle: the nucleolus lends a hand. Cell Cycle. 2008;7:17–23. doi: 10.4161/cc.7.1.5228. [DOI] [PubMed] [Google Scholar]
- 71.Vander Heiden MG, Lunt SY, Dayton TL, et al. Metabolic Pathway Alterations that Support Cell Proliferation. Cold Spring Harb Symp Quant Biol. 2012 doi: 10.1101/sqb.2012.76.010900. [DOI] [PubMed] [Google Scholar]
- 72.Rappolee DA, Xie Y, Slater JA, et al. Toxic stress prioritizes and imbalances stem cell differentiation: implications for new biomarkers and in vitro toxicology tests. Syst Biol Reprod Med. 2012;58:33–40. doi: 10.3109/19396368.2011.647381. [DOI] [PMC free article] [PubMed] [Google Scholar]
- 73.Caniggia I, Winter J, Lye SJ, et al. Oxygen and placental development during the first trimester: implications for the pathophysiology of pre-eclampsia. Placenta. 2000;21 (Suppl A):S25–30. doi: 10.1053/plac.1999.0522. [DOI] [PubMed] [Google Scholar]
- 74.Semenza GL. Regulation of metabolism by hypoxia-inducible factor 1. Cold Spring Harb Symp Quant Biol. 2011;76:347–353. doi: 10.1101/sqb.2011.76.010678. [DOI] [PubMed] [Google Scholar]
- 75.Qing G, Skuli N, Mayes PA, et al. Combinatorial regulation of neuroblastoma tumor progression by N-Myc and hypoxia inducible factor HIF-1alpha. Cancer Res. 2010;70:10351–10361. doi: 10.1158/0008-5472.CAN-10-0740. [DOI] [PMC free article] [PubMed] [Google Scholar]
- 76.Rehman J. Empowering self-renewal and differentiation: the role of mitochondria in stem cells. J Mol Med. 2010;88:981–986. doi: 10.1007/s00109-010-0678-2. [DOI] [PMC free article] [PubMed] [Google Scholar]
- 77.Ji AR, Ku SY, Cho MS, et al. Reactive oxygen species enhance differentiation of human embryonic stem cells into mesendodermal lineage. Exp Mol Med. 2010;42:175–186. doi: 10.3858/emm.2010.42.3.018. [DOI] [PMC free article] [PubMed] [Google Scholar]
- 78.Zhong W, Sun T, Wang QT, et al. SAPKgamma/JNK1 and SAPKalpha/JNK2 mRNA transcripts are expressed in early gestation human placenta and mouse eggs, preimplantation embryos, and trophoblast stem cells. Fertil Steril. 2004;82 (Suppl 3):1140–1148. doi: 10.1016/j.fertnstert.2004.06.014. [DOI] [PubMed] [Google Scholar]
- 79.Chakraborty D, Rumi MA, Soares MJ. NK cells, hypoxia and trophoblast cell differentiation. Cell Cycle. 2012;11:2427–2430. doi: 10.4161/cc.20542. [DOI] [PMC free article] [PubMed] [Google Scholar]
- 80.Rosario GX, Konno T, Soares MJ. Maternal hypoxia activates endovascular trophoblast cell invasion. Dev Biol. 2008;314:362–375. doi: 10.1016/j.ydbio.2007.12.007. [DOI] [PMC free article] [PubMed] [Google Scholar]
- 81.Alam SM, Konno T, Dai G, et al. A uterine decidual cell cytokine ensures pregnancy-dependent adaptations to a physiological stressor. Development. 2007;134:407–415. doi: 10.1242/dev.02743. [DOI] [PubMed] [Google Scholar]
- 82.Ain R, Dai G, Dunmore JH, et al. A prolactin family paralog regulates reproductive adaptations to a physiological stressor. Proc Natl Acad Sci U S A. 2004;101:16543–16548. doi: 10.1073/pnas.0406185101. [DOI] [PMC free article] [PubMed] [Google Scholar]
- 83.Li Q, Sanchez-Rodriguez E, Gomez-Lopez N, et al. Rapid development and validation of double viable potency factor activity reporter embryonic stem cells Biotechniques. 2014. Manuscript in preparation. [Google Scholar]
- 84.Longtine MS, Chen B, Odibo AO, et al. Villous trophoblast apoptosis is elevated and restricted to cytotrophoblasts in pregnancies complicated by preeclampsia, IUGR, or preeclampsia with IUGR. Placenta. 2012;33:352–359. doi: 10.1016/j.placenta.2012.01.017. [DOI] [PMC free article] [PubMed] [Google Scholar]
- 85.Ullah Z, Kohn MJ, Yagi R, et al. Differentiation of trophoblast stem cells into giant cells is triggered by p57/Kip2 inhibition of CDK1 activity. Genes Dev. 2008;22:3024–3036. doi: 10.1101/gad.1718108. [DOI] [PMC free article] [PubMed] [Google Scholar]
Associated Data
This section collects any data citations, data availability statements, or supplementary materials included in this article.