Abstract
Circular dichroism (CD) spectroscopy is a valuable method for defining canonical secondary structure contents of proteins based on empirically-defined spectroscopic signatures derived from proteins with known three-dimensional structures. Many proteins identified as being “Intrinsically Disordered Proteins” have a significant amount of their structure that is neither sheet, helix, nor turn; this type of structure is often classified by CD as “other”, “random coil”, “unordered”, or “disordered”. However the “other” category can also include polyproline II (PPII)-type structures, whose spectral properties have not been well-distinguished from those of unordered structures. In this study, synchrotron radiation circular dichroism spectroscopy was used to investigate the spectral properties of collagen and polyproline, which both contain PPII-type structures. Their native spectra were compared as representatives of PPII structures. In addition, their spectra before and after treatment with various conditions to produce unfolded or denatured structures were also compared, with the aim of defining the differences between CD spectra of PPII and disordered structures. We conclude that the spectral features of collagen are more appropriate than those of polyproline for use as the representative spectrum for PPII structures present in typical amino acid-containing proteins, and that the single most characteristic spectroscopic feature distinguishing a PPII structure from a disordered structure is the presence of a positive peak around 220nm in the former but not in the latter. These spectra are now available for inclusion in new reference data sets used for CD analyses of the secondary structures of soluble proteins.
Keywords: polyproline, collagen, synchrotron radiation circular dichroism spectroscopy, thermal unfolding, intrinsically disordered proteins, secondary structure
Introduction
Circular dichroism (CD) spectroscopy is a widely used method for identifying and quantitating secondary structures of proteins in solution using empirical methods based on data derived from proteins for which there are both spectra and crystal structures available.1 A number of algorithms2–5 and reference data sets1,6–8 have been created over the past 40 years which have been highly successful in defining helical, sheet (and sometimes turn) secondary structures from these data. Whatever spectral characteristics have not been ascribed to one of the canonical secondary structures are then generally allocated to the “other” (formerly called “random coil”)9 category, and tend to be interpreted as “disordered” or “unordered” structures. However, rather than a single defined structure with specific hydrogen bonding patterns and a regular range of backbone phi, psi (Ramachandran) angles, “other” is usually a mixture of structures, often in dynamic equilibrium. The analysis problem is exacerbated because, in general, the reference proteins which have been used to define the structural characteristics of proteins in the CD reference datasets are derived from crystalline proteins, which, almost by definition, do not have significant amounts of “disordered” regions.
There is now considerable interest in accurately characterizing and quantifying unordered structure in proteins, as it has been postulated that >40% of all proteins have significant amounts of unordered structure.10 Proteins with large amounts of unordered structure tend to be categorized as “intrinsically disordered proteins” (IDPs) and are important biologically as they appear to play critical roles in signaling and molecular interactions. Hence, it is now imperative to develop methods to better characterize and quantitate these types of structures and distinguish them from other types of secondary structures.
A major challenge to spectroscopically classifying and quantifying unordered structures is distinguishing them from polyproline II (PPII)-type structures that have tended to be defined by similar spectral characteristics. PPII secondary structures are left-handed helices formed when sequential residues adopt Ramachandran ϕ, ψ angles of roughly (−75°, 150°) and have trans peptide bonds.11,12 They are primarily found in proteins or polymers which have substantial amounts of proline residues, and stretches of these residues often are specifically bound by SH3 domains of partner proteins,12 thus suggesting they are important elements for protein-protein interactions. A recent bioinformatics analyses of the human proteome has also suggested proteins with extended stretches of polyprolines may have roles in DNA/RNA processing and developmental processes.13 Prolines and other imino acids do not contain amino protons in their polypeptide backbones and hence are not capable of forming intramolecularly hydrogen bonded secondary structures, such as those found in alpha-helical or beta-sheet structures. Due to steric restrictions imposed by the proline cyclic side chain, PPII structures do, however, adopt regular structures which are present in a narrow and well-defined region of the Ramachandran plot. It has also been suggested that other residues, such as stretches of alanine residues may form PPII-like structures.14
The collagens, a class of proteins composed of ∼25% imino acids (proline or hydroxyproline) also form a related type of helical structure (although in this case because some intramolecular backbone hydrogen bonds are possible, and because of side chains which can also form hydrogen bonds, they tend to form triple helical quaternary structures comprised of left-handed helical structures with similar dihedral angles (−50°, 150°) to the single helical polyproline structures). They are also referred to as having PPII-like secondary structures. Their CD spectra tend to have a positive band at around 220 nm and a large negative band in the region of ∼190–200 nm.
The circular dichroism spectra of a number of (almost entirely) unfolded/disordered proteins have also been shown to have remarkably similar characteristics to the spectra ascribed to PPII types of secondary structure,15,16 with a negative peak in the region around 190–200 nm, but with none of the negative bands in the region of 200–240 nm that are typical of alpha-helical or beta-sheet secondary structures. As a result of this, secondary structure analyses do not often distinguish between PPII and unfolded types of structures, and they are often both included in empirical reference datasets as the single category “other”.
In this study, the spectra of PPII structures present in polyproline and collagen were compared with spectra of the same polypeptides under a number of different denaturing conditions which can produce “unfolded” or “disordered structures”. In this way, it was possible to directly distinguish between the spectral features associated with PPII and unfolded structures, and to demonstrate the extent of variability of unordered spectra produced under different conditions.
The major peaks for these types of structures occur at wavelengths below 200 nm, so it is important to be able to accurately observe regions of the spectra which are located at low wavelengths. This is often difficult to achieve using conventional CD spectroscopy due to the low light flux in lab-based instruments below ∼190 nm. However, synchrotron radiation circular dichroism (SRCD) spectroscopy,17 which utilizes the high light flux produced by synchrotrons in the vacuum ultraviolet wavelength regime, enables accurate observations of electronic transitions down to wavelengths as low as 170 nm in aqueous solutions, thereby providing spectra with higher information content and better signal-to-noise ratios. Hence SRCD spectroscopy was used in this study to define the spectral characteristics of native and unfolded polyproline and collagen.
Results
Comparison of polyproline and collagen spectra
Over the years, a number of spectra of polyproline and collagen (as shown in refs. 12, 18–22) have been produced under different conditions, making detailed comparisons difficult. In addition, a number of the spectra which should have been very similar, appear to differ significantly. As both polyproline and collagen polypeptides adopt similar phi, psi angles in solution, it was expected that they would produce similar CD spectra under the same conditions. In this study in aqueous solution (pH 7.0), the SRCD spectra of polyproline and soluble type II collagen were shown to have similar shapes (and peak ratios) but distinctly different (Fig. 1) peak locations: polyproline has a large negative peak at 206 nm, and two small maxima centred at 185 and 228 nm; whereas collagen has a large negative peak at 197 nm, and a small positive the positive peak centred at 220 nm. Effectively all the peaks in collagen are blue-shifted by around 8–10 nm with respect to those in polyproline. This is because all of the peptide bonds in the polyproline molecule involve imino rather than amino groups, which alter the energetics (and thus peak positions) of the n → π∗ and π → π∗ transitions23 even though their backbone phi, psi angles are the same as those of collagen. The collagen molecules are composed of roughly 1/3 imino acids with the remaining residues being amino acids, so for the most part their transitions lie at wavelengths more typical for peptides containing amino acids. The spectrum of type II soluble collagen (Fig. 1) is very similar to a previously published spectrum of type IV collagen,22 indicating similar spectral characteristics are present even for different types of collagen which form PPII-type structures. This suggests, ironically, that the native collagen spectrum is likely to be a better representation than polyproline for PPII-like features in typical proteins containing amino acids.
Figure 1.
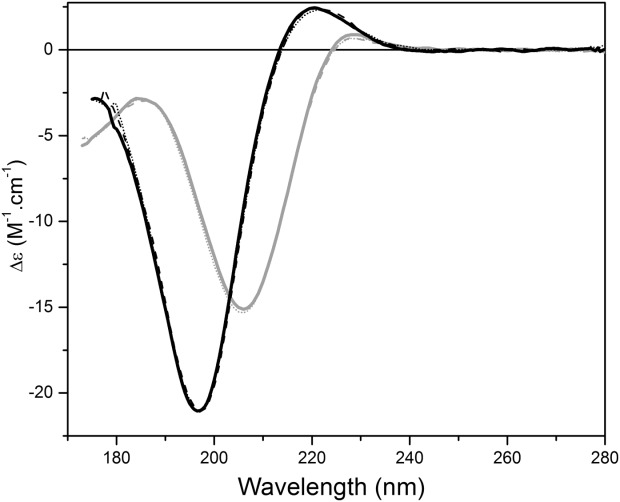
Spectral characteristics of native polyproline and collagen, and effects of pH treatment. SRCD spectra of polyproline (gray) and collagen (black) in 10mM sodium phosphate buffer (pH 7.0) (solid), in 10mM sodium phosphate pH 2.6 (dashed), and 10mM sodium borate buffer pH 10.0 (dotted).
Comparisons of “native” and “denatured” polyproline spectra
Attempts were made to denature polyproline using various physical and chemical methods to distinguish its “native” PPII spectra from that of a “denatured” PPII structure. Because polyproline is not stabilized by any intramolecular backbone hydrogen-bonds (although it can form hydrogen bonds of its backbone carbonyl groups with solvent), its conformation is for the most part dictated by the stereochemical restrictions imposed by the proline rings, which result in it occupying a narrowly defined region of the Ramachandran plot.24 As a consequence, most attempts at denaturation had little effect on the spectrum as they did not interrupt any intramolecular interactions. Changes in pH had virtually no effect (Fig. 1). Not surprisingly, treatment with the reducing agent dithiothreitol (DTT) did not affect the spectrum [Fig. 2(a)], as polyproline contains no disulfides to be reduced. Treatment with the chaotropic agent 4M urea (a high enough concentration to usually either fully or partially unfold most globular proteins) again produced virtually no change in shape or relative magnitudes of the 228 and 206 peaks at room temperature [Fig. 2(a)], and even 1% of the denaturing detergent SDS did not appear to have an effect [Fig. 3]. Thermal effects were very modest: at pH 7.0 there was very little effect on the spectrum (a slight decrease in the 206 peak, accompanied by a proportionately similar small increase in the peak at 185, with no change in the 228 peak) [Fig. 4(a)] (although, consistent with the lack of change in shape and peak positions, even these slight apparent decreases could be due to loss of material at high temperatures (perhaps precipitation), as indicated by the corresponding HT curves.
Figure 2.
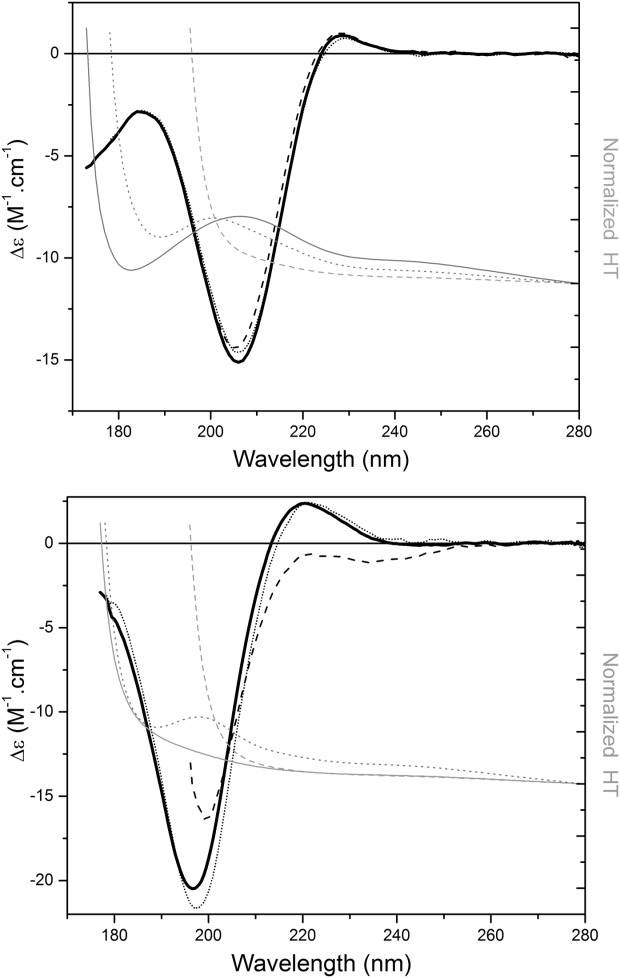
The effects of treatment with DTT and a chaotropic agent. SRCD spectra (in black) of (a) polyproline and (b) collagen in aqueous solution (solid), incubated with 5 mM DTT (dotted), and with 4M urea (dashed). The corresponding HT curves (in gray) show the wavelength cutoff values for the urea-containing samples are at around 198nm, but that the negative peaks at around 200 nm can be accurately measured.
Figure 3.
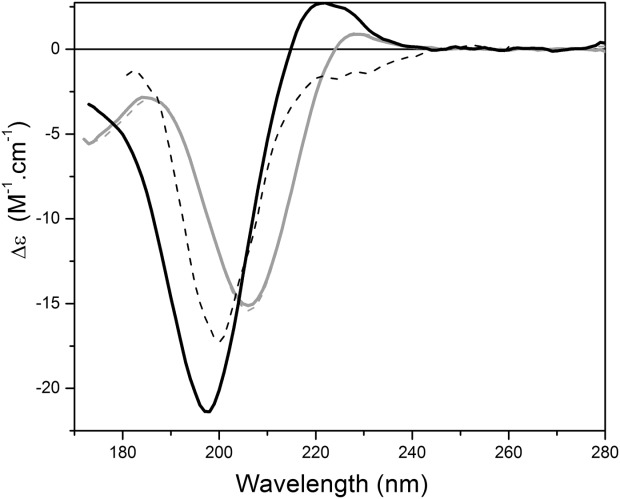
The effects of treatment with a denaturing detergent. SRCD spectra of polyproline (gray) and collagen (black) in aqueous solution without (solid) and with 0.1% SDS (dashed).
Figure 4.
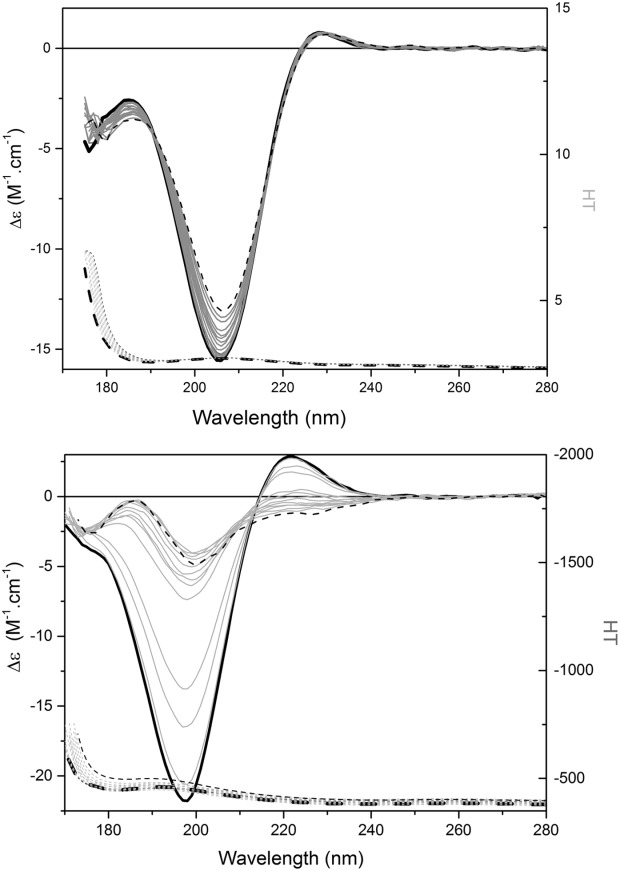
The effects of thermal unfolding. SRCD spectra of (a) polyproline and (b) collagen, at temperatures ranging from 10 to 85°C in steps of 5°C. Black solid lines indicate the spectra for 10°C, dashed for 85°C, and the gray spectra are for the intermediate temperatures. The corresponding HT curves are shown in the lower part of each panel.
Taken together, these results suggest that the polyproline structure (and thus its spectrum) is robust over a wide range of potentially denaturing conditions. This is likely because the polypeptide in its native conformation does not contain any backbone hydrogen bonds which can be disrupted, and because the secondary structure geometry is effectively defined by the steric constraints of the polyproline rings. However, the spectrum of polyproline may not be a good exemplar for the “PPII” spectra in typical proteins, as its peaks are present at wavelengths unrepresentative of those for peptide bonds containing amino acids, and because its structure is unable to be significantly “denatured”. Nevertheless, the native polyproline spectrum will be useful as an addition to spectral reference data sets for those proteins which contain stretches of polyprolines.
Comparisons of “native” and “denatured” collagen spectra
In collagen the majority of the peptide bonds involve amino acids, therefore the transitions of its chromophores tend to occur at energies more typical of those found in soluble proteins (Fig. 1). It also adopts backbone phi, psi angles that tend to lie in the same region of the Ramachandran plot as polyproline PPII helices and hence its spectral characteristics may be more suitable in reference datasets for empirical calculations of PPII content in proteins than those of polyproline itself.
Collagen also has the advantage of “unfolding” under extremes of conditions, thus enabling a clear comparison of a native PPII spectrum and an unfolded spectrum for the same polypeptide. It has backbone hydrogen bonds stabilizing its secondary structural features which are susceptible to breakage in the denatured state, so spectra under different conditions should enable us to directly identify the differences between PPII and unfolded or disordered secondary structural spectral features. Like polyproline, pH had little effect on the collagen spectrum (Fig. 1), and even breaking of the disulfide bonds [Fig. 2(b)] had only minimal spectral effects, which again is relatively unsurprising as soluble collagens only contain ∼0.1% cysteine residues. On the other hand, the effect of urea is significant [Fig. 2(b)], and produces a disrupted and unfolded structure due to chaotropic interactions. The 176 nm peak cannot be monitored due to the high absorbance of the urea molecules [evident from the HT curves in Fig. 2(b)], although, unlike conventional CD, SRCD can monitor the effect on the negative peak ∼197 nm in this denaturant. Under these conditions, this peak red shifts to around 202 nm and decreases in magnitude, and the positive 220 nm peak effectively disappears. In SDS [Fig. 3(b)], collagen also completely loses the positive peak above ∼220 nm and gains a peak at around 185 nm, whilst the 197 nm peak red shifts and decreases in a similar manner to the spectrum produced by the urea denaturation, despite the underlying mechanism of interruption being different. Hence the characteristic spectrum of “denatured” collagen appears to have a red shifted negative peak around 200 nm and no positive peak above 200 nm.
Upon thermal denaturation, a series of spectral changes occur [Fig. 4(b)]: there is a gradual decrease in magnitude and red shift of the 197 nm peak, a parallel loss of the 220 nm peak, and an appearance of a peak at 185 nm, producing a final spectrum that again bears strong resemblance to the SDS- and urea-denatured collagen spectra (Fig. 5). The thermal unfolding changes occur progressively, starting at relatively low temperatures, with a sigmoidal temperature unfolding curve (data not shown) that is typical of most proteins. The thermal profiles for collagen in H2O and D2O are similar, except that the transition is shifted to a slightly lower temperature in D2O, reflective of the differences in energies required to break hydrogen- and deuterium-containing backbone hydrogen bonds. This process results in the formation of disordered structures without significant amounts of backbone hydrogen bonds. Interestingly, at the high temperatures and indeed in the chemical denaturants, the position of the major negative band looks more similar to that in the polyproline spectra (which may be understandable if the unfolding involves breaking of the hydrogen bonds, which maintain the secondary structure and hence a change to the energetics of the π → π∗ transition). The one spectral feature that does appear to be dramatically different for all denatured collagen samples from that of both polyproline and collagen native structures is the complete absence of the positive peak in the 220–228 nm region (Fig. 5), suggesting that the presence of this peak could be diagnostic for a PPII structure, and distinct from an unfolded protein spectrum. It is not a spectral feature normally found for helical or sheet structures, nor indeed in other unfolded or natively disordered protein structures (as shown in Refs. 16,25,26), which otherwise bear a strong resemblance to the unfolded collagen spectra. Together these results suggest that the presence of the positive peak in the region of 220–228 nm is the most diagnostic for the PPII structure, and that the negative peak at ∼197 nm (as opposed to 208 nm) is most diagnostic of the unfolded state for an amino-acid containing polypeptide.
Figure 5.
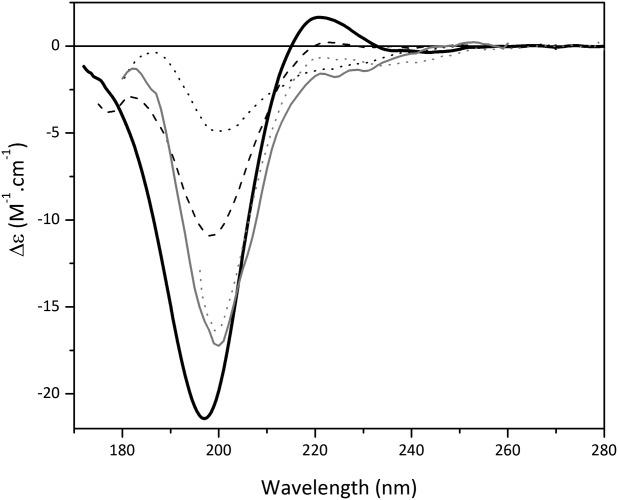
Overlay of spectra of “native” collagen spectrum with collagen “denatured” by various treatments. Untreated collagen (solid black) at 25°C, collagen treated with 4M urea (dotted gray), 0.1% SDS (solid gray), and higher temperatures (35°C—dashed black, 85°C—dotted black).
Discussion
In this study, we have shown that polyproline and collagen, two polypeptides that adopt phi, psi angles in regions of the Ramachandran plot described as PPII structures, produce very similar CD spectra, except that the polyproline spectrum is red-shifted with respect to the collagen spectrum. This is likely due to the different transition energies of imino and amino acid-containing peptide bonds. Hence we conclude that for spectral representations of PPII structures in typical proteins dominated by amino acid peptide bonds, the collagen spectrum would be a more suitable one for inclusion in reference data sets, as most proteins are dominated by amino acid peptide bonds, but that addition of the polyproline spectrum as an alternative PPII would also be of benefit for the analysis of those proteins that have significant stretches of proline residues (often present in SH3 intermolecular interaction domains12). In this study, we have also shown that collagen can be denatured by both chemical and physical treatments, with each producing characteristic spectra that have features similar to those found in the spectra of proteins that are natively unfolded (IDPs), but which differ from the PPII spectra of native collagens (and polyproline). Most notably, when collagen is unfolded, it loses the characteristic positive peak located at ∼220 nm, and exhibits minor red-shift changes in the peak positions of the other transitions. We suggest that the 220 nm positive peak and the location of the negative peak in the region around 200 nm, is diagnostic for PPII structures (as opposed to unfolded/disordered structures which tend to have small negative peaks at around 220 nm and large negative peaks at ∼195 nm). All of these peaks are most clearly observed in the spectra of proteins and peptides that lack ordered secondary structures. In proteins with high contents of regular secondary structures, the intense negative peaks at 222 and 208 nm make the visual identification of the small positive PPII peak difficult. Nevertheless, inclusion of this information is important for empirical deconvolution procedures, where the influences of small peaks produce significant effects on the overall analyses.
To date, the only reference data sets that have separately identified PPII and unordered structures8 for use in empirical analyses of secondary structures have done so by identifying “PPII” components in crystal structures as being any two consecutive residues with phi, psi angles in the appropriate region of the Ramachandran plot; the remainder of the protein not in this or helical, sheet or turn structures is then assigned as being disordered. When these contributing PPII components are extracted mathematically,27 the resulting spectrum for this secondary structure type is very similar to that of the collagen spectrum produced in the present study, but with both the negative and positive peaks being slightly shifted, at 195 and 215nm, respectively, although their magnitudes were very similar to those of the collagen peaks seen here. However, the remaining “disordered” spectrum after removal of the PPII contributions had an appearance very much like that of a beta sheet component, with a weak positive band at 198 nm and a weak negative band at 219 nm. This is very different from any of the denatured spectra in this study and from the spectra of designed disordered,16 natively disordered25,26 and other denatured protein spectra.15 Consequently, addition of the native polyproline and collagen spectra, and the denatured collagen spectra as representative of PPII and unfolded spectra, respectively, to existing reference data sets used for empirical secondary structural analyses could provide alternative bases for analyses of proteins containing either of these types of features.
In summary, this study has addressed existing ambiguities regarding the relative spectral properties of PPII and unordered structures, and produced well-defined reference spectra for these types of structures that should improve analyses of CD spectra.
Materials and Methods
Materials
Poly-l-proline (MW 1,000–10,000, Sigma-Aldrich) and bovine type II (soluble) collagen (MD Bioproducts, USA) were used without further purification. All buffers and chemicals were analytical grade.
Synchrotron radiation circular dichroism spectroscopy
The SRCD spectra of polyproline and collagen were collected at beamline 4B8 at the Beijing Synchrotron Radiation Facility (BSRF) in Beijing, China, at the CD1 beamline at the Institute for Storage Ring Facilities (ISA) in Aarhus, Denmark, at the CD12 beamline at the ANKA Synchrotron in Karlsruhe, Germany and at the DISCO beamline at the Soleil Synchrotron in France. In general, at least three repeat scans for each sample (and its cognate baseline) were measured at 25°C over the wavelength range from 280 to 170 nm, using an interval of 1 nm and a dwell time of 2s, in either Suprasil quartz cells (Hellma, UK) or specially designed calcium chloride cells28 with pathlengths ranging from 13.1 to 100 µm. Collagen concentrations ranged from 0.2 to 1.0mg/mL, and polyproline from 0.8 to 1.9mg/mL.
CD tools software29 was used for data processing: the triplicate measurements were averaged, the averaged baseline spectra subtracted from the averaged sample spectra, the net spectrum smoothed with a Savitsky–Golay filter, the spectrum calibrated against a spectrum of the spectroscopic standard camphorsulfonic acid (CSA) obtained at the beginning of each synchrotron run and when appropriate, during each beamfill for synchrotrons not in top-up mode. Final processed spectra were expressed in delta epsilon units, using mean residue weights of 94.5 and 110 for collagen and polyproline, respectively. High tension (HT) spectra (which are essentially pseudo-absorbance spectra) were collected at the same time as the SRCD spectra to further monitor the state of the proteins.
Thermal denaturation
The thermal unfolding patterns of collagen and polyproline were monitored over the set temperature range from 10 to 85°C, in steps of either 5°or 10° C, allowing 5 min for equilibration prior to measurements at each step. For each temperature, the first and the last scans were compared to confirm that the sample had reached equilibrium prior to the measurement being made. The actual temperature in the sample cell was calibrated versus set temperature using a probe inserted into a cell that did not contain sample.
Chemical denaturation
To examine the spectral properties under denaturing conditions produced by a chaotropic agent, a stock solution of urea (8M) was prepared in 10mM sodium phosphate (pH 7.0) and added to the polyproline and collagen samples, producing a final concentration of 4M urea. To examine the effects of detergent denaturation, proteins were incubated in 1% (for polyproline) or 0.1% (for collagen) sodium dodecyl sulphate (SDS, from Sigma Aldrich) prior to examination. To evaluate the spectral changes in a reducing environment, samples were incubated with and without 5 mM of dithiothreitol (DTT). To assess the effect of pH on the spectra of the proteins, aliquots of polyproline (0.45 mg/mL) and collagen (0.20mg/mL) were incubated in 10mM sodium phosphate (pH 2.6), 10 mM sodium phosphate (pH 7.0), or 10mM sodium borate (pH 10.0) buffers.
Deposition of spectra
SRCD spectral and metadata for polyproline and native and disordered collagens have been deposited as entries CD0004552000, CD0004553000, CD0004554000, CD0004555000, CD0004556000, and CD0004557000 in the Protein Circular Dichroism Data Bank (PCDDB) located at: http://pcddb.cryst.bbk.ac.uk,30 and will be released upon publication. They have been added to the SP175 reference dataset6 to form the SDP190 reference dataset, which (following publication) will be available for use at the DichroWeb secondary structure analysis server.31
Acknowledgments
We thank Dr. R.W. Janes from Queen Mary University of London for help with some of the data collection and for helpful discussions.
References
- Whitmore L, Wallace BA. Protein secondary structure analyses from circular dichroism spectroscopy: methods and reference databases. Biopolymers. 2008;89:392–400. doi: 10.1002/bip.20853. [DOI] [PubMed] [Google Scholar]
- Van Stokkum IHM, Spoelder HJW, Bloemendal M, Van Grondelle R, Groen FCA. Estimation of protein secondary structure and error analysis from CD spectra. Anal Biochem. 1990;191:110–118. doi: 10.1016/0003-2697(90)90396-q. [DOI] [PubMed] [Google Scholar]
- Compton LA, Johnson WC., Jr Analysis of protein circular dichroism spectra for secondary structure using a simple matrix multiplication. Anal Biochem. 1986;155:155–167. doi: 10.1016/0003-2697(86)90241-1. [DOI] [PubMed] [Google Scholar]
- Sreerema N, Woody RW. A self-consistent method for the analysis of protein secondary structure from circular dichroism. Anal Biochem. 1993;209:32–44. doi: 10.1006/abio.1993.1079. [DOI] [PubMed] [Google Scholar]
- Andrade MA, Chacón P, Merelo JJ, Morán F. Evaluation of secondary structure of proteins from UV circular dichroism using an unsupervised learning neural network. Protein Eng. 1993;6:383–390. doi: 10.1093/protein/6.4.383. [DOI] [PubMed] [Google Scholar]
- Lees JG, Miles AJ, Wien F, Wallace BA. A reference database for circular dichroism spectroscopy covering fold and secondary structure space. Bioinformatics. 2006;22:1955–1962. doi: 10.1093/bioinformatics/btl327. [DOI] [PubMed] [Google Scholar]
- Abdul-Gader A, Miles AJ, Wallace BA. A reference dataset for the analyses of membrane protein secondary structures and transmembrane residues using circular dichroism spectroscopy. Bioinformatics. 2011;27:1630–1636. doi: 10.1093/bioinformatics/btr234. [DOI] [PubMed] [Google Scholar]
- Sreerama N, Venyaminov SY, Woody RW. Estimation of protein secondary structure from CD spectra: inclusion of denatured proteins with native protein in the analysis. Anal Biochem. 2000;287:243–251. doi: 10.1006/abio.2000.4879. [DOI] [PubMed] [Google Scholar]
- Chang CT, Wu CS, Yang JT. Circular dichroic analysis of protein conformation—inclusion of beta-turns. Anal Biochem. 1978;91:13–31. doi: 10.1016/0003-2697(78)90812-6. [DOI] [PubMed] [Google Scholar]
- Dunker AK, Brown CJ, Lawson JD, Iakoucheva LM, Obradović Z. Intrinsic disorder and protein function. Biochemistry. 2002;41:6573–6582. doi: 10.1021/bi012159+. [DOI] [PubMed] [Google Scholar]
- Stapley BJ, Creamer TP. A survey of left-handed polyproline II helices. Protein Sci. 1999;8:587–595. doi: 10.1110/ps.8.3.587. [DOI] [PMC free article] [PubMed] [Google Scholar]
- Adzhubei AA, Sternberg MJ, Makarov AA. Polyproline-II helix in proteins: structure and function. J Mol Biol. 2013;425:2100–2132. doi: 10.1016/j.jmb.2013.03.018. [DOI] [PubMed] [Google Scholar]
- Morgan AA, Rubenstein E. Proline: the distribution, frequency, positioning, and common functional roles of proline and polyproline sequences in the human proteome. PLoS ONE. 2013;8:e53785. doi: 10.1371/journal.pone.0053785. [DOI] [PMC free article] [PubMed] [Google Scholar]
- Shi Z, Olson CA, Rose GD, Baldwin RL, Kallenbach NR. Polyproline II structure in a sequence of seven alanine residues. Proc Natl Acad Sci USA. 2002;99:9190–9195. doi: 10.1073/pnas.112193999. [DOI] [PMC free article] [PubMed] [Google Scholar]
- Matsuo K, Sakurada Y, Yonehara R, Kataoka M, Gekko K. Secondary structure analysis of denatured proteins by vaccum ultraviolet circular dichroism spectroscopy. Biophys J. 2007;92:4088–4098. doi: 10.1529/biophysj.106.103515. [DOI] [PMC free article] [PubMed] [Google Scholar]
- Wallace BA. Protein characterisation by synchrotron radiation circular dichroism spectroscopy. Q Rev Biophys. 2009;42:317–370. doi: 10.1017/S003358351000003X. [DOI] [PubMed] [Google Scholar]
- Miles AJ, Wallace BA. Synchrotron radiation circular dichroism spectroscopy of proteins and applications in structural and functional genomics. Chem Soc Rev. 2006;35:39–51. doi: 10.1039/b316168b. [DOI] [PubMed] [Google Scholar]
- Mandal R, Holzwarth G. Ultraviolet circular dichroism of polyproline and oriented collagen (erratum) Biopolymers. 1975;14:1313. [Google Scholar]
- Bhatnagar RS, Gough CA. Circular dichroism of collagen and related polypeptides. In: Faasman GD, editor. “Circular dichroism and the conformational analysis of biomolecules”. New York: Plenum Press; 1996. [Google Scholar]
- Jenness DD, Sprecher C, Johnson WC., Jr Circular dichroism of collagen, gelatine and poly(proline) II in the vacuum ultraviolet. Biopolymers. 2004;15:513–521. doi: 10.1002/bip.1976.360150308. [DOI] [PubMed] [Google Scholar]
- Greenfield NJ. Using circular dichroism spectra to estimate protein secondary structure. Nat Prot. 2007;1:2876–2890. doi: 10.1038/nprot.2006.202. [DOI] [PMC free article] [PubMed] [Google Scholar]
- Cascio M, Gogol E, Wallace BA. The secondary structure of gap junctions: influence of isolation methods and proteolysis. J Biol Chem. 1990;265:2358–2364. [PubMed] [Google Scholar]
- Tiffany ML, Krimm S. Effect of temperature on the circular dichroism spectra of polypeptides in the extended state. Biopolymers. 1972;11:2309–2316. doi: 10.1002/bip.1972.360111109. [DOI] [PubMed] [Google Scholar]
- Horng JC, Raines RT. Stereoelectronic effects on polyproline conformation. Protein Sci. 2006;15:74–83. doi: 10.1110/ps.051779806. [DOI] [PMC free article] [PubMed] [Google Scholar]
- Lopes JLS, Orcia D, Araujo APU, DeMarco R, Wallace BA. Folding factors and partners for the intrinsically disordered protein micro-exon gene 14 (MEG-14) Biophys J. 2013;104:2512–2520. doi: 10.1016/j.bpj.2013.03.063. [DOI] [PMC free article] [PubMed] [Google Scholar]
- Moore B, Miles AJ, Guerra-Giraldez C, Simpson P, Iwata M, Wallace BA, Matthews SJ, Smith DF, Brown KA. Structural basis of molecular recognition of the leishmania small hydrophilic endoplasmic reticulum-associated protein (SHERP) at membrane surfaces. J Biol Chem. 2011;286:9246–9256. doi: 10.1074/jbc.M110.130427. [DOI] [PMC free article] [PubMed] [Google Scholar]
- Sreerama N, Woody RW. Poly(pro)II helices in globular proteins: Identification and circular dichroism analysis. Biochemistry. 1994;33:10022–10025. doi: 10.1021/bi00199a028. [DOI] [PubMed] [Google Scholar]
- Wien F, Wallace BA. Calcium fluoride micro cells for synchrotron radiation circular dichroism spectroscopy. Appl Spectrosc. 2005;59:1109–1113. doi: 10.1366/0003702055012546. [DOI] [PubMed] [Google Scholar]
- Lees JG, Smith B, Wien F, Miles A, Wallace BA. CDtool—an integrated software package for circular dichroism spectroscopic data processing, analysis, and archiving. Anal Biochem. 2004;332:285–289. doi: 10.1016/j.ab.2004.06.002. [DOI] [PubMed] [Google Scholar]
- Whitmore L, Woollett B, Miles AJ, Klose DP, Janes RW, Wallace BA. PCDDB: the protein circular dichroism data bank, a repository for circular dichroism spectral and metadata. Nucleic Acids Res. 2011;39:D480–D486. doi: 10.1093/nar/gkq1026. [DOI] [PMC free article] [PubMed] [Google Scholar]
- Whitmore L, Wallace BA. DICHROWEB, an online server for protein secondary structure analyses from circular dichroism spectroscopic data. Nucleic Acids Res. 2004;32:W668–W673. doi: 10.1093/nar/gkh371. [DOI] [PMC free article] [PubMed] [Google Scholar]


