Abstract
F1-ATPase (F1) is a rotary motor protein fueled by ATP hydrolysis. Although the mechanism for coupling rotation and catalysis has been well studied, the molecular details of individual reaction steps remain elusive. In this study, we performed high-speed imaging of F1 rotation at various temperatures using the total internal reflection dark-field (TIRDF) illumination system, which allows resolution of the F1 catalytic reaction into elementary reaction steps with a high temporal resolution of 72 µs. At a high concentration of ATP, F1 rotation comprised distinct 80° and 40° substeps. The 80° substep, which exhibited significant temperature dependence, is triggered by the temperature-sensitive reaction, whereas the 40° substep is triggered by ATP hydrolysis and the release of inorganic phosphate (Pi). Then, we conducted Arrhenius analysis of the reaction rates to obtain the thermodynamic parameters for individual reaction steps, that is, ATP binding, ATP hydrolysis, Pi release, and TS reaction. Although all reaction steps exhibited similar activation free energy values, ΔG‡ = 53–56 kJ mol−1, the contributions of the enthalpy (ΔH‡), and entropy (ΔS‡) terms were significantly different; the reaction steps that induce tight subunit packing, for example, ATP binding and TS reaction, showed high positive values of both ΔH‡ and ΔS‡. The results may reflect modulation of the excluded volume as a function of subunit packing tightness at individual reaction steps, leading to a gain or loss in water entropy.
Keywords: single-molecule biophysics, temperature dependence, molecular motor protein, F1-ATPase, FoF1-ATP synthase
Introduction
F1-ATPase (α3β3γ), a catalytic subcomplex of FoF1-ATP synthase, is a rotary motor protein that uses the energy from ATP hydrolysis to rotate the rotor γ subunit against the surrounding stator of the α3β3 ring.1–4 The three catalytic sites of F1 are located mainly on the β subunits at each α and β interface.5–7 The rotary motion of F1 can be visualized by optical microscopy.8–10 Upon ATP hydrolysis, F1 rotates the rotary shaft counterclockwise, generating rotary torque of 40 pN nm for thermophilic Bacillus PS3 F1 (TF1)11 and 56 pN·nm for Escherichia coli F1 (EF1).2,12–14 The mechanical work done by one γ rotation, which is estimated to be 2π × 40 = ∼240 pN nm, is comparable to the energy released from hydrolysis of ATP molecules. Therefore, F1 is extremely efficient at converting chemical energy to mechanical work, and catalysis is tightly coupled with mechanical work,11,15 which is the prominent feature of F1 among ATP-driven motor proteins.
The F1 reaction scheme has been established by single-molecule studies using TF13,16 According to the current mechanistic understanding (Fig. 1), hydrolysis or turnover of a single ATP molecule at each of the three catalytic sites, which are located 120° apart, is coupled with one revolution of the γ subunit. The rotation step size is 120°, and each step is coupled to the turnover of a single ATP molecule.11 The 120° step is further divided into 80° and 40° substeps.17,18 The 80° substep is triggered by ATP binding and ADP release,19,20 whereas the 40° substep is triggered by ATP hydrolysis and the release of inorganic phosphate (Pi).16,18,20,21 The angular positions of F1 before the 80° and 40° substeps are referred to as the ATP binding and catalytic angles, respectively.
Figure 1.
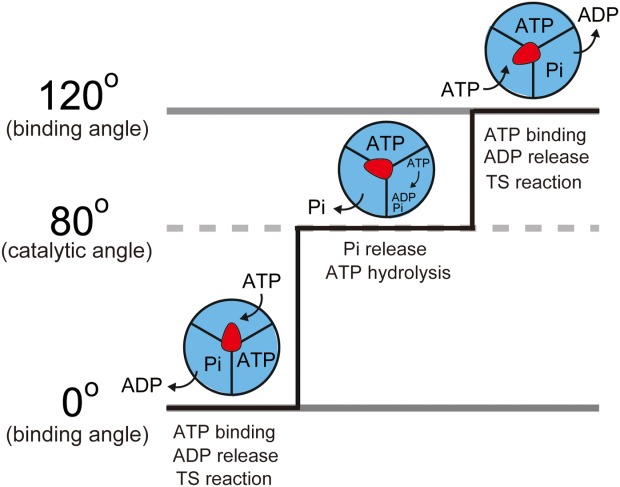
Chemo-mechanical coupling scheme of F1-ATPase. Red arrows represent the angular positions of the γ subunit. Blue areas represent the catalytic actions of the individual catalytic sites. F1 rotates 120° upon hydrolysis of 1 ATP, comprising the 80° and 40° substeps. The 80° substep is driven by ATP binding, ADP release, and the temperature-sensitive (TS) reaction, and the 40° substep is driven by ATP hydrolysis and Pi release.
The scheme above was obtained at room temperature (∼23°C), whereas the optimum temperature for TF1 is 75°C,22 which is higher than for other species.23,24 Recently, we observed the rotary motion of TF1 at various temperatures.25,26 At temperatures below 9°C, we detected the presence of a new reaction intermediate as a clear intervening pause before the 80° substep (Fig. 1).25,26 The rate constant for this step was remarkably sensitive to temperature and increased by a factor of 6–19 for every 10°C rise in temperature (Q10 = 6–19),25,26 which is unusually high compared to conventional Q10 values of ∼2. Moreover, as expected from the high Q10 value, which reflects a high activation energy barrier, this reaction step involves a large conformational change that presumably contributes to torque generation.27 Hereafter, this step is referred to as the temperature-sensitive (TS) reaction.
Except for the TS reaction, the temperature dependence of the reaction rate has not been examined at the resolution of elementary reaction steps, for example, hydrolysis and product release, although some previous studies attempted to observe F1 rotation at various temperatures.25,26,28–30 In the present study, we performed high-speed imaging of F1 rotation at various temperatures using the recently developed total internal reflection dark-field (TIRDF) illumination system,31 which allows us to monitor rotation with high spatiotemporal resolution (∼5 nm and 72 µs). Herein, we present the thermodynamic parameters for the elementary reaction steps, which represent a major contribution toward a more detailed understanding of the molecular mechanism of F1 rotary catalysis.
Results
Temperature-dependence of TF1 rotation
We observed the rotation of TF1 with an 80-nm gold colloid probe at saturating ATP (200 µM) with a TIRDF illumination system.31 The viscous friction exerted by the gold colloid on the γ subunit was low enough to allow full-speed rotation of F117 When observed between 4 and 33°C, F1 showed continuous counterclockwise rotation [Fig. 2(a)]. Therefore, we measured the rotational rate of F1 at various temperatures [Fig. 2(b,c)]. Although the previously reported rotational rate of F1 using magnetic beads (ϕ = ∼200 nm) was limited by viscous friction from the probe at room temperature (>9°C),25 the rotational rate measured in this study was not affected by viscous friction but was determined by the reaction steps comprising ATP hydrolysis, for example, hydrolysis and product release. In support of this conclusion, the rotational rate of F1 was close to the estimated rotational rate, which is onethird of the ATPase activity in bulk solution because three ATPs are hydrolyzed for every turn; a previous study using magnetic beads showed a large difference between the two values around room temperature [Fig. 2(b,c)].25
Figure 2.
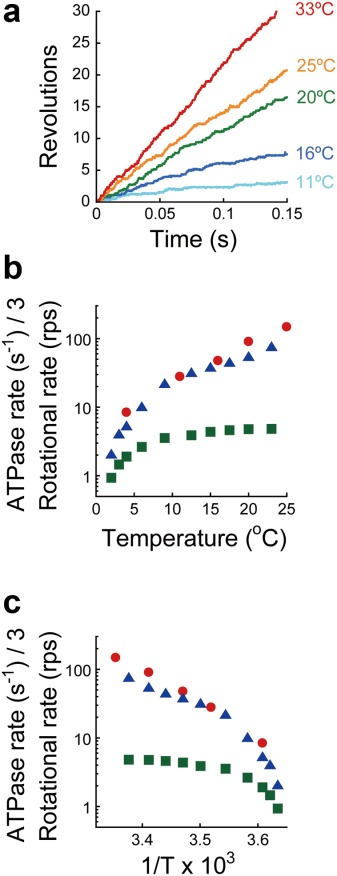
Rotation of F1-ATPase at various temperatures. (a) Time course of F1 rotation in the presence of 200 µM ATP at 11°C (cyan), 16°C (blue), 20°C (green), 25°C (orange), and 33°C (red). The gold colloidal bead (ϕ€ = 80 nm) was used as the rotational probe. (b) Temperature dependence of the rotational rate at saturating ATP (200 µM). The rotational rates determined in the rotational assay using a gold colloidal bead (red) are plotted together with our previous result using a magnetic bead (green) and with the rate in bulk solution estimated as onethird of the ATP hydrolysis rate (blue).25 (c) Arrhenius plots of traces in Figure 2(b).
Rotational substeps at saturating ATP concentration
We were able to clearly resolve individual steps in F1 rotation at 27,000 frames s−1 using the 80 nm bead even at saturating ATP (200 µM). Although we did not previously detect obvious substeps in the rotation assay at 200 µM ATP when recording below 8000 frames s−1,17 we found molecules in this study that exhibited distinct 80° and 40° substeps at room temperature after careful and thorough observations [Fig. 3(a,b)], which is similar to observations made by high-speed imaging of EF1.32 To identify the rate-limiting reaction of the 80° substep, we analyzed the dwell time prior to the 80° substep at various temperatures. The dwell time distribution exhibited strong temperature dependence [Fig. 3(c)]. By fitting the distribution to an exponential function, y = C·exp(−k·t), the rate constants at 16, 20, 25, and 33°C were determined to be 287, 1098, 1654, and 5540 s−1 [Fig. 3(c)], which are much larger than the rate constants for binding 200 µM ATP estimated from the previous study.25 In addition, these fits gave Q10 = 6.0 [Fig. 4(a)], which is consistent with previous studies of the TS reaction at low temperatures.25,26 Thus, we confirmed that the rate-limiting step of the dwell prior to the 80° substep is the TS reaction. The rate-limiting reactions of the 40° substep at saturating ATP were identified as ATP hydrolysis and Pi release in our previous study.17,18,20 We analyzed the dwell time before the 40° substep, which includes the waiting times for both ATP hydrolysis and Pi release. The dwell-time distribution exhibited a typical convex curve indicative of a sequential reaction, y = C(exp(−k1·t) −exp(−k2·t)), which yielded k1 and k2 values for 16, 20, 25, and 33°C of 420 and 2085 s−1, 491 and 2500 s−1, 710 and 3507 s−1, and 1332 and 5009 s−1, respectively [Fig. 3(d)]. Our previous study suggested that the slower step corresponds to ATP hydrolysis while the faster step represents Pi release.33 Accordingly, the Q10 factors of ATP hydrolysis and Pi release were 1.9 and 1.6, respectively [Fig. 4(a,b)], which are consistent with the expectation from previous studies.25,26,28,29
Figure 3.
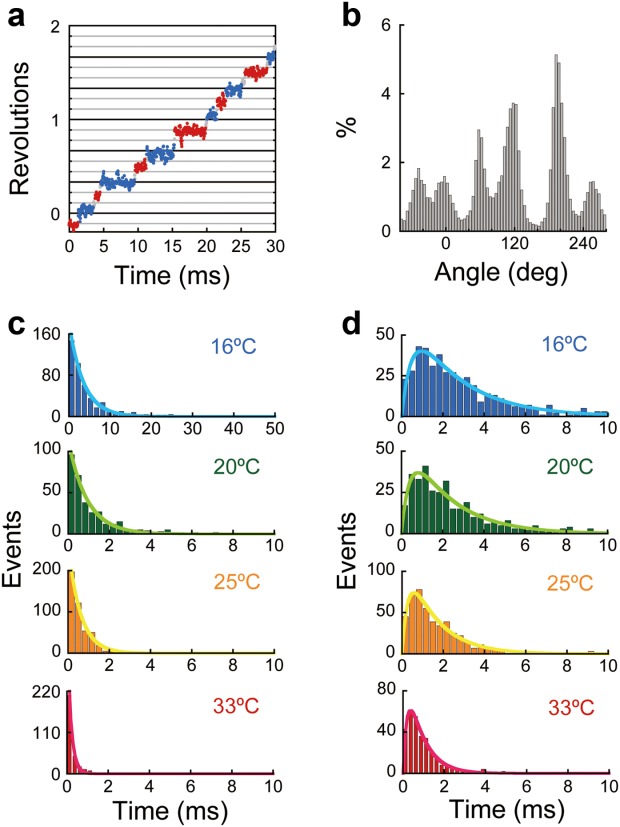
Dwell time analysis of F1-ATPase. (a) Time course of the rotation of F1 in the presence of 200 µM ATP at 16°C. The pauses before the 80° or 40° substeps are shown as blue or red, respectively. (b) Histogram of angular positions from the time course shown in Figure 3(a). (c) Histograms of the dwell times of the pause before the 80° substep at 16°C (blue), 20°C (green), 25°C (orange), and 33°C (red). Curves were plotted using a first-order reaction scheme, y = C·exp(−k·t), where k (16°C) = 287 s−1, k (20°C) = 1098 s−1, k (25°C) = 1654 s−1, and k (33°C) = 5540 s−1. (d) Histograms of the dwell times of the pause before the 40° substep at 16°C (blue), 20°C (green), 25°C (orange), and 33°C (red). Curves were plotted using a sequential reaction scheme, y = C·(exp(−k1·t) −exp(−k2·t)), where k1 (16°C) = 420 s−1, k1 (20°C) = 491 s−1, k1 (25°C) = 710 s−1, k1 (33°C) = 1332 s−1, k2 (16°C) = 2085 s−1, k2 (20°C) = 2500 s−1, k2 (25°C) = 3507 s−1, and k2 (33°C) = 5009 s−1.
Figure 4.
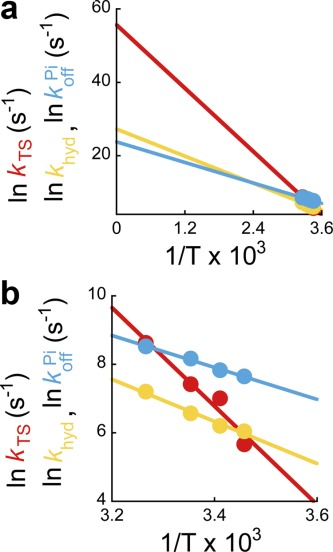
Arrhenius plots of reaction rates. (a) Arrhenius plots of the rates of the temperature-sensitive (TS) reaction (red), ATP hydrolysis (yellow), and Pi release (cyan) determined from Figure 3. Solid lines represent linear fits. (b) Magnification of Figure 4(a).
Arrhenius analysis of reaction rates
The Arrhenius plots of the individual reaction rates are shown in Figure 4(a,b). All Arrhenius plots fit well to linear functions, which allowed determination of the transition-state thermodynamic parameters, ΔG‡, ΔH‡, and TΔS‡, for individual reaction steps (Fig. 5). The slope of the TS reaction was apparently steeper than the slopes of other elementary steps, that is, ATP hydrolysis and Pi release, giving ΔH‡ values of 121 kJ mol−1 for the TS reaction, 51 kJ mol−1 for ATP hydrolysis, and 39 kJ mol−1 for Pi release. In our previous study, the ΔH‡ for ATP binding at 200 µM ATP was determined to be 107 kJ mol−1, which is almost the same as that of the TS reaction.25 The y intercept of the TS reaction was apparently greater than those of the other elementary steps; at 25°C, TΔS‡ values are 67 kJ mol−1 for the TS reaction, −5.4 kJ mol−1 for ATP hydrolysis, and −14 kJ mol−1 for Pi release. As was observed for ΔH‡, the previously determined TΔS‡ of ATP binding at 200 µM ATP, 54 kJ mol−1, was similar to that of the TS reaction.25 Thus, the activation free energy, ΔG‡ = ΔH‡ −TΔS‡, was calculated to be 54 kJ mol−1 for the TS reaction, 56 kJ mol−1 for ATP hydrolysis, and 53 kJ mol−1 for Pi release. Here, we note that ΔG‡ determined in this study agrees with calculations from computational simulations,34,35 supporting the validity of the computational calculations applied to the F1 catalytic mechanism.
Figure 5.
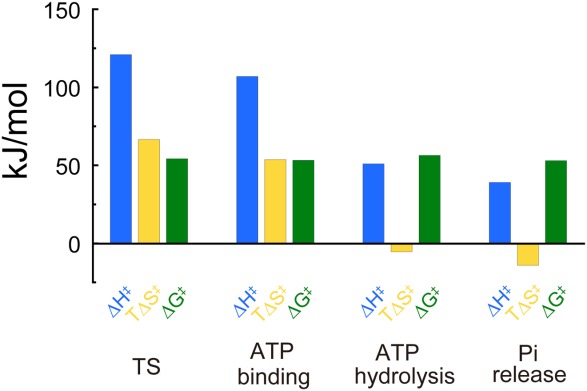
Thermodynamic parameters. Thermodynamic parameters at 25°C. ΔG‡ (green), ΔH‡ (blue), and TΔS‡ (yellow) for the temperature-sensitive (TS) reaction, ATP hydrolysis, and Pi release were calculated from Figure 4(a,b), while that for ATP binding at 200 µM ATP was calculated from Watanabe et al.25
Discussion
In this study, we assessed the temperature-dependence of the reaction rates of individual steps of TF1 ATP hydrolysis. For comparison, we reanalyzed the Arrhenius plot of the bulk phase ATPase rate shown in Figure 2(c).25 The Arrhenius plot showed a breakpoint around 9°C [Fig. 2(c)], which suggests a change in rate-limiting step. A similar phenomenon was observed for F1 from bovine mitochondria36 and Escherichia coli.37 From the Arrhenius plot, ATPase rates below or above 9°C are in good agreement with the rate constants of the TS reaction or ATP hydrolysis, respectively, as determined from single-molecule assays (Fig. 3). Thus, the comparison shows that the rate-limiting process of F1 rotary catalysis is temperature dependent; that is, the TS reaction dominates the catalytic turnover rate of F1 below 9°C while ATP hydrolysis dominates above 9°C.
We estimated the rotational rate of TF1 under physiological conditions, that is, 65°C. According to the Arrhenius plot [Fig. 4(a)], the rate constant for ATP hydrolysis at 65°C, where it is the rate-limiting step for rotation is 8.6 × 10³ s−1. The rate constant for rotation of TF1 under physiological conditions is thus estimated to be (8.6 × 10³)/3 = 2.9 × 10³ s−1 based on the coupling ratio of 3 ATPs per turn. The physiological rate constant for EF1 rotation is also estimated to be ∼103 s−1 from the previous study,29 which shows good agreement with that of TF1. Accordingly, it is highly probable that the physiological rotational rate constant is inherent to F1 regardless of species.
The activation free energy determined in this study, 53–56 kJ mol−1, is almost the same among elementary reaction steps and shows good agreement with that estimated from the bulk phase ATPase activity of EF1.29,38 Therefore, the activation free energy is inherent to F1, regardless of elementary reaction step or species. The phenomenon that the activation free energy is equal among elementary reaction steps is a well-known feature of optimally evolved enzymes.39,40 Recent NMR studies elucidated that conformational fluctuations of an enzyme active site occur on the time scale of catalytic turnover (<1 ms),41,42 which suggests that conformational fluctuations might constrain the catalytic turnover rate of an enzyme; alternatively, there may be no selective pressure to reduce catalytic time scales below those of conformational fluctuation. In fact, the time scales of most steps of the F1 reaction, that is, ATP hydrolysis, Pi release, and the TS reaction, are around 1 ms, which coincides with that of conformational fluctuations. Thus, F1 catalytic proficiency appears to be optimally evolved, leading to uniformity of the activation free energies among the elementary reaction steps.
Although the activation free energy was similar among the reaction steps, the contributions from the enthalpy and entropy terms differed significantly (Fig. 5). The reaction steps that occur at the ATP-binding angle (Fig. 1), that is, ATP binding and the TS reaction, exhibited high positive values of ΔH‡ and TΔS‡, while those that occur at the catalytic angle (Fig. 1), that is, ATP hydrolysis and Pi release, exhibited small positive ΔH‡ values and slightly negative TΔS‡ values. When we focus on the interaction between ATP and the catalytic site, the TΔS‡ values for ATP binding and Pi release determined in this study seem to conflict with expectations based on the crystal structure:7 hydrogen-bond formation upon ATP binding induces a negative entropy change, so its disruption upon Pi release necessarily induces a positive entropy change. Therefore, it is highly expected that the thermodynamic parameters determined in this study reflect the overall dynamics at catalytic subunits upon individual reaction steps. Here, we focus on the entropic contribution associated with subunit packing. Yoshidome et al. proposed that tight packing of F1 subunits reduces the excluded volume and leads to a large gain in water entropy while decreasing the conformational entropy of amino acid side chains.43,44 Because the entropic contribution of water molecules is substantially larger than that of the side chains,43,44 water entropy is regarded as the key factor in subunit packing. X-ray crystallography and MD simulation revealed that the subunit packing is tightened upon ATP binding and the TS reaction, while it is loosened upon ATP hydrolysis and Pi release, which results in gain or loss of water entropy, respectively.5,7,43,44 This assessment is consistent with our experimental results: entropy was gained upon ATP binding and TS reaction, but entropy was lost upon ATP hydrolysis and Pi release. Therefore, it is probable that the TΔS‡ measured in this study arises from changes in water entropy due to subunit packing. Another possible explanation is that a large-scale conformational transition involving catastrophic events such as cracking or local unfolding, termed a “proteinquake”,45,46 leads to an increase in the entropy of the transition state and, accordingly, lowers the activation barrier height.45,46 Indeed, a large-scale conformational transition of the β-subunit between the open and closed forms, termed “hinge-motion”, which is the principal power-stroke motion of the β-subunit,47–50 occurs upon ATP binding and the TS reaction at the ATP-binding angle.5,51 On the other hand, the β subunit exhibits a small-scale conformational transition, for example, a loosening of the interface between α–β subunits, upon ATP hydrolysis and Pi release at the catalytic angle.52 To discriminate between these models, we hope to simultaneously visualize the conformational change in the β subunit and the rotational motion with spatiotemporal resolution sufficient to capture cracking or local unfolding of the β conformation.
Using high-speed imaging of F1 rotation, we revealed the temperature dependence of the F1 reaction rate at the resolution of elementary reaction steps. Such information is difficult to obtain from conventional single-molecule and bulk assays due to low temporal resolution. Thus, we are convinced that the high-speed imaging performed in this study is a powerful tool for understanding the mechanism of F1 rotary catalysis and holds promise for understanding the function of other molecular machines.
The limitation to the current system is the requirement of a gold colloid rotary probe with diameter above 40 nm for visualization of the rotary motion of F1 with high temporal resolution, 72 µs. Recently, we reported that the viscous friction exerted on the rotary probe affects the reaction rate constants; the reaction rates of Pi release and the TS reaction are decelerated as the viscous friction increases.33 To determine the thermodynamic parameters under physiological (viscous friction-free) conditions, the development of a high-speed imaging system with a smaller rotary probe is highly anticipated.
Materials and Methods
Rotation assay
Wild-type F1 from thermophilic Bacillus PS3 (TF1) was prepared as previously described.16 To visualize the rotation of F1, the stator region (α3β3 subunits) was fixed to a glass surface, and a gold colloidal bead (ϕ = 80 nm) was attached to the rotor (γ-subunit) as the rotation probe. The rotation assay was carried out in a 50 mM MOPS-KOH (pH 7.0) buffer containing 50 mM KCl, 5 mM MgCl2, and 200 µM ATP. Rotating beads were observed under a custom-built laser dark-field microscope31 with a 60× objective lens. The rotation of the bead was recorded at 27,000 frames s−1 (FASTCAM 1024PCI-SE, Photoron, Japan). The temperature in the room was controlled with a room air conditioner and was monitored using a thermometer located on the sample stage of the microscope. The precision of the temperature control was ±1°C.
Acknowledgments
We thank Dr. S. Hayashi and Dr. K. Okazaki for critical discussion and A. Yukawa for technical support.
REFERENCES
- Yoshida M, Muneyuki E, Hisabori T. ATP synthase—a marvellous rotary engine of the cell. Nat Rev Mol Cell Biol. 2001;2:669–677. doi: 10.1038/35089509. [DOI] [PubMed] [Google Scholar]
- Junge W, Sielaff H, Engelbrecht S. Torque generation and elastic power transmission in the rotary FoF1-ATPase. Nature. 2009;459:364–370. doi: 10.1038/nature08145. [DOI] [PubMed] [Google Scholar]
- Weber J. Structural biology: toward the ATP synthase mechanism. Nat Chem Biol. 2010;6:794–795. doi: 10.1038/nchembio.458. [DOI] [PubMed] [Google Scholar]
- Dimroth P, von Ballmoos C, Meier T. Catalytic and mechanical cycles in F-ATP synthases. Fourth in the Cycles Review Series. EMBO Rep. 2006;7:276–282. doi: 10.1038/sj.embor.7400646. [DOI] [PMC free article] [PubMed] [Google Scholar]
- Abrahams JP, Leslie AG, Lutter R, Walker JE. Structure at 2.8 Å resolution of F1-ATPase from bovine heart mitochondria. Nature. 1994;370:621–628. doi: 10.1038/370621a0. [DOI] [PubMed] [Google Scholar]
- Cingolani G, Duncan TM. Structure of the ATP synthase catalytic complex (F1) from Escherichia coli in an autoinhibited conformation. Nat Struct Mol Biol. 2011;18:701–707. doi: 10.1038/nsmb.2058. [DOI] [PMC free article] [PubMed] [Google Scholar]
- Kabaleeswaran V, Puri N, Walker JE, Leslie AG, Mueller DM. Novel features of the rotary catalytic mechanism revealed in the structure of yeast F1 ATPase. EMBO J. 2006;25:5433–5442. doi: 10.1038/sj.emboj.7601410. [DOI] [PMC free article] [PubMed] [Google Scholar]
- Noji H, Yasuda R, Yoshida M, Kinosita K., Jr Direct observation of the rotation of F1-ATPase. Nature. 1997;386:299–302. doi: 10.1038/386299a0. [DOI] [PubMed] [Google Scholar]
- Sielaff H, Rennekamp H, Wachter A, Xie H, Hilbers F, Feldbauer K, Dunn SD, Engelbrecht S, Junge W. Domain compliance and elastic power transmission in rotary FoF1-ATPase. Proc Natl Acad Sci USA. 2008;105:17760–17765. doi: 10.1073/pnas.0807683105. [DOI] [PMC free article] [PubMed] [Google Scholar]
- Spetzler D, Ishmukhametov R, Hornung T, Day LJ, Martin J, Frasch WD. Single molecule measurements of F1-ATPase reveal an interdependence between the power stroke and the dwell duration. Biochemistry. 2009;48:7979–7985. doi: 10.1021/bi9008215. [DOI] [PMC free article] [PubMed] [Google Scholar]
- Yasuda R, Noji H, Kinosita K., Jr Yoshida M. F1-ATPase is a highly efficient molecular motor that rotates with discrete 120 degree steps. Cell. 1998;93:1117–1124. doi: 10.1016/s0092-8674(00)81456-7. [DOI] [PubMed] [Google Scholar]
- Bilyard T, Nakanishi-Matsui M, Steel BC, Pilizota T, Nord AL, Hosokawa H, Futai M, Berry RM. High-resolution single-molecule characterization of the enzymatic states in Escherichia coli F1-ATPase. Philos Trans R Soc Lond B Biol Sci. 2013;368:20120023. doi: 10.1098/rstb.2012.0023. [DOI] [PMC free article] [PubMed] [Google Scholar]
- Spetzler D, York J, Daniel D, Fromme R, Lowry D, Frasch W. Microsecond time scale rotation measurements of single F1-ATPase molecules. Biochemistry. 2006;45:3117–3124. doi: 10.1021/bi052363n. [DOI] [PMC free article] [PubMed] [Google Scholar]
- Hornung T, Ishmukhametov R, Spetzler D, Martin J, Frasch WD. Determination of torque generation from the power stroke of Escherichia coli F1-ATPase. Biochim Biophys Acta. 2008;1777:579–582. doi: 10.1016/j.bbabio.2008.04.016. [DOI] [PMC free article] [PubMed] [Google Scholar]
- Toyabe S, Okamoto T, Watanabe-Nakayama T, Taketani H, Kudo S, Muneyuki E. Nonequilibrium energetics of a single F1-ATPase molecule. Phys Rev Lett. 2010;104 doi: 10.1103/PhysRevLett.104.198103. [DOI] [PubMed] [Google Scholar]
- Watanabe R, Iino R, Noji H. Phosphate release in F1-ATPase catalytic cycle follows ADP release. Nat Chem Biol. 2010;6:814–820. doi: 10.1038/nchembio.443. [DOI] [PubMed] [Google Scholar]
- Yasuda R, Noji H, Yoshida M, Kinosita K., Jr Itoh H. Resolution of distinct rotational substeps by submillisecond kinetic analysis of F1-ATPase. Nature. 2001;410:898–904. doi: 10.1038/35073513. [DOI] [PubMed] [Google Scholar]
- Shimabukuro K, Yasuda R, Muneyuki E, Hara KY, Kinosita K., Jr Yoshida M. Catalysis and rotation of F1 motor: cleavage of ATP at the catalytic site occurs in 1 ms before 40 degree substep rotation. Proc Natl Acad Sci USA. 2003;100:14731–14736. doi: 10.1073/pnas.2434983100. [DOI] [PMC free article] [PubMed] [Google Scholar]
- Nishizaka T, Oiwa K, Noji H, Kimura S, Muneyuki E, Yoshida M, Kinosita K., Jr Chemomechanical coupling in F1-ATPase revealed by simultaneous observation of nucleotide kinetics and rotation. Nat Struct Mol Biol. 2004;11:142–148. doi: 10.1038/nsmb721. [DOI] [PubMed] [Google Scholar]
- Adachi K, Oiwa K, Nishizaka T, Furuike S, Noji H, Itoh H, Yoshida M, Kinosita K., Jr Coupling of rotation and catalysis in F1-ATPase revealed by single-molecule imaging and manipulation. Cell. 2007;130:309–321. doi: 10.1016/j.cell.2007.05.020. [DOI] [PubMed] [Google Scholar]
- Watanabe R, Noji H. Timing of inorganic phosphate release modulates the catalytic activity of ATP-driven rotary motor protein. Nat Commun. 2014;5:3486. doi: 10.1038/ncomms4486. [DOI] [PMC free article] [PubMed] [Google Scholar]
- Yoshida M, Sone N, Hirata H, Kagawa Y. A highly stable adenosine triphosphatase from a thermophillie bacterium. Purification, properties, and reconstitution. J Biol Chem. 1975;250:7910–7916. [PubMed] [Google Scholar]
- Wang ZY, Freire E, McCarty RE. Influence of nucleotide binding site occupancy on the thermal stability of the F1 portion of the chloroplast ATP synthase. J Biol Chem. 1993;268:20785–20790. [PubMed] [Google Scholar]
- Li Z, Neufeld GJ. Isolation and characterization of mitochondrial F1-ATPase from crayfish (Orconectes virilis) gills. Comp Biochem Physiol B Biochem Mol Biol. 2001;128:325–338. doi: 10.1016/s1096-4959(00)00330-4. [DOI] [PubMed] [Google Scholar]
- Watanabe R, Iino R, Shimabukuro K, Yoshida M, Noji H. Temperature-sensitive reaction intermediate of F1-ATPase. EMBO Rep. 2008;9:84–90. doi: 10.1038/sj.embor.7401135. [DOI] [PMC free article] [PubMed] [Google Scholar]
- Enoki S, Watanabe R, Iino R, Noji H. Single-molecule study on the temperature-sensitive reaction of F1-ATPase with a hybrid F1 carrying a single β(E190D) J Biol Chem. 2009;284:23169–23176. doi: 10.1074/jbc.M109.026401. [DOI] [PMC free article] [PubMed] [Google Scholar]
- Watanabe R, Noji H. Characterization of the temperature-sensitive reaction of F1-ATPase by using single-molecule manipulation. Sci Rep. 2014;4:4962. doi: 10.1038/srep04962. [DOI] [PMC free article] [PubMed] [Google Scholar]
- Furuike S, Adachi K, Sakaki N, Shimo-Kon R, Itoh H, Muneyuki E, Yoshida M, Kinosita K., Jr Temperature dependence of the rotation and hydrolysis activities of F1-ATPase. Biophys J. 2008;95:761–770. doi: 10.1529/biophysj.107.123307. [DOI] [PMC free article] [PubMed] [Google Scholar]
- Sekiya M, Nakamoto RK, Al-Shawi MK, Nakanishi-Matsui M, Futai M. Temperature dependence of single molecule rotation of the Escherichia coli ATP synthase F1 sector reveals the importance of gamma-beta subunit interactions in the catalytic dwell. J Biol Chem. 2009;284:22401–22410. doi: 10.1074/jbc.M109.009019. [DOI] [PMC free article] [PubMed] [Google Scholar]
- Sekiya M, Hosokawa H, Nakanishi-Matsui M, Al-Shawi MK, Nakamoto RK, Futai M. Single molecule behavior of inhibited and active states of Escherichia coli ATP synthase F1 rotation. J Biol Chem. 2010;285:42058–42067. doi: 10.1074/jbc.M110.176701. [DOI] [PMC free article] [PubMed] [Google Scholar]
- Ueno H, Nishikawa S, Iino R, Tabata KV, Sakakihara S, Yanagida T, Noji H. Simple dark-field microscopy with nanometer spatial precision and microsecond temporal resolution. Biophys J. 2010;98:2014–2023. doi: 10.1016/j.bpj.2010.01.011. [DOI] [PMC free article] [PubMed] [Google Scholar]
- Martin JL, Ishmukhametov R, Hornung T, Ahmad Z, Frasch WD. Anatomy of F1-ATPase powered rotation. Proc Natl Acad Sci USA. 2014;111:3715–3720. doi: 10.1073/pnas.1317784111. [DOI] [PMC free article] [PubMed] [Google Scholar]
- Watanabe R, Hayashi K, Ueno H, Noji H. Catalysis-enhancement via rotary fluctuation of F1-ATPase. Biophys J. 2013;105:2385–2391. doi: 10.1016/j.bpj.2013.09.050. [DOI] [PMC free article] [PubMed] [Google Scholar]
- Hayashi S, Ueno H, Shaikh AR, Umemura M, Kamiya M, Ito Y, Ikeguchi M, Komoriya Y, Iino R, Noji H. Molecular mechanism of ATP hydrolysis in F1-ATPase revealed by molecular simulations and single-molecule observations. J Am Chem Soc. 2012;134:8447–8454. doi: 10.1021/ja211027m. [DOI] [PubMed] [Google Scholar]
- Mukherjee S, Warshel A. Electrostatic origin of the mechanochemical rotary mechanism and the catalytic dwell of F1-ATPase. Proc Natl Acad Sci USA. 2011;108:20550–20555. doi: 10.1073/pnas.1117024108. [DOI] [PMC free article] [PubMed] [Google Scholar]
- Harris DA, Dall-Larsen T, Klungsoyr L. Studies of the kinetics of the isolated mitochondrial ATPase using dinitrophenol as a probe. Biochim Biophys Acta. 1981;635:412–418. doi: 10.1016/0005-2728(81)90039-6. [DOI] [PubMed] [Google Scholar]
- Lowry DS, Frasch WD. Interactions between beta D372 and gamma subunit N-terminus residues gamma K9 and gamma S12 are important to catalytic activity catalyzed by Escherichia coli F1Fo-ATP synthase. Biochemistry. 2005;44:7275–7281. doi: 10.1021/bi047293j. [DOI] [PubMed] [Google Scholar]
- al-Shawi MK, Parsonage D, Senior AE. Thermodynamic analyses of the catalytic pathway of F1-ATPase from Escherichia coli. Implications regarding the nature of energy coupling by F1-ATPases. J Biol Chem. 1990;265:4402–4410. [PubMed] [Google Scholar]
- Albery WJ, Knowles JR. Evolution of enzyme function and the development of catalytic efficiency. Biochemistry. 1976;15:5631–5640. doi: 10.1021/bi00670a032. [DOI] [PubMed] [Google Scholar]
- Ellington AD, Benner SA. Free-energy differences between enzyme bound-states. J Theor Biol. 1987;127:491–506. doi: 10.1016/s0022-5193(87)80145-5. [DOI] [PubMed] [Google Scholar]
- Bhabha G, Lee J, Ekiert DC, Gam J, Wilson IA, Dyson HJ, Benkovic SJ, Wright PE. A dynamic knockout reveals that conformational fluctuations influence the chemical step of enzyme catalysis. Science. 2011;332:234–238. doi: 10.1126/science.1198542. [DOI] [PMC free article] [PubMed] [Google Scholar]
- Henzler-Wildman K, Kern D. Dynamic personalities of proteins. Nature. 2007;450:964–972. doi: 10.1038/nature06522. [DOI] [PubMed] [Google Scholar]
- Yoshidome T, Ito Y, Ikeguchi M, Kinoshita M. Rotation mechanism of F1-ATPase: crucial importance of the water entropy effect. J Am Chem Soc. 2011;133:4030–4039. doi: 10.1021/ja109594y. [DOI] [PubMed] [Google Scholar]
- Yoshidome T, Ito Y, Matubayasi N, Ikeguchi M, Kinoshita M. Structural characteristics of yeast F1-ATPase before and after 16-degree rotation of the gamma subunit: theoretical analysis focused on the water-entropy effect. J Chem Phys. 2012;137:035102. doi: 10.1063/1.4734298. [DOI] [PubMed] [Google Scholar]
- Okazaki K, Koga N, Takada S, Onuchic JN, Wolynes PG. Multiple-basin energy landscapes for large-amplitude conformational motions of proteins: structure-based molecular dynamics simulations. Proc Natl Acad Sci USA. 2006;103:11844–11849. doi: 10.1073/pnas.0604375103. [DOI] [PMC free article] [PubMed] [Google Scholar]
- Miyashita O, Onuchic JN, Wolynes PG. Nonlinear elasticity, proteinquakes, and the energy landscapes of functional transitions in proteins. Proc Natl Acad Sci USA. 2003;100:12570–12575. doi: 10.1073/pnas.2135471100. [DOI] [PMC free article] [PubMed] [Google Scholar]
- Tanigawara M, Tabata KV, Ito Y, Ito J, Watanabe R, Ueno H, Ikeguchi M, Noji H. Role of the DELSEED loop in torque transmission of F1-ATPase. Biophys J. 2012;103:970–978. doi: 10.1016/j.bpj.2012.06.054. [DOI] [PMC free article] [PubMed] [Google Scholar]
- Usukura E, Suzuki T, Furuike S, Soga N, Saita E, Hisabori T, Kinosita K, Yoshida M. Torque generation and utilization in motor enzyme FoF1-ATP synthase half-torque F1 with short-sized pushrod helix and reduced ATP synthesis by half-torque FoF1. J Biol Chem. 2012;287:1884–1891. doi: 10.1074/jbc.M111.305938. [DOI] [PMC free article] [PubMed] [Google Scholar]
- Watanabe R, Okuno D, Sakakihara S, Shimabukuro K, Iino R, Yoshida M, Noji H. Mechanical modulation of catalytic power on F1-ATPase. Nat Chem Biol. 2012;8:86–92. doi: 10.1038/nchembio.715. [DOI] [PubMed] [Google Scholar]
- Arai HC, Yukawa A, Iwatate RJ, Kamiya M, Watanabe R, Urano Y, Noji H. Torque generation mechanism of F1-ATPase upon NTP binding. Biophys J. 2014;107:156–164. doi: 10.1016/j.bpj.2014.05.016. [DOI] [PMC free article] [PubMed] [Google Scholar]
- Masaike T, Koyama-Horibe F, Oiwa K, Yoshida M, Nishizaka T. Cooperative three-step motions in catalytic subunits of F1-ATPase correlate with 80 degrees and 40 degrees substep rotations. Nat Struct Mol Biol. 2008;15:1326–1333. doi: 10.1038/nsmb.1510. [DOI] [PubMed] [Google Scholar]
- Okazaki K, Takada S. Structural comparison of F1-ATPase: interplay among enzyme structures, catalysis, and rotations. Structure. 2011;19:588–598. doi: 10.1016/j.str.2011.01.013. [DOI] [PubMed] [Google Scholar]


