

Abstract
Background
Different populations of T cells are involved in the pathogenesis of allergic diseases.
Objective
We investigated changes in T-helper (Th) cell populations in patients with allergies following specific immunotherapy (SIT).
Methods
Peripheral blood mononuclear cells (PBMC) were isolated from patients with allergies who received specific immunotherapy (SIT) and those who did not (controls). We tested the ability of peptides from 93 Timothy grass (TG) proteins to induce T-cell responses (cytokine production). We used ELISPOT and staining assays for intracellular cytokines to measure production of interleukin (IL)4, IL5, IL13, interferon (IFN)γ, and IL10.
Results
Compared with PBMC from controls, PBMC from patients who received SIT produced lower levels of Th2 cytokines upon incubation with several different TG peptides. These data were used to select 20 peptides to be tested an independent cohort of 20 patients with allergies who received SIT and 20 controls. We again observed a significant decrease in production of Th2 cytokines, and an increase in production of the Th1 cytokine IFNγ, in PBMC from the validation groups. These changes correlated with improved symptoms after SIT. Immunization with this selected pool of peptides (or their associated antigens) could protect a substantial proportion of the population from TG allergy.
Conclusions
We observed a significant decrease in production of Th2 cytokines by PBMC from patients who received SIT for TG allergy, compared with those who did not. These changes might be used to monitor response to therapy. The decrease occurred in response to antigens that elicit little (if any) immunoglobulin (Ig)E responses; these antigens might be developed for use in immunotherapy.
Keywords: T cells, specific immunotherapy, Timothy grass, cytokine
Introduction
Sensitization to common environmental allergens such as grass pollen is a feature of type I allergy, which affects as much as 20% of the general population 1, 2. Despite increasing awareness and research efforts, several studies have reported a worldwide increase in allergy prevalence over the last decades 3-5. There is an urgent need for strategies to reduce or stop pathogenesis of severe allergies, rather than just reduce symptoms. The only treatment with long-term clinical efficacy is specific immunotherapy (SIT). Little is known about the mechanisms by which SIT produces its beneficial effects.
Type I allergy is mediated by activated allergen-specific T-helper (Th)2 cells, which produce cytokines such as interleukin (IL)4, IL5, and IL136, 7. In healthy individuals the allergen-specific T-cell response is mediated predominantly by Th1 cells 8. SIT reduces the ratio of Th2:Th1 cells and alters the cytokine profile, reducing production of IL4, IL5, and IL13 and increasing production of IFNγ 9-11. Additionally, SIT has been associated with the induction of IL10-secreting regulatory T cells, which are detected in greatest abundance in the first 3–6 months of treatment and their numbers decrease after 12 months of treatment 12, 13. In addition, SIT also induces production of immunoglobulin (Ig)G4, which could compete with IgE for binding to allergen14, 15. However, there is no dependable immune correlate of clinical response to SIT that can be measured by standardized reagents in the clinic; evaluation of clinical response depends upon subjective evaluation of patient-reported symptoms.
Despite its efficacy, SIT has several limitations, including safety concerns about giving patients allergenic substances. Since most SIT regimens involve administration of whole, unfractionated, allergen extracts, adverse IgE-mediated events are a considerable risk. SIT is therefore not recommended for patients who are at high risk for serious adverse reactions (such as patients with asthma with forced expiratory volumes <70%). Significant efforts have been devoted to developing approaches to modulate allergen-specific T-cell responses without inducing IgE-meditated, immediate-type reactions. These approaches include developing hypoallergens that do not contain IgE-binding epitopes 16, 17, allergens that are coupled to adjuvants and carriers of bacterial or viral origin 18, or peptides that contain dominant T-cell epitopes 19 and do not react with IgE in allergic individuals.
We previously identified a set of 93 additional Timothy grass (TG) antigens and assessed their ability to induce IL5 production by peripheral blood mononuclear (PBMC) cells from TG allergic patients20. Here, we investigate the TG-specific T-cell responses induced by these antigens in patients that have undergone SIT, compared to TG allergic patients who did not receive SIT (controls).
Methods
Study participants
Participants were recruited following Institutional Review Board approval (Federal Wide Assurance number 00000032). As control group, 40 patients with TG allergy who developed a skin reaction, based on a wheal of ≥ 5 mm in diameter following a skin prick test with TG extract, and had histories of seasonal grass pollen allergies were included in the study. For the treated group, 40 patients who received sub-cutaneous SIT within the last 12 months and were receiving maintenance therapy were recruited. General information was collected by interviews and questionnaires at the time of enrollment, including participants’ assessments of whether the SIT regimens had been effective in ameliorating their symptoms. Patients demographic and clinical information are presented in Table E1a. HLA type information is presented in Table E1b.
Assembly of a peptide panel from additional TG antigens
The discovery of the additional TG antigens and the assembly of a set of peptides that bind HLA class II molecules has been previously described20.
Isolation of PBMC and in vitro expansion of TG extract-specific T cells
PBMCs were isolated from study participants and stored in liquid nitrogen until further use. For experimental testing, PBMC were thawed and expanded in vitro with TG pollen extract (50 μg/ml) (Greer, Lenoir, NC) or the peptide pool (5 μg/ml), as described previously 20, 21. TG extract and peptide pools had each been previously titrated to determine optimal stimulation concentrations.
ELISPOT assays
Cytokine production by cultured PBMCs in response to antigen stimulation was measured by ELISPOT, as described previously 20, 21. Cells (1 × 10⁵ cells/well) were plated and incubated with peptide (10 μg/ml), the peptide pool (5 μg/ml), or TG extract (50μg/ml). Phytohaemagglutinin (10 μg/ml) and medium alone were used as positive and negative controls, respectively. Samples were considered to produce a cytokine if 100 spot-forming cells (SFCs)/106 PBMCs were detected, with P≤.05, and a stimulation index ≥ 2. Criteria for individual peptides were the same except that a minimum of 20 SFCs were required for a sample to be counted as positive.
Binding assays
We determined the MHC binding capacity of 50 peptides, in different pools of interest (a P20, P19, and the modulated novel antigen pool), for a panel of common HLA class II alleles. Purified MHC molecules were used in competition assays, as described previously 22, 23. Binding data are presented in Table E2.
Intracellular cytokine staining
Cultured PBMCs were re-stimulated with 5 μg/ml modulated peptide pool in complete RPMI medium at 37°C in 5% CO 2. Unstimulated PBMCs were used to assess nonspecific/background cytokine production. PMA and ionomycin were used as the positive control. After the initial 2 hours of stimulation, 4 μl/ml Golgiplug (BD Biosciences) was added. After 7 hours of total incubation time, cells were collected and stained for cell surface antigens (CD4, CD3, CD8, CD14, and CD19) and Fixable Viability Dye (all from eBioscience). After washing, cells were fixed with 4% paraformaldehyde, placed in permeabilization buffer (0.5% saponin, 0.1% sodium azide, 1% bovine serum albumin in phosphatebuffered saline), and stained for IFNγ, IL4, and IL13. Samples were analyzed using a BD LSR II flow cytometer. We created dotblots of CD4+ T cells that responded to the modulated peptide pool by gating for CD4+CD3+CD8–CD14–CD19– and cytokine-positive cells using FlowJo software (Tree Star).
2-dimensional (2D) gel electrophoresis and immunoblotting
Detailed methods have been previously described20. Proteins on nitrocellulose membranes were probed with serum samples from 8 controls, as described 20, or serum samples from 6 participants who received SIT, to detect antigen-specific IgG and IgE.
Population coverage analysis
The potential population coverage afforded by the panel of TG epitopes we identified was determined based on their predicted ability to bind 47 different HLA DR, DQ, and DP molecules (Table E4). The panel of class II specificities to be used in the analysis was selected based on the availability of reagents that would allow for further characterization of response, such as in MHC–peptide binding assays 22, with tetramer reagents, or with cell lines transfected with single alleles23. Binding was predicted using tools available from the Immune Epitope Database (IEDB, www.iedb.org) 24, 25. We used the IEDB-recommended prediction method for each HLA; binding was defined conservatively, as a consensus percentile score <10. Population coverage was estimated using the IEDBs population coverage tool 26, based on HLA frequency data available from the major histocompatibility complex database (dbMHC) (http://www.ncbi.nlm.nih.gov/gv/mhc/main.fcgi?cmd=init) and the Allele Frequencies database (http://www.allelefrequencies.net/) 27.
Results
Decrease in IL5 Production in Response to TG Antigens Following SIT
Previous studies 21, 28-30 described a set of 10 TG pollen-derived antigens (referred to in this report as known TG antigens, KTGA). We recently identified and characterized the immune responses of TG allergic patients to a panel of 93 additional TG antigens (referred in this report as ATGA) 20. Here, we investigated immune responses from patients who received grass pollen SIT, to peptides derived from the ATGAs and KTGAs. The 822 peptides from the ATGAs were assembled into 42 pools and tested for PBMC responses from study participants along with 5 pools of 105 peptides from the 10 KTGAs (~20 peptides per pool).
Production of IL5 was detected in PBMCs from ≥20% of control patients with allergies in response to 4/5 KTGA pools and 13/42 ATGA pools; the average response was 262 SFCs among the 5 KTGA pools (range, 44–498 SFCs) and 107 SFCs among the ATGA pools (range, 48–197 SFCs)20 (Figure 1 a, b). PBMCs from all control subjects reacted to TG extract (average response of 1012 SFCs). In contrast to control subjects, only 1 of the KTGA pools (109 SFC) and none of the ATGA pools tested induced IL5 production by PMBCs from ≥20% of patients that received SIT (Figure 1 a, b). IL5 was produced in response to TG extract in PBMC from 75% of SIT subjects, eliciting an average of 460 SFCs.
Figure 1. Cytokine Production by PBMC in Response to TG Extract and Peptide Pools.
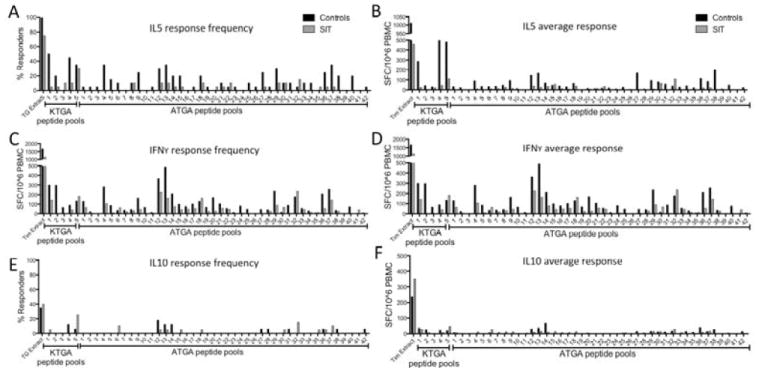
Peptides that induce production of IL5 (A, B), IFNγ (C, D) and IL 10 (E, F) by PBMC from 20 patients receiving SIT and 20 controls. Panels A, C, and E show percentage of patient PBMC samples that responded to each antigen. Panels B, D, and F show average responses of PBMC from 20 patients to each antigen.
Production of IFNγ and IL10 in Response to TG Antigens
The efficacy of SIT has been proposed to partly depend on a switch from a Th2 to a Th1 cell response, and/or upregulation of IL10 production by T regulatory cells. We therefore measured production of IFNγ and IL10 by PBMC in response to TG extract, KTGA, and ATGA.
IFNγ production in both control and SIT patients were of similar frequency and magnitude (Figure 1 c and d). All 5 KTGA-derived pools elicited IFNγ in PMBC from ≥20% control subjects (average of 177 SFCs), as did 16/42 of the ATGA pools (average, 200 SFCs). Production of IFNγ in response to TG extract was observed in PBMC from 90% of control subjects (average, 1668 SFCs). In SIT patients, 2 of the 5 KTGA pools (average, 163 SFCs) and 15/42 ATGA pools (average, 103 SFCs) induced IFNγ production by PBMC from ≥20% of subjects (Figures 1c and d). TG extract induced IFNγ production by PBMC from 95% of SIT subjects (average, 1139 SFCs).
In contrast to IFNγ, IL10 was produced at relatively low frequency, by PMBC from patients of both cohorts, in response to KTGA and ATGA peptide pools (Figure 1e, f). IL10 production was detected in ≥10% of control and SIT subjects in response to only 1/5 KTGA pools (average, 23 and 44 SFCs, for control and SIT patients, respectively). Three of 42 ATGA peptide pools induced IL10 production by PBMC from ≥10% of both control and SIT subjects (average, 44 and 24 SFCs, for control and SIT patients, respectively) (Figures 1e and f). IL10 was produced in response to TG extract by PBMC from 35% of control subjects (average, 352 SFCs) and 40% of SIT patients (average, 236 SFCs). IL10 production measured against TG extract indicates that the median response magnitude in SIT donors is slightly increased compared to controls. To further assess this difference, we plotted individual responses, and found that differences in IL10 production by PBMC did not differ significantly between groups (Figure E1).
Summary of T-cell Reactivity Among Patients Who Received SIT
Next, we analyzed the data on a per-patient rather than a per-pool basis. Averages of the sum responses to KTGA and ATGA pools of all subjects are shown in Figure 2. The KTGA pools elicited reduced IL5 production by PBMC from SIT patients (average, 145 SFCs) compared to controls (average, 1249 SFCs) (P=.006) (Figure 2a). IL5 responses to ATGA from patients who received SIT were also reduced (average, 373 SFCs) compared to controls (average, 1463 SFCs) (P=.003) (Figure 2a).
Figure 2. Cytokine Production by PBMC from Control and SIT Patients in Response to TG Antigens.
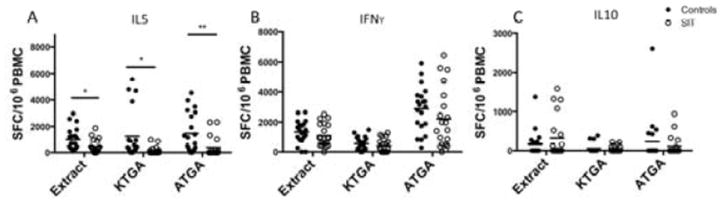
Circles indicate number of SFCs in PBMC from individual donors (black circles, from 20 controls; white circles, from 20 SIT) indicating production of IL5 (A), IFNγ (B), and IL10 (C) in response to TG extract, known allergens, and additional TG antigens. *=P<.05, **=P<.005, based on the student t test.
In contrast, production of IFNγ by PBMC from patients who received SIT vs controls did not differ significantly in response to ATGA or KTGA pools (Figure 2b). In IFNγ assays, KTGA pools induced an average 569 SFCs in controls and 405 SFCs in SIT patients; ATGA pools induced an average 2876 SFCs in controls and 2220 SFCs in SIT patients (Figure 2b). Similarly, IL10 production did not differ between groups (Figure 2c). KTGA pools induced 51 SFCs in controls and 46 SFC in SIT patients; ATGA pools induced 49 SFC in controls and 19 SFC in SIT patients (Figure 2c).
Effects of SIT on Antigen and Epitope Specificity
To identify the individual peptides within the ATGA pools that produced the observed responses, pools that elicited cytokine production were deconvoluted and PBMC reactivity to individual peptides was determined (Table E3a). We were specifically interested in mapping T cell epitopes of each antigen and assessing modulation of Th2 cell responses on a per-antigen level. T cell reactivity to each antigen is presented in Table E3b.
Immunologic characterisitcs of the 13 antigens that were recognized by PBMC from ≥20% of control subjects are presented in Table 1. The deconvolution experiments identified 6 specific ATGAs (Table 1, top panel) that induced strong IL5 production in control subjects, which was reduced in PBMC from patients who received SIT (Antigens 2, 49, 53, 54, 69, and 91; Figures 3a and b). PBMCs from 15/20 controls recognized ≥1 of these antigens (on average, each antigen elicited IL5 production in 5.2 control patients; range, 4–7), whereas PBMC from only 7/20 SIT patients responded to ≥1 of these antigens (on average, each antigen elicited responses in 1.5 SIT patients; range, 0–3) (Figure 3a). The average response to these antigens was reduced from 3182 SFCs dectected in controls (range 1750–7417 SFC) to 108 SFCs in patients who received SIT (range 0–387 SFC) (Figure 3b).
Table 1. Immunological characteristics of 13 novel antigens inducing IL5 production in ≥20% of control donors.
The 6 highly modulated antigens (MNA) are shown in the top panel, the remaining 7 ATGAs are shown in the bottom panel for reference.
| Control Cohort | SIT Cohort | |||||||||||
|---|---|---|---|---|---|---|---|---|---|---|---|---|
|
| ||||||||||||
| IL5 | IFNy | Antibody reactivity | IL5 | IFNy | Antibody reactivity | |||||||
|
| ||||||||||||
| Antigen | # responders | Total SFC | # responders | Total SFC | IgE | IgG | # responders | Total SFC | # responders | Total SFC | IgE | IgG |
| 2 | 7 | 3447 | 10 | 8200 | + | + | 3 | 130 | 4 | 2790 | + | + |
| 62 | 5 | 1927 | 6 | 2827 | + | + | 2 | 80 | 3 | 1417 | + | + |
| 49 | 5 | 7417 | 1 | 990 | - | - | 0 | 0 | 0 | 0 | - | + |
| 53 | 6 | 1750 | 6 | 3693 | - | + | 1 | 30 | 3 | 903 | - | + |
| 54 | 4 | 2647 | 7 | 1133 | - | - | 2 | 387 | 3 | 1510 | - | + |
| 91 | 4 | 1904 | 2 | 1430 | - | - | 1 | 23 | 1 | 270 | - | - |
|
| ||||||||||||
| 6 | 11 | 7003 | 11 | 7490 | + | + | 5 | 1087 | 10 | 6163 | + | + |
| 89 | 9 | 2360 | 11 | 5560 | - | - | 6 | 883 | 6 | 5470 | - | - |
| 24 | 6 | 1327 | 5 | 2443 | + | - | 2 | 603 | 3 | 3307 | + | + |
| 52 | 6 | 930 | 5 | 1293 | - | + | 0 | 0 | 1 | 27 | - | + |
| 7 | 5 | 1657 | 5 | 5603 | + | + | 1 | 567 | 3 | 1270 | + | + |
| 46 | 5 | 533 | 2 | 227 | + | + | 0 | 0 | 3 | 100 | + | + |
| 22 | 4 | 367 | 1 | 667 | - | - | 0 | 0 | 1 | 103 | - | - |
Figure 3. IL5 Production by PBMC in Response to Modulated ATGAs.
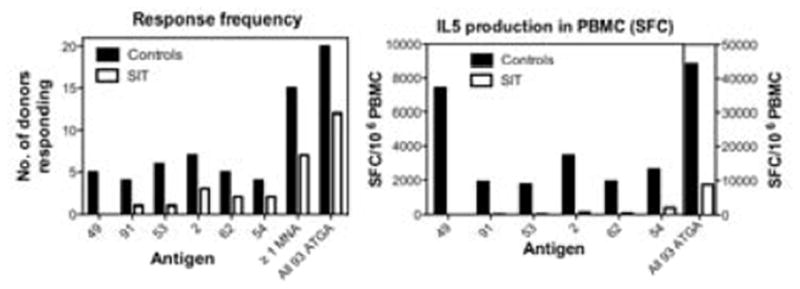
Left panel shows the number of responding SIT patients (white bar) and controls (black bar), whose PBMC produced IL5 in response to a subset of ATGAs that show modulated IL5 production following SIT treatment. Right panel shows the magnitude of the IL5 response to the subset of antigens in PBMC from SIT (white bar) or control (black bar) subjects.
2D gel electrophoresis and immunoblot analyses were used to assess antibody reactivity to all 13 antigens in both control (pool of 8 patients) and SIT patients (pool of 6 patirnts) (Figure 4 b,c). Five of the antigens were recognized by both IgE and IgG (antigens 2, 6, 7, 46 and 62) in controls, and this reactivity was not appreciably modulated by SIT treatment. One antigen (antigen 24) was IgE-reactive in both controls and SIT patients but was only recognized by IgG from donors who had received SIT. The remaining seven antigens were IgE unreactive in controls as well as SIT-treated patients. Interestingly, for two of them (antigens 49 and 54) IgG reactivity was only detected in SIT patient’s sera (Table 1).
Figure 4. 2D Gel Electrophoresis and Immunoblot Analysis of TG Extract, Using Pooled Serum Samples from Controls and SIT patients.
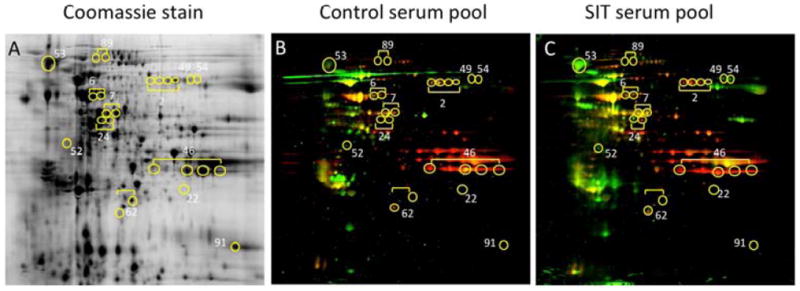
Coomassie-stained 2D gel of TG extract (A). Immunoblot analysis shows proteins that react with IgG (green spots), IgE (red spots), or both (yellow spots) in sera from controls (B) and patients who received SIT (C). Yellow circles indicate locations of the 13 ATGAs that induce IL5 production in PBMC from controls.
SIT Alters T-cell Responses to Specific Epitopes
We investigated whether Th2 responses to a specific mixture of peptides are downergulated following to SIT. If so, these might be used to track response to therapy or develop new treatment regimens. We assessed whether the significant IL5 reduction we observed following SIT could be validated in an independent group of patients (20 new patients who received SIT and 20 new controls). In these experiments, we tested a pool of 20 peptides from the 6 ATGAs (2, 49, 53, 54, 62, and 91), which had showed strongest modulation of IL5 responses following SIT (referred to hereafter as modulated novel antigen (MNA) pool).
In ELISPOT assays PBMCs from controls produced significantly lower levels of IFNγ (average, 1588 SFCs) compared to SIT patients (average, 2560 SFCs) (P=.00006) (Figure 5a). IL5 production was higher in PBMC from controls (average, 957 SFCs) than PBMCs from patients who received SIT (average, 425 SFCs) (P=.015). No significant difference in IL10 production was observed between controls (average, 467 SFCs) and SIT patients (average, 388 SFCs) (P=.65).
Figure 5. Modulation of Cytokine Production by PBMC from SIT Patients in Response to the MNA Pool.
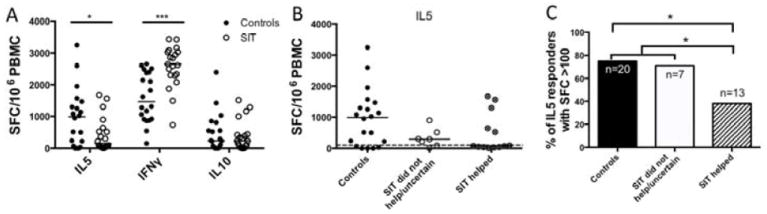
A. Cytokine production (measured as SFC) from patients receiving SIT (white dots) or controls (black dots). Line=median values. *=P<.05, ***=P<.001, determined by student t test. B. IL5 production by PBMC from controls (black dots, left), patients who did not respond to SIT or were uncertain of their response (white dots, middle), or patients who reported improved symptoms after SIT (dots with X, right) in response to the MNA pool. The dashed line (at 100 SFC) indicates a strong response. C) A bar chart showing the percentage of patients in each group that had PBMC responses of > 100 SFC for IL5. *=P<.05, determined by Fisher exact test.
We performed intracellular cytokine staining experiments to investigate whether SIT leads to changes in other Th2 cell responses, beyond reducing production of IL5. We measured levels of the Th2 cytokines IL4 and IL13, as well as the Th1 cytokine IFNγ, in PBMC stimulated with the MNA pool. In support of findings from ELISPOT assays, we observed reduced production of IL4 and IL13 by CD4 T cells from patients who received SIT compared with CD4 T cells from controls (Figure E2).
Production of IL5 in Response to the MNA Pool
Using the data from the original ELISPOT assays assessing cytokine production in PBMC in response to all 822 ATGA peptides, in the case of IFNγ, a reactivity of 2200 SFC or higher was associated with 75% of patients who received SIT, whereas a response of 2200 SFC or lower identified 75% of controls. Similarly, for IL5 production correct classification of approximately 67% of SIT-treated individuals was associated with reactivity below the 1000 SFC level.
We investigated whether a reduction in the Th2 cell response specific to the MNA pool correlated with a reduction in symptoms, as subjectively judged by patients who received SIT. Subjects undergoing maintenance SIT were divided into groups that did and did not report improved symptoms from the treatment. PBMC from patients who reported improved symptoms after SIT produced lower levels of IL5 compared with PBMC from patients who were uncertain or did not feel their symptoms had improved (Figure 5b).
The percentage of patients with PBMCs that formed ≥100 SFCs (which we considered a strong response) was plotted for each group (Figure 5c). PBMC from 75% (15/20) of controls produced IL5 in response to the MNA pool, with ≥100 SFCs. Similarly, PBMC from 71.4% (5/7) patients who were unsure of their improvement or did not report reduced symptoms after SIT produced IL5 at the ≥100 SFC threshold. However, among patients who felt that SIT reduced their symptoms, only 38.5% (5/13) produced IL5 at levels ≥100 SFCs (Figure 5c; P<.05, by the Fisher exact test). Among all 20 patients who received SIT, 10 had PBMC that produced IL5 <100 SFCs; 8 patients stated that SIT improved their symptoms. This assay therefore identifies 80% of patients who report that SIT reduces their symptoms.
Percentage of population with MNA peptide-binding HLA
The ability to use the MNA pool as a diagnostic or in SIT would depend on the ability of the epitopes to bind HLA of a broad fraction of the target population. We investigated the percentage of the population with HLA types that would bind MNA peptides using 2 approaches. First, we simply reviewed data collected from PBMCs of controls, restimulated with the MNA pool, and made a minimal estimate of reactivity since immunization only occurred ones in vitro. We found that PMBC from 90% of controls responded to at least 1 epitope and, on average, each individual responded to 3.75 epitopes (range, 0–14) (Table 2a). The HLA types of individual subjects are presented in Table E1b. An analysis of the HLA type data from the control and SIT groups revealed a statistically significant difference for 2 alleles between groups, (DPB1*04:02 and DRB1*04:01; Fisher exact test, with Bonferroni correction) although neither allele was present in >20% of either group.
Table 2.
a: Patient coverage of the control patient cohort experimentally determined by PBMC cytokine production elicited by the set of peptides from the modulated pool.
| Patient | # positive peptides |
|---|---|
| U00098 | 5 |
| D00016 | 6 |
| D00073 | 2 |
| D00084 | 12 |
| D00089 | 2 |
| D00090 | 1 |
| D00092 | 2 |
| D00102 | 0 |
| D00104 | 1 |
| D00117 | 14 |
| U00058 | 5 |
| U00095 | 2 |
| U00106 | 5 |
| U00125 | 4 |
| U00129 | 0 |
| U00140 | 3 |
| U00147 | 2 |
| U00150 | 3 |
| U00151 | 3 |
| U00153 | 3 |
|
| |
| Average | 3.75 |
| b. Predicted HLA binding of MNA pool peptides in different populations.
| |||
|---|---|---|---|
| Population/ Area | Coveragea | Average hitb | PC90c |
|
| |||
| Australia | 98.0% | 11.4 | 2.64 |
| Europe | 95.2% | 12.5 | 1.96 |
| North Africa | 96.5% | 13.7 | 4.36 |
| North America | 99.3% | 13.3 | 6.26 |
| North-East Asia | 87.2% | 9.5 | 0.78 |
| Oceania | 89.4% | 8.1 | 0.94 |
| Other | 99.7% | 17.6 | 8.42 |
| South America | 99.8% | 11.5 | 6.27 |
| South-East Asia | 91.1% | 6.8 | 1.12 |
| South-West Asia | 99.7% | 17.1 | 8.06 |
| Sub-Saharan Africa | 99.1% | 17.3 | 6.44 |
|
| |||
| Average | 95.90% | 12.6 | 4.3 |
projected population coverage
average number of epitope hits / HLA combinations recognized by the population
minimum number of epitope hits / HLA combinations recognized by 90% of the population
In the second approach we estimated the maximum potential population coverage using the Population Coverage Calculation Tool, available from the Immune Epitope Database and Analysis Resource (www.iedb.org)26. Here, coverage is based on predicted binding to a panel of the most common HLA DR, DQ, and DP allelic variants. It is estimated that more than 95% of the general population expresses HLA molecules predicted to bind at least 1 epitope(s), and on average each individual would be expected to present 12.6 epitope–HLA combinations (range, 6.8–17.6) (Table 2b). These data indicate that most of the population’s HLAs should bind the MNA peptides.
Discussion
We recently reported that the number of TG antigens recognized by Th2 cells in TG allergic patients is much broader than previously recognized, and that many of these antigens are not recognized by IgE20. Herein we examined whether reactivity to these additional antigens is modulated by SIT. To address this question, we compared the responses of PBMCs from 20 patients TG allergic subjects (controls) with those of patients who had received SIT.
Findings from our cross-sectional study indicated that PBMC from patients who received SIT produced lower levels of IL5, in response to previously known and recently discovered TG antigens, than PBMC from controls. Conversely, overall production of IFNγ did not differ significantly between patients who received SIT and controls. However, PBMC produced higher levels of IFNγ in response to peptides derived from the additional TG antigens (ATGAs) compared to the known allergens (KTGAs). This may indicate that the ATGAs more frequently activate Th1 cells than Th2 cells. Alternatively, the observed difference in IFNγ production may simply be due to the fact that the ATGAs comprised 822 predicted peptides, whereas the KTGAs only comprised 105 peptides. We observed no difference in production of IL10 by PMC from patients who received SIT vs controls.
The significant increase in production of IFNγ by PBMC from patients who received SIT was not observed in our first study. This difference could result from different stimulation conditions (pools vs TG extracts); it is possible that peptides and extract affect patients in different ways (depending on exact sensitization), interacting with different types of T cells or receptors. Additional experiments are required to evaluate the different effects of TG extracts vs peptides on T-cell activation and cytokine production.
Our results are consistent with those from other studies reporting a shift in the immune response from Th2- to Th1, following SIT for grass pollen allergy31, 32. Interestingly, we did not observe any obvious differences in protein size or abundance in TG extracts among MNAs (data not shown). The observation that there was no difference in IL10 production from SIT patients vs controls, in response to either the KTGAs or ATGAs, is consistent with reports that IL10 production following SIT is an initial and transient event15. IL10 produced in response to whole TG extract by SIT patients was slightly higher than in controls. However, in an analysis of individual responses, this difference was not statistically significant. IL10 production might differ based on whether it is induced in response to extract or peptide, and which T-cell population produces it.
Our findings indicate that reduced production of Th2 cytokines by PBMC could be a biomarker of SIT. Importantly, since the modulation of Th cell function occurs in response to known allergens and recently identified TG antigens, the effects of SIT, in terms of T-cell activity, could be much broader than currently recognized. Though beyond the scope of this paper, it would be interesting to investigate whether the TG MNA peptides stimulate different T-cell repertoires and to determine if the down-modulation affects different TCR subsets.
Our observed association between reduced IL5 production and SIT efficacy, based on patient-reported improvements in symptoms, might lead to the development of an assay to measure or predict responses to therapy. However, it is important to recognize the caveat that these PBMC samples are collected from separate allergic (control) and SIT cohorts rather than from the same patients before and throughout SIT. Also, patient-reported improvement in symptoms is a subjective endpoint. More detailed analyses of T-cell reactivity to TG antigens in longitudinal studies are required to evaluate the clinical potential for these peptides and assays. The observed modulation in Th2 response must be correlated with objective clinical endpoints such as levels of IgG4, increased lung function, and reduced responses to skin-prick tests. Such studies will also help determine how soon the downregulation of Th2 responses can be detected after initiation of the SIT regimen.
Our findings have led us to speculate whether ATGAs might be used in SIT. T cells are involved in the pathogenesis of asthma and allergic disease 33, 34. The T-cell modulation we observed occurs not only in response to ATGA peptides, but also KTGAs and whole TG extract. However, the pollen extracts administered for SIT contain allergens that interact strongly with IgE. Many patients most in need of SIT, such as those with severe asthma, do not receive this therapy due to concerns about anaphylactic reactions. However, many ATGAs do not appear to bind IgE, indicating that this property is not required to alter IL5 production. The ATGAs might be used to modulate the Th2 response with fewer safety concerns. Further study of antibody reactivity is required to determine actual antigen-specific levels of IgE and IgG, based on radioallergosorbent test (RAST) analysis of serum from each subject.
If ATGAs are to be considered for inclusion in immunotherapy, several important questions must be answered. What are the mechanisms by which ATGAs alter the responses of Th2 cells? Are ATGAs more effective than allergen extracts, which contain allergens and non-allergenic proteins? Does the observed downregulation of the Th2 response result from direct activation and modulation of KTGA- or ATGA-specific T cells, or both?
SIT is believed to reduce the allergic response by induction of IL10- producing T regulatory cells and modulating Th2 cell activity. It could have broad effects, in that T regulatory cells specific for a given molecule in pollen might be able to downregulate the T-cell response against a different pollen antigen. Alternatively, SIT may be highly allergen-specific at the T-cell level, yet have strong bystander effects on other T cells. The generalized downregulation of Th2 cell responses we observed is compatible with both these models. Several reports from clinical trials 35-38 support the potential use of peptides as immunomodulators. Our study identifies a set of TG antigen epitopes that dowregulate production of Th2 cytokines and upregulate the Th1 cell response. It is important to note, however, that the set of epitopes we identified did not alter Th2 responses in PBMC from 100% of study participants. Further studies are required to determine the optimal number and composition of epitopes required to produce these effects. Here, we have identified a pool of peptides that could alter immune responses in a large proportion of the population, worldwide.
Our findings provide evidence that SIT downregulates the Th2 response to both the known allergens and recently identified additional TG antigens. These antigens or their associated epitopes could be used to measure or predict patients’ response to SIT or as immunotherapeutic agents. Studies to evaluate the clinical potential of our findings are underway, and include whole-pollen sensitization of animal models immunized with peptides, as well as longitudinal studies of patients who have received SIT regimens.
Supplementary Material
Acknowledgments
Funding declaration
This project has been funded in whole or in part with Federal funds from the National Institutes of Allergy and Infectious Diseases, National Institutes of Health, Department of Health and Human Services, under Contract No. HHSN272200700048C and U19 Grant No. U19 AI100275. The project was partially supported by NIH grant ULRR031980 (years 1 & 2 of CTSA funding) and UL1TR000100 (year 3 and beyond of CTSA funding). RA was supported by the NIH grant RO1 AI091614.
Abbreviations
- IL
interleukin
- MNA
modulated novel antigen
- SIT
specific immunotherapy
- TG
Timothy grass
Footnotes
Clinical implications
PBMC from patients with allergies who received SIT produce lower levels of Th2 cytokines and higher levels of IFNγ in response to specific peptides from TG antigens.
Publisher's Disclaimer: This is a PDF file of an unedited manuscript that has been accepted for publication. As a service to our customers we are providing this early version of the manuscript. The manuscript will undergo copyediting, typesetting, and review of the resulting proof before it is published in its final citable form. Please note that during the production process errors may be discovered which could affect the content, and all legal disclaimers that apply to the journal pertain.
References
- 1.Nathan RA. The burden of allergic rhinitis. Allergy and asthma proceedings : the official journal of regional and state allergy societies. 2007;28:3–9. doi: 10.2500/aap.2007.28.2934. [DOI] [PubMed] [Google Scholar]
- 2.Bauchau V, Durham SR. Prevalence and rate of diagnosis of allergic rhinitis in Europe. The European respiratory journal : official journal of the European Society for Clinical Respiratory Physiology. 2004;24:758–64. doi: 10.1183/09031936.04.00013904. [DOI] [PubMed] [Google Scholar]
- 3.Asher MI, Montefort S, Bjorksten B, Lai CK, Strachan DP, Weiland SK, et al. Worldwide time trends in the prevalence of symptoms of asthma, allergic rhinoconjunctivitis, and eczema in childhood: ISAAC Phases One and Three repeat multicountry cross-sectional surveys. Lancet. 2006;368:733–43. doi: 10.1016/S0140-6736(06)69283-0. [DOI] [PubMed] [Google Scholar]
- 4.Romagnani S. The increased prevalence of allergy and the hygiene hypothesis: missing immune deviation, reduced immune suppression, or both? Immunology. 2004;112:352–63. doi: 10.1111/j.1365-2567.2004.01925.x. [DOI] [PMC free article] [PubMed] [Google Scholar]
- 5.von Mutius E, Weiland SK, Fritzsch C, Duhme H, Keil U. Increasing prevalence of hay fever and atopy among children in Leipzig, East Germany. Lancet. 1998;351:862–6. doi: 10.1016/S0140-6736(97)10100-3. [DOI] [PubMed] [Google Scholar]
- 6.Kapsenberg ML, Jansen HM, Bos JD, Wierenga EA. Role of type 1 and type 2 T helper cells in allergic diseases. Current opinion in immunology. 1992;4:788– 93. doi: 10.1016/0952-7915(92)90063-k. [DOI] [PubMed] [Google Scholar]
- 7.Wills-Karp M, Luyimbazi J, Xu X, Schofield B, Neben TY, Karp CL, et al. Interleukin-13: central mediator of allergic asthma. Science. 1998;282:2258– 61. doi: 10.1126/science.282.5397.2258. [DOI] [PubMed] [Google Scholar]
- 8.Akdis M, Verhagen J, Taylor A, Karamloo F, Karagiannidis C, Crameri R, et al. Immune responses in healthy and allergic individuals are characterized by a fine balance between allergen-specific T regulatory 1 and T helper 2 cells. The Journal of experimental medicine. 2004;199:1567–75. doi: 10.1084/jem.20032058. [DOI] [PMC free article] [PubMed] [Google Scholar]
- 9.Jutel M, Pichler WJ, Skrbic D, Urwyler A, Dahinden C, Muller UR. Bee venom immunotherapy results in decrease of IL-4 and IL-5 and increase of IFNgamma secretion in specific allergen-stimulated T cell cultures. Journal of immunology. 1995;154:4187–94. [PubMed] [Google Scholar]
- 10.Gabrielsson S, Soderlund A, Paulie S, van der Pouw Kraan TC, Troye-Blomberg M, Rak S. Specific immunotherapy prevents increased levels of allergen-specific IL-4- and IL-13-producing cells during pollen season. Allergy. 2001;56:293–300. doi: 10.1034/j.1398-9995.2001.00472.x. [DOI] [PubMed] [Google Scholar]
- 11.Moverare R, Elfman L, Bjornsson E, Stalenheim G. Cytokine production by peripheral blood mononuclear cells following birch-pollen immunotherapy. Immunology letters. 2000;73:51–6. doi: 10.1016/s0165-2478(00)00199-1. [DOI] [PubMed] [Google Scholar]
- 12.Mobs C, Slotosch C, Loffler H, Jakob T, Hertl M, Pfutzner W. Birch pollen immunotherapy leads to differential induction of regulatory T cells and delayed helper T cell immune deviation. Journal of immunology. 2010;184:2194–203. doi: 10.4049/jimmunol.0901379. [DOI] [PubMed] [Google Scholar]
- 13.Bohle B, Kinaciyan T, Gerstmayr M, Radakovics A, Jahn-Schmid B, Ebner C. Sublingual immunotherapy induces IL-10-producing T regulatory cells, allergen-specific T-cell tolerance, and immune deviation. The Journal of allergy and clinical immunology. 2007;120:707–13. doi: 10.1016/j.jaci.2007.06.013. [DOI] [PubMed] [Google Scholar]
- 14.Vickery BP, Lin J, Kulis M, Fu Z, Steele PH, Jones SM, et al. Peanut oral immunotherapy modifies IgE and IgG4 responses to major peanut allergens. The Journal of allergy and clinical immunology. 2013;131:128–34. e1–3. doi: 10.1016/j.jaci.2012.10.048. [DOI] [PMC free article] [PubMed] [Google Scholar]
- 15.Mobs C, Ipsen H, Mayer L, Slotosch C, Petersen A, Wurtzen PA, et al. Birch pollen immunotherapy results in long-term loss of Bet v 1-specific TH2 responses, transient TR1 activation, and synthesis of IgE-blocking antibodies. The Journal of allergy and clinical immunology. 2012;130:1108–16. e6. doi: 10.1016/j.jaci.2012.07.056. [DOI] [PubMed] [Google Scholar]
- 16.Saarne T, Kaiser L, Gronlund H, Rasool O, Gafvelin G, van Hage-Hamsten M. Rational design of hypoallergens applied to the major cat allergen Fel d 1. Clinical and experimental allergy : journal of the British Society for Allergy and Clinical Immunology. 2005;35:657–63. doi: 10.1111/j.1365-2222.2005.02234.x. [DOI] [PubMed] [Google Scholar]
- 17.Gafvelin G, Parmley S, Neimert-Andersson T, Blank U, Eriksson TL, van Hage M, et al. Hypoallergens for allergen-specific immunotherapy by directed molecular evolution of mite group 2 allergens. The Journal of biological chemistry. 2007;282:3778–87. doi: 10.1074/jbc.M607938200. [DOI] [PubMed] [Google Scholar]
- 18.Marth K, Breyer I, Focke-Tejkl M, Blatt K, Shamji MH, Layhadi J, et al. A Nonallergenic Birch Pollen Allergy Vaccine Consisting of Hepatitis PreSFused Bet v 1 Peptides Focuses Blocking IgG toward IgE Epitopes and Shifts Immune Responses to a Tolerogenic and Th1 Phenotype. Journal of immunology. 2013;190:3068–78. doi: 10.4049/jimmunol.1202441. [DOI] [PMC free article] [PubMed] [Google Scholar]
- 19.Patel D, Couroux P, Hickey P, Salapatek AM, Laidler P, Larche M, et al. Fel d 1- derived peptide antigen desensitization shows a persistent treatment effect 1 year after the start of dosing: a randomized, placebo-controlled study. The Journal of allergy and clinical immunology. 2013;131:103–9. e1–7. doi: 10.1016/j.jaci.2012.07.028. [DOI] [PubMed] [Google Scholar]
- 20.Schulten V, Greenbaum JA, Hauser M, McKinney DM, Sidney J, Kolla R, et al. Previously undescribed grass pollen antigens are the major inducers of T helper 2 cytokine-producing T cells in allergic individuals. Proceedings of the National Academy of Sciences of the United States of America. 2013;110:3459–64. doi: 10.1073/pnas.1300512110. [DOI] [PMC free article] [PubMed] [Google Scholar]
- 21.Oseroff C, Sidney J, Kotturi MF, Kolla R, Alam R, Broide DH, et al. Molecular determinants of T cell epitope recognition to the common Timothy grass allergen. Journal of immunology. 2010;185:943–55. doi: 10.4049/jimmunol.1000405. [DOI] [PMC free article] [PubMed] [Google Scholar]
- 22.Greenbaum J, Sidney J, Chung J, Brander C, Peters B, Sette A. Functional classification of class II human leukocyte antigen (HLA) molecules reveals seven different supertypes and a surprising degree of repertoire sharing across supertypes. Immunogenetics. 2011;63:325–35. doi: 10.1007/s00251-011-0513-0. [DOI] [PMC free article] [PubMed] [Google Scholar]
- 23.McKinney DM, Southwood S, Hinz D, Oseroff C, Arlehamn CS, Schulten V, et al. A strategy to determine HLA class II restriction broadly covering the DR, DP, and DQ allelic variants most commonly expressed in the general population. Immunogenetics. 2013;65:357–70. doi: 10.1007/s00251-013-0684-y. [DOI] [PMC free article] [PubMed] [Google Scholar]
- 24.Wang P, Sidney J, Dow C, Mothe B, Sette A, Peters B. A systematic assessment of MHC class II peptide binding predictions and evaluation of a consensus approach. PLoS computational biology. 2008;4:e1000048. doi: 10.1371/journal.pcbi.1000048. [DOI] [PMC free article] [PubMed] [Google Scholar]
- 25.Wang P, Sidney J, Kim Y, Sette A, Lund O, Nielsen M, et al. Peptide binding predictions for HLA DR, DP and DQ molecules. BMC bioinformatics. 2010;11:568. doi: 10.1186/1471-2105-11-568. [DOI] [PMC free article] [PubMed] [Google Scholar]
- 26.Bui HH, Sidney J, Dinh K, Southwood S, Newman MJ, Sette A. Predicting population coverage of T-cell epitope-based diagnostics and vaccines. BMC bioinformatics. 2006;7:153. doi: 10.1186/1471-2105-7-153. [DOI] [PMC free article] [PubMed] [Google Scholar]
- 27.Middleton D, Menchaca L, Rood H, Komerofsky R. New allele frequency database. 2003;61:403–7. doi: 10.1034/j.1399-0039.2003.00062.x. Tissue antigens http://www.allelefrequencies.net. [DOI] [PubMed] [Google Scholar]
- 28.Nandy A, Petersen A, Wald M, Suck R, Kahlert H, Weber B, et al. Primary structure, recombinant expression, and molecular characterization of Phl p 4, a major allergen of timothy grass (Phleum pratense) Biochemical and biophysical research communications. 2005;337:563–70. doi: 10.1016/j.bbrc.2005.09.087. [DOI] [PubMed] [Google Scholar]
- 29.Andersson K, Lidholm J. Characteristics and immunobiology of grass pollen allergens. International archives of allergy and immunology. 2003;130:87–107. doi: 10.1159/000069013. [DOI] [PubMed] [Google Scholar]
- 30.Vrtala S, Susani M, Sperr WR, Valent P, Laffer S, Dolecek C, et al. Immunologic characterization of purified recombinant timothy grass pollen (Phleum pratense) allergens (Phl p 1, Phl p2, Phl p 5) The Journal of allergy and clinical immunology. 1996;97:781–7. doi: 10.1016/s0091-6749(96)80156-4. [DOI] [PubMed] [Google Scholar]
- 31.Ebner C, Siemann U, Bohle B, Willheim M, Wiedermann U, Schenk S, et al. Immunological changes during specific immunotherapy of grass pollen allergy: reduced lymphoproliferative responses to allergen and shift from TH2 to TH1 in T-cell clones specific for Phl p 1, a major grass pollen allergen. Clinical and experimental allergy : journal of the British Society for Allergy and Clinical Immunology. 1997;27:1007–15. doi: 10.1111/j.1365-2222.1997.tb01252.x. [DOI] [PubMed] [Google Scholar]
- 32.Durham SR, Ying S, Varney VA, Jacobson MR, Sudderick RM, Mackay IS, et al. Grass pollen immunotherapy inhibits allergen-induced infiltration of CD4+ T lymphocytes and eosinophils in the nasal mucosa and increases the number of cells expressing messenger RNA for interferon-gamma. The Journal of allergy and clinical immunology. 1996;97:1356–65. doi: 10.1016/s0091-6749(96)70205-1. [DOI] [PubMed] [Google Scholar]
- 33.Romagnani S. Regulation of the development of type 2 T-helper cells in allergy. Current opinion in immunology. 1994;6:838–46. doi: 10.1016/0952-7915(94)90002-7. [DOI] [PubMed] [Google Scholar]
- 34.Corrigan CJ, Kay AB. T cells and eosinophils in the pathogenesis of asthma. Immunology today. 1992;13:501–7. doi: 10.1016/0167-5699(92)90026-4. [DOI] [PubMed] [Google Scholar]
- 35.Pene J, Desroches A, Paradis L, Lebel B, Farce M, Nicodemus CF, et al. Immunotherapy with Fel d 1 peptides decreases IL-4 release by peripheral blood T cells of patients allergic to cats. The Journal of allergy and clinical immunology. 1998;102:571–8. doi: 10.1016/s0091-6749(98)70294-5. [DOI] [PubMed] [Google Scholar]
- 36.Muller U, Akdis CA, Fricker M, Akdis M, Blesken T, Bettens F, et al. Successful immunotherapy with T-cell epitope peptides of bee venom phospholipase A2 induces specific T-cell anergy in patients allergic to bee venom. The Journal of allergy and clinical immunology. 1998;101:747–54. doi: 10.1016/S0091-6749(98)70402-6. [DOI] [PubMed] [Google Scholar]
- 37.Fellrath JM, Kettner A, Dufour N, Frigerio C, Schneeberger D, Leimgruber A, et al. Allergen-specific T-cell tolerance induction with allergen-derived long synthetic peptides: results of a phase I trial. The Journal of allergy and clinical immunology. 2003;111:854–61. doi: 10.1067/mai.2003.1337. [DOI] [PubMed] [Google Scholar]
- 38.Alexander C, Ying S, A BK, Larche M. Fel d 1-derived T cell peptide therapy induces recruitment of CD4+ CD25+; CD4+ interferon-gamma+ T helper type 1 cells to sites of allergen-induced late-phase skin reactions in cat-allergic subjects. Clinical and experimental allergy : journal of the British Society for Allergy and Clinical Immunology. 2005;35:52–8. doi: 10.1111/j.1365-2222.2005.02143.x. [DOI] [PubMed] [Google Scholar]
Associated Data
This section collects any data citations, data availability statements, or supplementary materials included in this article.