

Abstract
Deficits in nonverbal vocal expression (e.g., blunted vocal affect, alogia) are a hallmark of schizophrenia and are a focus of the Research Domain Criteria initiative from the National Institute of Mental Health. Results from studies using symptom rating scales suggest these deficits are profound; on the order of four to six standard deviations. To complement this endeavor, we conducted a meta-analysis of studies employing objective analysis of natural speech in patients with schizophrenia and nonpsychiatric controls. Thirteen studies, collectively including 480 patients with schizophrenia and 326 nonpsychiatric controls, were identified. There was considerable variability across studies in which aspects of vocal communication were examined and in the magnitudes of deficit. Overall, speech production (reflecting alogia) was impaired at a large effects size level (d = −.80; k = 13), whereas speech variability (reflecting blunted affect) was much more modest (d = −.36; k = 2). Regarding the former, this was largely driven by measures of pause behavior, as opposed to other aspects of speech (e.g., number of words/utterances). On the other hand, ratings of negative symptoms across these studies suggested profound group differences (d = 3.54; k = 4). These data suggest that only certain aspects of vocal expression are affected in schizophrenia, and highlight major discrepancies between symptom rating and objective-based measures. The discussion centers on advancing objective analysis for understanding vocal expression in schizophrenia and for identifying and defining more homogenous patient subsets for study.
Keywords: schizophrenia, blunted, negative, affect, alogia, computerized, meta-analysis
1.0 Introduction
Negative symptoms - defined in terms of behavioral deficits (e.g., blunted affect, alogia, avolition), are considered central to schizophrenia pathology (American Psychiatric Association [APA], 2013) and are included in the National Institute of Mental Health’s (NIMH) Research Domain Criteria initiative (RDoC) (e.g., “production of non-facial communication”; NIMH, 2014). Despite the term “negative” symptoms entering the clinical lexicon during the 19th century, research on them was slow to develop. This changed, in large part, during the 1980s when validated measures of these symptoms were introduced into psychiatry research (e.g., Scale for the Assessment of Negative Symptoms [SANS]; Andreasen, 1984; Schedule for the Deficit Syndrome; Kirkpatrick et al., 1989). Consider Figure 1 which highlights the dramatic increase in peer-reviewed publications using the terms “negative symptoms” and “schizophrenia” over the last 3 decades. There is no question that these negative symptom rating scales, and those developed more recently (e.g., Kirkpatrick et al., 2011; Kring et al., 2013) have been instrumental in attempts to understand schizophrenia. Not surprisingly, data yielded by these measures suggests that patients with schizophrenia, as a group, are rated as being much higher in negative symptoms than nonpsychiatric populations. The exact magnitude of group differences is difficult to estimate because few studies report negative symptoms in nonpsychiatric participants. Nonetheless, there is reason to think that it is profound. In comparing SANS global scores from a recent meta-analysis of nonpsychiatric individuals (i.e., M = 1.39, SD = 1.63 for healthy adults; n = 213; Emmerson et al., 2009) to SANS global scores from a large, multisite psychometric study (i.e., M = 12.04, SD = 1.66; n = 207; Mueser et al., 1994), one finds a difference on the order of six standard deviations (Cohen’s d = 6.48). Negative symptom rating scales have also been found, within schizophrenia samples, to be stable over time, and correlated with a broad range of functional, outcome, premorbid, neurocognitive, neurobiological, genetic and other variables (Buchanan, 2007; Kirkpatrick and Galderisi, 2008).
Figure 1.
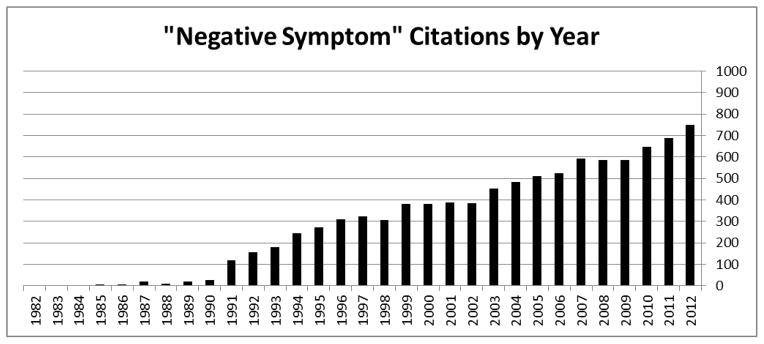
Citations per year using the terms “negative symptoms” and “schizophrenia”.
Symptom rating scales are not without their limitations, many of which are well documented in the literature (e.g., Cohen and Elvevåg, 2014). For example, symptom rating scales employ broad categories in ordinal scale with relatively few response options. In doing so, they are relatively insensitive to change over time, particularly change that might occur during the relatively brief interview-assessment window. Relatedly, scores generally have an extreme “right” skew such that the vast majority of people in the population receive the lowest score possible on these measures (Emmerson et al., 2009). In this regard, the data produced by symptom rating scales are not normally distributed or linear and thus not appropriate for parametric analysis. Also, it is fairly well documented that trained clinical experts are particularly poor at isolating specific facets of behavior when using symptom rating scales (e.g., Alpert et al., 2002).
There are three other concerns about symptom rating scales that, to our knowledge, are less well documented in the literature. First, many symptom ratings, particularly those that involve evaluating natural behavior, require raters to compare patients’ behavior to a putative “normal” baseline. Unfortunately, clear objective norms for most common forms of behavior have not been established and, due to their highly variable nature both within and across individuals, are unlikely to be established. Second, contextual factors are not generally considered when making ratings. This is important because natural behavior often varies dramatically as a function of environmental variables. Finally, the constructs covered by symptom rating scales often tap a number of functionally-distinct constructs, and are thus imprecise and overly complicated for meaningfully capturing distinct channels of psychopathology. As an illustration of these concerns, consider the “Blunted Vocal affect” rating from the SANS:
“While speaking, the subject fails to show normal vocal emphasis patterns. Speech has a monotonic quality, and important words are not emphasized through changes in pitch or volume. Subject also may fail to change volume with changes of subject so that he does not drop his voice when discussing private topics nor raise it as he discusses things which are exciting or for which louder speech might be appropriate.”
Explicit in this definition is a putative “normal vocal pattern”, which is difficult to quantify given the tremendous variability across individuals in speech. Moreover, outside of acknowledging vocal modulations as a function of broad content themes (e.g., privacy), no regard is given to the wide variety of variables that could potentially influence a participant’s vocal expression; for example, in terms of setting (e.g., professional office, forensic facility, home, party, social setting), who is conducting the interview (e.g., a curmudgeonly elderly doctor with a lab coat, an enthusiastic young research assistant), length of interview, extrinsic compensation, complexity of interview questions and individual difference factors such as ethnicity, geographic region, age, and sex. Finally, the definition includes both changes in “pitch” and “emphasis”; two mechanistically distinct facets of vocal expression that are often unrelated in studies of healthy adults (Cohen et al., 2010; Cohen et al., 2009) and for which a consensus on objective measurement does not exist. While we acknowledge that symptom rating scales have been integral to schizophrenia research and treatment more generally, it is clear that they lack precision for meaningfully understanding how distinct channels of behavior are affected by the disorder.
Technological advances have paved the way for objective assessment of natural behavior using automated algorithms. One particularly promising approach involves computerized acoustic analysis of natural speech to understand blunted vocal affect and alogia. While a rich history of acoustic analysis has been established as part of speech pathology and communication disorders more generally (e.g., Kent and Kim, 2003), its use has been modest in schizophrenia research. This is unfortunate because acoustic analysis offers the ability to objectively compare many different and distinct facets of speech across individuals and, in part because of its sensitivity (i.e., changes in vocal expression with near millisecond accuracy), across subtle or rapid changes in context. The present article conducted a review of studies employing acoustic analyses of natural speech in patients with schizophrenia with two specific aims in mind: a) to evaluate the magnitude of objective deficits in schizophrenia across a wide range of vocal characteristics – thus providing insight into which aspect(s) of vocal expression are most affected in schizophrenia, and b) to clarify how vocal expression deficits differ as a function of acoustic analytic and symptom rating scales (when employed in the same study). Regarding this second point, the magnitude of vocal deficits using data for the Emmerson et al., meta-analysis (2009) and multisite psychometric study (Mueser et al., 1994) are quite large (i.e., Cohen’s d values of 4.09, 3.42 and 4.39 for SANS Lack of Vocal Inflections, Poverty of Speech and Increased Latency of Speech ratings respectively). A recent meta-analysis (Hoekert et al., 2007) of six studies of vocal expression also bears mention here. These studies employed trained raters (e.g., undergraduate research assistants, speech therapists) to evaluate various aspects of vocal expressions in archived recordings of schizophrenia patients, and reported vocal deficits in the large range (Cohen’s d = 1.11, range of d’s = .87 – −1.95; N = 186), though much lower than those observed using symptom rating scales. When interpreting these data, it is noteworthy that these studies employed subjective ratings as opposed to objective analysis, and thus suffer from many of the inherent limitations of symptom rating scales more generally (e.g., imprecision regarding isolated dimensions of behavior, lack of ratio or interval scaling). In the present study, we sought to complement this effort by answering the questions “What does objective assessment tell us about the magnitude of speech deficits in schizophrenia”, and “how does that inform assessment, understanding and treatment of these symptoms?”
2.0 Experimental/Materials and Methods
2.1 Search Strategy for the Meta-analysis
We conducted a PsycINFO search for peer-reviewed studies published between January 1950 and January 2014 having the following terms: “schizophrenia*” and “prosody” (yielding 76 studies), “pauses” (yielding 29 studies), “acoustic analysis” (yielding 9 studies), “paralinguistic” (yielding 17 studies), “fundamental frequency” (yielding 13 studies), “negative thought disorder” (yielding 18 studies), “suprasegmental” (yielding 1 studies), “word count” (yielding 7 studies), “speech sample” (yielding 61 studies) and “nonverbal expression” (yielding 5 studies). Additional studies were identified based on references and contacting known researchers who collect speech samples as part of their research. Based on an initial evaluation for appropriateness for our study, 70 studies were considered. Our inclusion criteria included the following: 1) the article is written in (or translated to) English, 2) the article is an empirical study that is published in a peer-reviewed journal (1 dissertation and 3 review articles were excluded), 3) the article reports data on both patients with schizophrenia and controls (22 studies excluded for not having data for nonpsychiatric controls; 5 excluded for not having data for patients with schizophrenia), 4) the authors measure speech production or speech variability objectively - defined in terms of mechanically automated (e.g., computer, timing algorithm) measure of speech properties (13 studies excluded for employing subjective as opposed to objective ratings; 1 excluded for using an automated measure of vocabulary analysis), 5) the speech being analyzed involves “natural language” as opposed to reading text or producing single words or sounds (6 studies excluded), and 6) the article reports original data of symptoms sufficient to compute effect sizes (5 studies excluded for not presenting data sufficient to compute effect sizes; 1 study excluded for reporting data published elsewhere). In cases where insufficient data were published to compute effect sizes, the authors of the study were contacted in order to obtain the data. In all, 13 studies were included in the present study.
Means and standard deviations were extracted from the original report and used to compute effect sizes (see Table 1). When data for multiple patient groups were presented (e.g., for those showing clinically-rated negative symptoms versus those without), the data were averaged together and weighted by sample size. Means and standard deviations for negative symptom rating scales, when available, were also computed and reported. Note that symptom ratings were not available for control groups in any study. Based largely on data suggesting that ratings tend to be around floor for nonpsychiatric controls (Emmerson et al., 2009), we entered the lowest possible values when computing these effect sizes. Participants involved in the studies examined here employed a variety of speech tasks, and for a variety of epochs (see Table 1).
Table 1.
Descriptive characteristics for studies included in the present meta-analysis.
| Study | Speaking Task | Approximate Length (in minutes) | Patient/Control N | Patient Sex (% Male) | Control Sex (% Male) | Negative Symptoms ES |
|---|---|---|---|---|---|---|
| Rochester 1978 | Conversation | 3 | 40/20 | - | - | - |
| Resnick et al., 1984 | Conversation | 4 | 10/10 | 60% | 70% | - |
| Mandal et al., 1990 | Responding to Stimuli | 14 | 40/60 | 70% | 66% | - |
| Alpert et al., 1997 | Conversation | 5–10 | 19/20 | - | - | - |
| Alpert et al., 2000 | Autobiographical Narrative | 5 | 46/20 | 100% | 100% | 4.94 a |
| Cannizzaro et al., 2005 | Responding to Stimuli | 1.50 | 13/6 | 69% | 67% | - |
| Linscott et al., 2005 | Responding to Stimuli | Not specified | 20/26 | 80% | 54% | - |
| Cohen et al., 2008 | Autobiographical Narrative | 5 | 59/19 | 74% | 68% | 2.94 b |
| Tavano et al., 2008 | Responding to Stimuli | 0.5–2 | 37/37 | 30% | 43% | 4.57 c |
| St-Hilaire et al., 2008 | Conversation | 10 | 48/48 | 65% | 54% | 1.71 d |
| Lusignan et al., 2010 | Responding to Stimuli | Not specified | 8/7 | 93% | 87% | - |
| Perlini et al., 2012 | Responding to Stimuli | Not specified | 30/30 | 80% | 63% | - |
| Docherty, 2012 | Conversation | 10 | 110/23 | 57% | 52% | - |
Sum of SANS scores related to blunted affect,
Sum of SANS global scores,
Negative symptom factor from the BPRS (Lukoff et al., 1986),
Blunted affect item from the BPRS,
2.2 Acoustic Variables Examined
The studies examined here covered a wide range of acoustic variables. Variables related to speech production included: 1) total number of words spoken, 2) percentage of time talking, 3) words spoken per second, 4) average utterance length, 5) average pause length, 6) variability in pause time across the speech sample, 7) number of pauses, and 8) time to initiate speech from the beginning of the recording. Variables related to speech variability included: 1) inflection – defined in terms of variability of fundamental frequency (i.e., the lowest frequency originating from the vocal tract that defines the subjectively-defined vocal “pitch”), and 2) emphasis – defined in terms of variability of volume/intensity. At a conceptual level, speech production maps onto symptoms of alogia, whereas speech variability maps onto symptoms of blunted affect (Cohen et al., 2013; Cohen et al., 2014b). The units of measurement (e.g., milliseconds, seconds) varied across studies, but were consistent for all measures within studies. There is no reason to think that this contributed to potential variability in effect sizes reported across studies. For additional information on these variables, the reader is referred to Kent and Kim (2003), Cohen et al., (2014a) and Cohen et al., (2014b). Note that Cohen et al., (2014a) is a psychometric study of acoustic variables in nonpatient populations.
2.3 Analytic Strategy
We conducted both a qualitative and quantitative review of speech variables across studies. We computed d values for each variable from each study using MetaWin software (Rosenberg et al., 2000), and averaged them across studies. Our primary analysis of interest was in the overall magnitude of effect sizes reported, although secondary analysis evaluated the variability of effect sizes across studies and across speech variables, for example, comparing the effect size values for average utterance length versus average pause length. For the latter analyses, we had insufficient data for quantitative analysis (e.g., using heterogeneity statistics), so we employed qualitative analysis, in part, based on interpretation of effect size magnitude and directionality (Cohen, 1987). Qualitative analysis was also conducted to evaluate potential trends in mediating variables (speaking task, average age of sample, speaking time, sample size, sex) when possible. For studies reporting both clinical ratings of negative symptoms and acoustic data, a difference between their consequent effect size values was computed and inspected. For each d value, increasing values reflect the patient groups showing less speech production and less variability than the control group. For summary effect size statistics, individual values were weighted by the inverse of their d variance score such that values with less variability (presumably more closely reflecting their population values) were given more weight than values with more variability (Rosenberg et al., 2000). Random structure modeling was employed for all meta-analyses in this study.
3.0 Results
3.1 Summary Statistics
In total, 480 patients with schizophrenia and 326 nonpsychiatric controls were examined in this study. The samples were, with one exception, predominantly male. Only four studies reported negative symptom ratings, and the scales used across studies varied considerably, with two using the SANS and two using the Brief Psychiatric Rating Scale (Lukoff et al., 1986) – one of which reported only a single scale. Of note, the values were each in the large effect size range and quite dramatic, varying from 1.71 to 4.57 standard deviations.
Table 2 contains the data regarding speech production. The effect sizes tended to be in the expected direction (i.e., 21 of 22 values), but there was considerable variability across measures and studies. In total, nine effect sizes were in the large range, six were in the medium range, three were in the small range, three were in the negligible range and one was in the opposite direction than expected. Weighted average scores for each vocal measure (computed across studies) also showed considerable variability. Four of the summary measures showed small effect size level differences, one was in the medium range and three were in the large range. For the most part, there was notable variability across studies reporting common measures. An exception to this was average pause time, which was consistently disrupted in studies. Percent time talking and pause variability, both highly related to pause time, were also notably abnormal in patients – though the few data points obfuscates interpretation of these measures. The average d value for speech production measures across all studies was −.80. This number decreased to −.59 when the mean pause time and pause variability measures were excluded.
Table 2.
Effect sizes (d values) comparing patients with schizophrenia and nonpsychiatric controls on acoustic analysis variables presented as a function of study.
| SPEECH PRODUCTION | SPEECH VARIABILITY | |||||||||
|---|---|---|---|---|---|---|---|---|---|---|
| STUDY | Words N | % Time Talking | Words/Second | Average. Utterance Length | Average Pause | Pause SD | Pauses N | Latency of Response | Intonation | Emphasis |
| Rochester 1978 | - | - | - | - | −1.31 | - | - | - | - | - |
| Resnick et al., 1984 | - | - | - | - | −0.50 | - | - | - | - | - |
| Mandal et al., 1990 | - | - | - | −0.60 | - | - | - | −0.01 | - | - |
| Alpert et al., 1997 | - | - | - | - | −1.23 | - | - | −0.54 | - | - |
| Alpert et al., 2000 | - | −0.66 | - | - | - | - | - | - | −0.92 | 0.33 |
| Cannizzaro et al., 2005 | - | −1.70 | - | - | −1.90 | −2.56 | −0.20 | - | - | - |
| Linscott et al., 2005 | −0.15 | - | - | - | - | - | - | - | - | - |
| Cohen et al., 2008 | - | - | −0.28 | - | - | - | - | - | −0.49 | - |
| Tavano et al., 2008 | −0.88 | - | −0.50 | 0.42 | - | - | - | - | - | - |
| St-Hilaire et al., 2008 | −0.91 | - | - | - | - | - | - | - | - | - |
| Lusignan et al., 2010 | −1.86 | - | - | - | - | - | - | - | - | - |
| Perlini et al., 2012 | −0.41 | - | −0.68 | −1.01 | - | - | - | - | - | - |
| Docherty, 2012 | −0.07 | - | - | - | - | - | - | - | - | - |
| Summary Effect Sizes | −0.60 | −1.18 | −0.49 | −0.39 | −1.10 | −2.56 | −0.20 | −0.21 | −0.70 | 0.33 |
Note – Negative values denote patients showing less speech production/variability.
Table 2 also contains the data regarding speech variability. Only three effect sizes were reported in this literature; one of which was in the large effect size range, one that was medium, and one that was in the opposite direction as expected (i.e., patients showed increased emphasis compared to controls). In sum, no clear pattern in speech variability emerged, though there were insufficient data for proper evaluation. The aggregate d value for speech variability measures was −.36.
3.2 Discrepancy Between Symptom Ratings and Objective Measures
For the four studies employing both clinical ratings of negative symptoms and objective vocal analysis, we computed the magnitude of differences between these methodologies (computed as a weighted average of d values across variables across studies). Large effect sizes were noted in each study (i.e., differences in d were 3.39, 3.05, 4.25 and 0.80 for Alpert et al., 2000; Cohen et al., 2008; Tavano et al., 2008 and St-Hilaire et al., 2008 respectively. A summary of findings from this meta-analysis, anchored by the d values computed by Emmerson et al. (2009) and Mueser et al. (1994) as well as those reported in Hoekert et al. (2007), are plotted in Figure 2.
Figure 2.
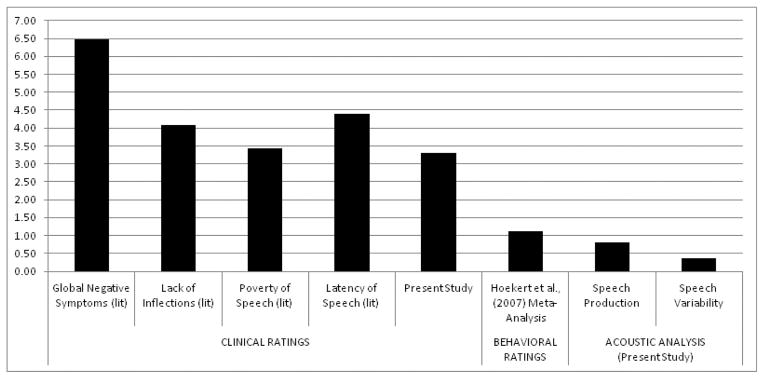
Summary of effect sizes comparing vocal expression in schizophrenia versus nonpsychiatric controls reported in the literature and in the present study, grouped by assessment domain
Notes: Increasing scores on the y-axis reflect abnormally higher vocal expression (i.e., patients versus controls); (lit) refers to comparison of data presented in Emmerson et al., (2009) and Mueser et al., (1994); “Hoekert et al., (2007)” refers to a prior meta-analysis examining behavioral-based ratings analysis of vocal expression in schizophrenia; “Present study” refers to effect sizes computed from the present meta-analysis.
3.3 Potential Moderating Variables
Qualitative inspection of the speech production data for moderating variables failed to reveal any trends. Studies examining conversational speech (k = 5, d = −.69) did not largely differ in aggregate vocal expression from those involving standardized stimuli or (k = 8; d = −.45). Moreover, there were no obvious relationships between magnitude of effect sizes and composition of the sample in terms of sex, age, sample size or in speaking time. Looking at group differences across all variables, the smallest effect sizes tended to be reported in Mandal et al. (1990), Docherty (2012) and Cohen et al. (2008) which had little in common. Conversely, the largest effect sizes were reported in Cannizzaro et al. (2005), Alpert et al. (1997) and Rochester (1978), studies that share no obvious similarity in speaking task or speaking time. That being said, conclusions regarding moderating variables are premature due to the limited number of studies, the overrepresentation of men in these studies and the lack of formal statistical analysis.
4.0 Discussion
This study evaluated the literature employing objective acoustic analysis in schizophrenia. Despite evidence that: 1) at the group level, patients with schizophrenia are rated by trained experts as having profound vocal deficits, and 2) large effect sizes are generally reported in studies employing behavior-based coding strategies, findings from this meta-analysis suggest that the actual magnitude of deficits observed in terms of objective assessment are more modest, at least, on the whole. Importantly, there was variability across studies in effect sizes reported, and variability across different aspects of vocal expression. In answer to the question “What do we objectively know about vocal expression in schizophrenia”, it appears safe to say that, based on the emerging literature, only certain aspects of vocal expression appears to be affected (i.e., average pause length) at a large effect size level. Moreover, the present literature lacks evidence that any aspect of vocal expression, at least defined using objective acoustic analysis, is abnormal to any commensurate degree as reported in studies employing symptom rating scales.
The nature of the dramatic disparity between negative symptoms rated by trained clinicians and those assessed objectively is unclear. While it is the case that schizophrenia is a heterogeneous disorder and it is highly unlikely that vocal deficits occur in all or even most patients, one cannot ignore the large differences in how patients with schizophrenia, as a group, are rated in vocal expression compared to controls. This was observed in both large-scale studies from the literature and from the studies examined here. One could argue that these effect sizes are artificially inflated because symptom rating scales are not meant for use in healthy populations. Certainly, symptom rating scales of vocal expression may be difficult to apply to nonpsychiatric populations because of their ordinal scaling nature, as well as due to ambiguity, complexity (e.g., tapping multiple constructs), lack of consideration of context and other issues with their operational definitions. For these same reasons however, it would seem that these symptom rating scales are difficult to apply to psychiatric populations; perhaps more difficult in that establishing “normal” expression has yet to be done. How can one rate behavior as being “abnormal” when “normal” is not clear? Adequate reliability is often achieved with symptom rating scales, however convergent validity issues have been documented in that symptom ratings of expression are, at best, only modestly related to objective measures of the intended behavior and are often similarly related to other behaviors (e.g., Alpert et al., 1995, Alpert et al., 2002, Cohen et al., 2008). While symptom ratings are critically important to both psychiatric/psychological research and practice, the discrepancy between symptom rating scales and objective measure highlights a serious validity concern of symptom rating scales, and the need for objective measures to complement them.
Clearly, the current literature on objective analysis of speech is modest, and more research is needed to properly understand the nature of speech deficits in schizophrenia. Most studies reviewed in the article focused on narrow aspects of vocal expression, and this limited the conclusions that could be drawn. Given that vocal expression is a highly complicated and likely multidimensional construct, it seems important for future researchers to clarify which aspects of vocal expression are most pertinent to schizophrenia pathology – perhaps achieving consensus about which variables should be reported and examined (e.g., Insel et al., 2010). Failing a consensus, it would be important for researchers to report data on a wide array of speech production and speech variability measures. The present findings suggest pause length is a particularly important variable for future studies. Interestingly, there is research to suggest that negative symptom ratings are unduly influenced by patients pauses, and that by manipulating pause length, clinicians tend to rate other negative symptoms as more severe (Alpert et al., 1995). Thus, pauses may be a particularly important feature clinicians (often inappropriately) use to assess negative symptom severity. At the same time, there is limited evidence at this time to suggest that blunted vocal affect, at least, as measured using global measures of variability in fundamental frequency and intensity, are important to schizophrenia. In large part, this reflected the fact that few studies reviewed here measured blunted vocal affect. Moreover, there was notable inconsistency in findings across these studies. Nonetheless, the lack of group differences even in these few studies is surprising, as flattened, monotonic voice is considered a hallmark feature of negative symptoms. It is possible that the measures employed in prior studies were not sufficiently sensitive or tapped an aspect of vocal expression that was relatively normal. Finally, it is important for future research to employ nonpatient control groups for comparison. The literature search employed in this study revealed a relatively large number of studies applying acoustic analysis to understand vocal deficits in schizophrenia – though the vast majority of these studies failed to include a control group – a limitation that essentially yields the raw data uninterruptable in relation to other studies.
The present literature was insufficient to consider how vocal expression may change as a function of environmental, speaking task and other contextual demands. This is important to consider in future research, particularly as acoustic analysis offers the ability to understand contextual effects on expression in a way that symptom rating scales cannot. The variability in these demands across studies likely contributed to the variability in vocal expression. Interestingly, there is evidence to suggest that “online” cognitive resources are important for producing speech in healthy adults (Barch and Berenbaum, 1994; Cohen et al., 2014a), and that restriction of these resources increases negative thought disorder in patients with schizophrenia (Barch and Berenbaum, 1997; Melinder and Barch, 2003) and in psychiatric patients more broadly (Cohen et al., 2014b). Thus, cognitive resources, which are notably impaired in patients with schizophrenia, may be a mechanistically important factor for understanding vocal deficits. No doubt other contextual factors exist, such as emotional states and traits (e.g., hostility, depression, positive affectivity), social skill, social cognition, medications, illicit and licit substance use and physiological arousal. These factors would be important to examine in future research.
In summary, the present study highlights our poor understanding of vocal expression in schizophrenia, and potential problems in our understanding of psychiatric symptoms more generally. In short, symptom rating scales of vocal expression appear to inaccurately reflect the true severity of their constructs; and these concerns likely generalize to symptom ratings of other behaviors as well. Objective analysis, for example, using acoustic analysis of speech, appears to be a promising method of measuring these symptoms. Moreover, with increased attention to defining psychopathology in terms of specific mechanisms rather than syndromes (e.g., Insel et al., 2010), acoustic analysis offers considerable promise for identifying a homogeneous subset of patients that transcends traditional diagnosis (e.g., schizophrenia). The literature examined here was by no means adequate for understanding how vocal deficits manifest in schizophrenia, and it would appear methodological obstacles must be overcome before conclusions can be reached. Of particular note, there is much work to do in determining the most appropriate vocal proxies of these symptoms, in understanding the endogenous and exogenous factors that ameliorate and exacerbate them, and in adapting them to patient care.
Acknowledgments
Funding: Funding for this study was provided by a Louisiana Board of Regents and National Institute of Mental Health (R03 MH092622) grant to the primary author. The funding agencies had no further role in study design; in the collection, analysis and interpretation of data; in the writing of the report; and in the decision to submit the paper for publication.
The authors wish to acknowledge the NIMH for funding this study, and to the anonymous reviewers for their helpful comments.
Footnotes
Contributors. Alex S Cohen was the primary investigator for this project and designed the study and wrote the bulk of the manuscript. Kyle Mitchell and Brita Elvevåg helped manage the literature searches, the analyses and provided conceptual material to the planning and presentation of this project. All authors contributed to and have approved the final manuscript.
Conflicts of Interest: There are no conflicts of interest to report.
Publisher's Disclaimer: This is a PDF file of an unedited manuscript that has been accepted for publication. As a service to our customers we are providing this early version of the manuscript. The manuscript will undergo copyediting, typesetting, and review of the resulting proof before it is published in its final citable form. Please note that during the production process errors may be discovered which could affect the content, and all legal disclaimers that apply to the journal pertain.
Contributor Information
Alex S. Cohen, Department of Psychology, Louisiana State University
Kyle Mitchell, Department of Psychology, Louisiana State University.
Brita Elvevåg, Psychiatry Research Group, Department of Clinical Medicine, University of Tromsø & The Norwegian Centre for Integrated Care and Telemedicine (NST), University Hospital of North Norway, Tromsø, Norway.
References
- Alpert M, Kotsaftis A, Pouget ER. At issue: speech fluency and schizophrenic negative signs. Schizophr Bull. 1997;23(2):171–177. doi: 10.1093/schbul/23.2.171. [DOI] [PubMed] [Google Scholar]
- Alpert M, Pouget ER, Silva R. Cues to the assessment of affects and moods: speech fluency and pausing. Psychopharmacol Bull. 1995;31(2):421–424. [PubMed] [Google Scholar]
- Alpert M, Rosenberg SD, Pouget ER, Shaw RJ. Prosody and lexical accuracy in flat affect schizophrenia. Psychiatry Res. 2000;97(2–3):107–118. doi: 10.1016/s0165-1781(00)00231-6. [DOI] [PubMed] [Google Scholar]
- Alpert M, Shaw RJ, Pouget ER, Lim KO. A comparison of clinical ratings with vocal acoustic measures of flat affect and alogia. J Psychiatr Res. 2002;36(5):347–353. doi: 10.1016/s0022-3956(02)00016-x. [DOI] [PubMed] [Google Scholar]
- Andreasen NC. The scale for the assessment of negative symptoms (SANS) The University of Iowa; Iowa City, IA: 1984. [Google Scholar]
- American Psychiatric Association. Diagnostic and statistical manual of mental disorders. 5. Arlington, VA: American Psychiatric Publishing; 2013. [Google Scholar]
- Barch D, Berenbaum H. The relationship between information processing and language production. Journal of Abnormal Psychology. 1994;103(2):241–251. doi: 10.1037//0021-843x.103.2.241. [DOI] [PubMed] [Google Scholar]
- Barch DM, Berenbaum H. The effect of language production manipulations on negative thought disorder and discourse coherence disturbances in schizophrenia. Psychiatry Research. 1997;71(2):115–127. doi: 10.1016/s0165-1781(97)00045-0. [DOI] [PubMed] [Google Scholar]
- Buchanan RW. Persistent negative symptoms in schizophrenia: An overview. Schizophrenia Bulletin. 2007;33(4):1013–1022. doi: 10.1093/schbul/sbl057. [DOI] [PMC free article] [PubMed] [Google Scholar]
- Cannizzaro MS, Cohen H, Rappard F, Snyder PJ. Bradyphrenia and bradykinesia both contribute to altered speech in schizophrenia: a quantitative acoustic study. Cognitive and behavioral neurology: official journal of the Society for Behavioral and Cognitive Neurology. 2005;18(4):206–210. doi: 10.1097/01.wnn.0000185278.21352.e5. [DOI] [PubMed] [Google Scholar]
- Cohen AS, Alpert M, Nienow TM, Dinzeo TJ, Docherty NM. Computerized measurement of negative symptoms in schizophrenia. J Psychiatr Res. 2008;42(10):827–836. doi: 10.1016/j.jpsychires.2007.08.008. [DOI] [PMC free article] [PubMed] [Google Scholar]
- Cohen AS, Dinzeo TJ, Donovan NJ, Brown CE, Morrison SC. Unpublished Results. 2014a. Vocal acoustic analysis as a biometric indicator of information processing: Implications for neurological and psychiatric disorders. [DOI] [PMC free article] [PubMed] [Google Scholar]
- Cohen AS, Elvevåg B. Automated computerized analysis of speech in psychiatric disorders. Current Opinion in Psychiatry. 2014;27(3):203–209. doi: 10.1097/YCO.0000000000000056. [DOI] [PMC free article] [PubMed] [Google Scholar]
- Cohen AS, Hong SL, Guevara A. Understanding emotional expression using prosodic analysis of natural speech: refining the methodology. J Behav Ther Exp Psychiatry. 2010;41(2):150–157. doi: 10.1016/j.jbtep.2009.11.008. [DOI] [PubMed] [Google Scholar]
- Cohen AS, Kim Y, Najolia GM. Psychiatric symptom versus neurocognitive correlates of diminished expressivity in schizophrenia and mood disorders. Schizophr Res. 2013;146(1–3):249–253. doi: 10.1016/j.schres.2013.02.002. [DOI] [PMC free article] [PubMed] [Google Scholar]
- Cohen AS, McGovern JE, Dinzeo TJ, Covington MA. Unpublished Results. 2014b. Speech Deficits in Serious mental Illness: A Neurocognitive Resource Issue. [DOI] [PMC free article] [PubMed] [Google Scholar]
- Cohen AS, Minor KS, Najolia GM, Lee Hong S. A laboratory-based procedure for measuring emotional expression from natural speech. Behav Res Methods. 2009;41(1):204–212. doi: 10.3758/BRM.41.1.204. [DOI] [PubMed] [Google Scholar]
- Cohen J. Statistical power analysis for the behavioral sciences (rev. ed.) Lawrence Erlbaum Associates, Inc; 1987. [Google Scholar]
- Docherty NM. Missing referents, psychotic symptoms, and discriminating the internal from the externalized. J Abnorm Psychol. 2012;121(2):416–423. doi: 10.1037/a0026348. [DOI] [PubMed] [Google Scholar]
- Emmerson LC, Ben-Zeev D, Granholm E, Tiffany M, Golshan S, Jeste DV. Prevalence and longitudinal stability of negative symptoms in healthy participants. Int J Geriatr Psychiatry. 2009;24(12):1438–1444. doi: 10.1002/gps.2284. [DOI] [PubMed] [Google Scholar]
- Hoekert M, Kahn RS, Pijnenborg M, Aleman A. Impaired recognition and expression of emotional prosody in schizophrenia: review and meta-analysis. Schizophr Res. 2007;96(1–3):135–145. doi: 10.1016/j.schres.2007.07.023. [DOI] [PubMed] [Google Scholar]
- Insel T, Cuthbert B, Garvey M, Heinssen R, Pine DS. Research Domain Criteria (RDoC): Toward a New Classification Framework for Research on Mental Disorders. Am J Psychiatry. 2010;167(7):748–751. doi: 10.1176/appi.ajp.2010.09091379. [DOI] [PubMed] [Google Scholar]
- Kent RD, Kim YJ. Toward an acoustic typology of motor speech disorders. Clinical linguistics & phonetics. 2003;17(6):427–445. doi: 10.1080/0269920031000086248. [DOI] [PubMed] [Google Scholar]
- Kirkpatrick B, Buchanan RW, McKenney PD, Alphs LD, Carpenter WT., Jr The schedule for the deficit syndrome: An instrument for research in schizophrenia. Psychiatry Research. 1989;30:119–123. doi: 10.1016/0165-1781(89)90153-4. [DOI] [PubMed] [Google Scholar]
- Kirkpatrick B, Galderisi S. Deficit schizophrenia: an update. World Psychiatry. 2008;7(3):143–147. doi: 10.1002/j.2051-5545.2008.tb00181.x. [DOI] [PMC free article] [PubMed] [Google Scholar]
- Kirkpatrick B, Strauss GP, Nguyen L, Fischer BA, Daniel DG, Cienfuegos A, Marder SR. The brief negative symptom scale: psychometric properties. Schizophr Bull. 2011;37(2):300–305. doi: 10.1093/schbul/sbq059. [DOI] [PMC free article] [PubMed] [Google Scholar]
- Kring AM, Gur RE, Blanchard JJ, Horan WP, Reise SP. The Clinical Assessment Interview for Negative Symptoms (CAINS): final development and validation. Am J Psychiatry. 2013;170(2):165–172. doi: 10.1176/appi.ajp.2012.12010109. [DOI] [PMC free article] [PubMed] [Google Scholar]
- Lukoff D, Nuechterlein KH, Ventura J. Manual for the Expanded Brief Psychiatric Rating Scale (BPRS) Schizophrenia Bulletin. 1986;12:594–602. [Google Scholar]
- Mandal MK, Srivastava P, Singh SK. Paralinguistic characteristics of speech in schizophrenics and depressives. J Psychiatr Res. 1990;24(2):191–196. doi: 10.1016/0022-3956(90)90059-y. [DOI] [PubMed] [Google Scholar]
- Melinder MRD, Barch DM. The Influence of a Working Memory Load Manipulation on Language Production in Schizophrenia. Schizophrenia Bulletin. 2003;29(3):473–485. doi: 10.1093/oxfordjournals.schbul.a007020. [DOI] [PubMed] [Google Scholar]
- Mueser KT, Sayers SL, Schooler NR, Mance RM, Haas GL. A multisite investigation of the reliability of the Scale for the Assessment of Negative Symptoms. Am J Psychiatry. 1994;151(10):1453–1462. doi: 10.1176/ajp.151.10.1453. [DOI] [PubMed] [Google Scholar]
- National Institute of Mental Health. 2014 Jan; Retrieved from http://www.nimh.nih.gov/research-priorities/rdoc/nimh-research-domain-criteria-rdoc.shtml. [PubMed]
- Rochester SR. Are language disorders in acute schizophrenia actually information processing problems? J Psychiatr Res. 1978;14(1–4):275–283. doi: 10.1016/0022-3956(78)90030-4. [DOI] [PubMed] [Google Scholar]
- Rosenberg MS, Adams DC, Gurevitch J. MetaWin: Statistical Software for Meta-Analysis. Sinauer Associates, Inc; Sunderland, Massachusetts: 2000. [Google Scholar]
- St-Hilaire A, Cohen AS, Docherty NM. Emotion word use in the conversational speech of schizophrenia patients. Cogn Neuropsychiatry. 2008;13(4):343–356. doi: 10.1080/13546800802250560. [DOI] [PubMed] [Google Scholar]
- Tavano A, Sponda S, Fabbro F, Perlini C, Rambaldelli G, Ferro A, Cerruti S, Tansella M, Brambilla P. Specific linguistic and pragmatic deficits in Italian patients with schizophrenia. Schizophr Res. 2008;102(1–3):53–62. doi: 10.1016/j.schres.2008.02.008. [DOI] [PubMed] [Google Scholar]