

Abstract
Objective
To examine the effect of the recession on the financial performance of safety-net versus non-safety-net hospitals.
Data Sources/Study Setting
Agency for Healthcare Research and Quality Hospital Cost and Utilization Project State Inpatient Databases, Medicare Cost Reports, American Hospital Association Annual Survey, InterStudy, and Area Health Resource File.
Study Design
Retrospective, longitudinal panel of hospitals, 2007–2011. Safety-net hospitals were identified using percentage of patients who were Medicaid or uninsured. Generalized estimating equations were used to estimate average effects of the recession on hospital operating and total margins, revenues and expenses in each year, 2008–2011, comparing safety-net with non-safety-net hospitals.
Data Collection/Extraction Methods
1,453 urban, nonfederal, general acute hospitals in 32 states with complete data.
Principal Findings
Safety-net hospitals, as identified in 2007, had lower operating and total margins. The gap in operating margin between safety-net and non-safety-net hospitals was sustained throughout the recession; however, total margin was more negatively affected for non-safety-net hospitals in 2008. Higher percentages of Medicaid and uninsured patients were associated with lower revenue in private hospitals in all years, and lower revenue and expenses in public hospitals in 2011.
Conclusions
Safety-net hospitals may not be disproportionately vulnerable to macro-economic fluctuations, but their significantly lower margins leave less financial cushion to weather sustained financial pressure.
Keywords: Hospital safety-net, financial performance, recession
In the U.S. health care system, where many patients are uninsured or underinsured, safety-net hospitals play a critical role in providing access to care (Gaskin and Hadley 1999; Hadley and Cunningham 2004). Safety-net hospitals—primarily public and private, not-for-profit hospitals—are defined as having both of the following characteristics: (1) a mandate or mission to provide care to all patients, regardless of ability to pay, and (2) a substantial proportion of patients who are uninsured, Medicaid-enrolled, or otherwise vulnerable (Institute of Medicine 2000). Vulnerable patients seek access to primary care in safety-net hospital emergency departments and outpatient clinics (Felland, Hurley, and Kemper 2008). Safety-net hospitals are also more likely to provide certain high-cost, low-margin specialty services such as trauma care, burn care, psychiatric care, and pediatric or neonatal intensive care that benefit not only vulnerable populations but also whole communities (Gaskin 1999).
Because of their role in providing widespread access, safety-net hospitals’ financial viability has been an ongoing concern (Institute of Medicine 2000). Previous studies have shown mixed results regarding the effect of market and policy variables on safety-net hospitals’ financial performance; however, studies agree that safety-net hospitals, on average, have lower baseline levels of financial performance as compared to non-safety-net hospitals. Using two definitions of safety-net status (expense burden and market share), Zuckerman et al. (2001) classified all urban, nonfederal, short-term general hospitals into four mutually exclusive groups using 1990 data on bad debt and charity care. Descriptive analysis showed that growing managed care penetration and declining reimbursement from 1990 to 1997 led to greater declines in total margins for safety-net hospitals than for non-safety-net hospitals, despite growth in revenue during the same period. In a follow-up study, Bazzoli et al. (2005) found, similarly, that despite reversals in some of the planned Medicare and Medicaid Disproportionate Share Hospital (DSH) payment cuts proposed under the 1997 Balanced Budget Act (BBA), hospitals providing the greatest amounts of uncompensated care showed no improvement in total margins between 1996 and 2002.
In contrast, a study of 2,300 hospitals in 1995 found no disproportionate effects of managed care on the financial performance of public hospitals relative to private hospitals (Clement and Grazier 2001). Similarly, a longitudinal study of acute care hospitals from 1990 to 1999 showed that over time, safety-net status was not associated with disproportionate changes in total margin relative to other hospitals. The authors did, however, find that hospitals serving lower socioeconomic status patients (SES) and greater shares of Medicaid patients had lower total profit margins overall and may have reduced operating expenditures over time (Zwanziger, Khan, and Bamezai 2010).
While safety-net hospitals have been shown to survive difficult market and policy environments, studies have suggested that this is a result of both the availability of subsidies and deliberate actions on the part of safety-net providers. Bazzoli et al. (2006) found that, as financial pressures mounted following the BBA, core and voluntary safety-net hospitals reduced uncompensated care. In contrast, Felland et al. (2003) found that, in nine of twelve communities that were part of the Community Tracking Study, the capacity and viability of safety-net providers strengthened over the period 1996–2001. The strengthening was achieved through strategies such as integration, eliminating inefficiency, and attracting insured patients. Access to DSH funds, state or local charity subsidies, and tobacco settlement or tax dollars also helped bolster the strength of the safety-net in these communities (Felland et al. 2003). More recently, the Community Tracking Study found that as demand for safety-net services increased, hospitals were employing strategies more commonly found among private hospitals. For example, safety-net hospitals were upgrading facilities, growing more profitable services, and attracting patients with more generous insurance coverage (Cunningham, Bazzoli, and Katz 2008).
Although previous studies have demonstrated the ability of safety-net hospitals to make strategic and operational changes in response to policy or market pressures, the great recession that began in late December 2007 and persisted through June 2009 (NBER Business Cycle Dating Committee 2011) may have challenged the financial viability of safety-net hospitals across the nation. The purpose of this study was to examine how safety-net hospitals fared financially compared with other hospitals during the recession.
Conceptual Framework
Previous studies have shown that determinants of hospital profitability generally fall into four broad categories: (1) organizational characteristics, such as teaching status, size, or ownership; (2) managerial decisions, such as financing or service mix; (3) patient mix measures, such as Medicaid, uncompensated care, or case mix; and (4) market characteristics, such as area income levels or hospital competition (Gapenski, Vogel, and Langland-Orban 1993; Gautam, Campbell, and Arrington 1996; Younis, Rice, and Barkoulas 2001).
Among these factors, there are several attributes unique to safety-net hospitals that may contribute to their financial vulnerability. First, safety-net hospitals serve a high percentage of Medicaid patients, and Medicaid payment rates are mostly lower than those of Medicare and private insurance. If the payment rate is inadequate to cover the costs of providing services to Medicaid patients, revenue shortfalls occur. Second, the level of uncompensated care, which includes both charity care (i.e., services provided to the uninsured) and bad debt, tends to be higher in safety-net hospitals than in other hospitals. If the costs of these services cannot be covered by other sources of revenue, the hospital's financial viability can be in jeopardy. Finally, safety-net hospitals are heavily reliant on federal, state, and local government subsidies to cover the costs of care provided to indigent populations. Reductions in these funding sources can significantly erode the revenue base of a safety-net hospital.
The recession may have affected all these factors and led to lower overall financial performance in safety-net hospitals. First, the recession may have affected patient mix. Increases in unemployment during the recession led to loss of private insurance coverage, especially among higher-income populations (Cawley, Moriya, and Simon 2013). This loss of private insurance may have limited safety-net hospitals’ ability to target patients with more generous insurance coverage; a strategy they had been pursuing prior to the start of the recession (Cunningham, Bazzoli, and Katz 2008). At the same time private insurance was declining, Medicaid enrollments grew (Gordon 2012). For many safety-net hospitals, particularly those that are publicly owned, Medicaid accounts for 25 to over 50 percent of the hospital's revenue (Bachrach, Braslow, and Karl 2012). While growth in Medicaid has the potential to increase available reimbursement, it also gives patients options to seek care at non-safety-net providers (Gaskin, Hadley, and Freeman 2001). The concurrent loss of private insurance coverage and increase in Medicaid likely had complex, possibly competing effects on safety-net hospitals; however, on average, it has been shown that demand for safety-net services grew during the recession and much of the growth was among the uninsured (Felland et al. 2010). This led to our first hypothesis:
H1: During the recession, operating margin declined more for safety-net hospitals than for non-safety-net hospitals.
In addition, for state and local governments across the nation, the economic downturn resulted in significant declines in income and property taxes (Gordon 2012). This drop in revenue strained state and local budgets, and therefore the ability of governments to provide financial support to the safety-net. In 2004, prior to the recession, supplemental payments to safety-net hospitals had begun to increase, raising once negative operating margins to a positive 5 percent on average by 2007 (National Association of Public Hospitals and Health Systems 2011b). A recent study by Kane et al. (2012) underscored the importance of state and local government subsidies to the financial health of safety-net hospitals. Within the most competitive hospital markets, the authors found higher operating and total margins among safety-net hospitals governed directly by elected officials, simply because these hospitals were in better positions to obtain tax and DSH subsidies (Kane et al. 2012). If the recession eroded these subsidies, then we would expect the financial performance of safety-net hospitals to decline more than in other hospitals.
Felland et al. (2010) found that in five metropolitan communities, federal stimulus aid provided as part of the February 2009 American Recovery and Reinvestment Act helped offset the effects of state and local budget shortfalls; however, in most cases these funds did not directly flow to safety-net hospitals. Rather, these funds kept safety-net hospitals from feeling the effects of even greater state budget cuts (Felland et al. 2010). As total margin includes all sources of revenue, including subsidies, the effects of the recession on subsidies should be evident in total margin. This led to our second hypothesis:
H2: During the recession, total margin declined more for safety-net hospitals than for non-safety-net hospitals.
To test our hypotheses, our primary analysis modeled hospital financial performance as a function of characteristics and factors known to be associated with hospital profitability, and included a dummy variable for each year of the recession. To examine differences between safety-net and non-safety-net hospitals, we identified hospitals as safety-net providers using discharge data from 2007 and interacted “safety-net status” in 2007 with each year of the recession.
While the effect of being a safety-net hospital just prior to the recession was of primary interest, previous studies have shown that there is no single way to define safety-net hospitals. Moreover, the unique characteristics of safety-net hospitals suggest the possibility for nuanced effects of the recession based on the actual volume or “exposure” of hospitals to uninsured and Medicaid patients over time. To identify differential effects of the recession based on any variations in safety-net activities over time, we conducted a secondary analysis in which we interacted a continuous measure of the annual percentage of Medicaid and uninsured patients in each hospital (“safety-net intensity”) with each year of the recession and included an indicator of public versus private ownership.
Data and Empirical Methods
Data and Sample
Data on hospital utilization and payer were drawn from the Agency for Healthcare Research and Quality Healthcare Cost and Utilization Project (HCUP) State Inpatient Databases (SID). These data were combined with hospital financial data from the Centers for Medicare and Medicaid Services Medicare Cost Report, and hospital characteristics from the American Hospital Association Annual Survey. Data on HMO penetration in 2006 came from InterStudy. Finally, market characteristics were obtained from the Area Health Resource File.
The study sample consisted of a balanced panel of urban, nonfederal, general acute care hospitals in 32 states with complete data over the period of 2007–2011. Urban location included metropolitan and micropolitan areas in accordance with the latest definition of Core Based Statistical Area (CBSA) (Office of Management and Budget 2013). Critical access hospitals and hospitals with 25 beds or less were excluded, as were hospitals that did not operate continuously throughout the 5-year study period. Finally, hospitals with multiple-to-one matches between the SID and the Medicare Cost Report were excluded. These were hospitals that were reported as individual entities in the SID, but consolidated into a single, larger entity in the Medicare Cost Report (for example, at the system level). The final study sample included 7,265 hospital-year observations from 1,453 unique hospitals.
Financial Performance Measures
We used six hospital financial measures as outcome variables. The first two were profitability ratios reflecting the ability of the organization to generate revenue and control expenses. Operating margin was defined as the difference between operating revenue and operating expenses divided by operating revenue, and measured the profitability of the hospital's core operating activities (typically patient care and related activities). Total margin was defined as the difference between total revenue and total expenses divided by total revenue, and measured the profitability of all of the hospital's activities, including the effects of financial investments, contributions, and subsidies (McKay and Gapenski 2009). As operating and total margin are ratios, they were included untransformed in our analysis.
In addition, we examined the components of these ratios. The remaining four outcome measures included the following: (1) operating revenue, which included revenue from patient care and other operating activities but excluded revenue obtained from charitable contributions, investment income, and other noncore activities; (2) total revenue, which included all sources of revenue; (3) operating expenses, which reflected expenses incurred to produce operating revenue; and (4) total expenses. Revenues and expenses were converted to constant dollars using the GDP Deflator (U.S. Department of Commerce Bureau of Economic Analysis 2014) and were measured per adjusted patient day, where inpatient days were adjusted to reflect outpatient activity using the method outlined by the American Hospital Association (AHA Data Viewer 2014). Revenue and expense values were log-transformed so that coefficients reflected semi-elasticities (proportional differences).
Safety-Net Measures
The key explanatory variable in this study was a dummy variable indicating hospital safety-net status as measured in 2007. There are multiple ways to quantify the key attributes of safety-net hospitals as defined by the Institute of Medicine (2000), including Medicaid caseload, uncompensated care burden, DSH index, and facility characteristics such as public ownership and teaching status (Zwanziger and Khan 2008; McHugh, Kang, and Hasnain-Wynia 2009). However, many of these measures have limitations. For example, uncompensated care also includes bad debt from privately insured patients, which is different from charity care. The DSH index covers only Medicaid patients and the dual-eligible component of the Medicare population; it does not capture the uninsured. Finally, facility characteristics like public and major teaching hospitals exclude other hospitals that also share the mission of serving vulnerable populations.
In this study, we took advantage of the HCUP all-payer data that captured all discharges from each participating hospital. In our primary analysis, we identified safety-net versus non-safety-net hospitals (safety-net status) based on the percentage of total patients who were covered by Medicaid or uninsured in 2007. Hospitals falling within the top quartile of the measure in 2007 were classified as safety-net providers throughout the study period. In a secondary analysis, in lieu of 2007 safety-net status, we included continuous annual measures of the percentage of patients covered by Medicaid or uninsured (safety-net intensity) for each hospital.
Control Variable Measures
Control variables included hospital and market characteristics. Hospital characteristics included size, as measured by the number of beds; ownership, including public, private not-for-profit, and private for-profit; teaching status, as measured by major teaching, minor teaching or nonteaching; system affiliation (yes/no); outpatient volume, measured by the number of visits; and patient severity of illness, where high severity was defined by APR-DRG severity of illness levels 3 and 4 from the HCUP data.
Market characteristics were measured at the CBSA level. Compared with a county-level definition, this could mean less variation in hospital concentration and managed care penetration. Nevertheless, it has the advantage of providing a broader market area to capture all potential competitors, and the distribution of hospital concentration is less skewed. Wong et al. found a high correlation among hospital competition measures constructed by a number of different market definitions—fixed geopolitical boundaries (e.g., county, MSA), fixed radius, variable radius, and patient flow (Wong, Zhan, and Mutter 2005).
Hospital concentration was measured by the Herfindahl-Hirschman Index (HHI), computed as the sum of squared market shares of all competing hospitals within a CBSA. We used hospital discharge counts derived from the HCUP data to calculate market share that reflected the actual amount of services/output provided by each hospital within a CBSA. Managed care penetration was measured as the percentage of the population in the CBSA enrolled in HMOs. Finally, county-level median household income and unemployment rate were obtained from the Area Health Resource File and aggregated to the CBSA level.
Models and Estimation
We employed multivariate analysis to examine the relationship between safety-net activities and the various measures of hospital financial performance during the recession. In our primary analysis, we specified a model to assess differences between safety-net and nonsafety-net hospitals in operating and total margins during the 5-year study period, where safety-net status was defined in 2007 (the base year). The model was specified as follows:
| (1) |
where yit represents operating or total margin for hospital i in year t. Yeart is a vector of dummy variables representing each of the study years. SN2007 is a hospital's safety-net status in 2007. Hospitalit represents a vector of hospital characteristics to control for potentially confounding factors. Marketit reflects a vector of market characteristics. μi represents a hospital-specific error term and εit is the random error. The interaction between a hospital's safety-net status in 2007 and year measured the effect of being a safety-net hospital in each of the study years on the outcome of interest. Baseline differences between safety-net and non-safety-net hospitals were controlled for by the safety-net indicator in 2007.
In a secondary analysis, we specified a model to measure the yearly effects of variation in safety-net intensity on the six financial measures as shown below:
| (2) |
where SNit is a hospital's safety-net intensity in each year and the yearly effects of variation in safety-net intensity are captured by the interaction term between the continuous safety-net intensity variable and year.
For each model, we first examined potential collinearity among the independent variables. In our estimation of both models 1 and 2, we dropped hospital size and teaching status due to their high correlation with safety-net status. In model 1, we excluded ownership for the same reason. In our estimation of model 2, we included public versus private ownership, as well as the interaction of ownership with our other control variables. A number of variables, including outpatient volume, HMO penetration, unemployment rate, revenues, and expenses were log-transformed. The residual plot of each model revealed no issues of non-normality or heteroskedasticity.
We estimated our models using both random effects and generalized estimating equations (GEE) to control for correlation of the error terms within hospitals over time. Both estimation methods produced similar results; thus, we present results from the GEE models.
Results
Table1 presents descriptive statistics on all study variables averaged over the period 2007–2011. Statistics are presented for safety-net and non-safety-net hospitals, where safety-net hospitals are defined as those whose percentage of total patients that are Medicaid or uninsured falls in the top quartile of all hospitals in the sample in 2007. The average percentage of Medicaid and uninsured patients was 42.4 for safety-net hospitals versus 20.4 for non-safety-net hospitals. Nearly 25 percent of the safety-net hospitals were publicly owned versus only about 9 percent of the non-safety-net hospitals, and this difference was statistically significant. More of the safety-net hospitals had fewer than 150 beds or 450 beds and more as compared to non-safety-net hospitals (43.7 percent vs. 39.7 percent, and 13.3 percent vs. 9.0 percent). Also, more of the safety-net hospitals were major teaching hospitals (16.4 percent vs. 7.5 percent). Fewer safety-net hospitals were system-affiliated and fewer had high-severity patients relative to non-safety-net hospitals. Safety-net hospitals had lower operating and total margins relative to non-safety-net hospitals (−2.9 percent and 2.5 percent vs. 1.1 percent and 4.4 percent, respectively) and lower revenues per adjusted patient day. No statistically significant differences were found in expenses per adjusted patient day. Finally, relative to non-safety-net hospitals, safety-net hospitals appeared to operate in slightly less competitive markets, and in areas where household incomes were lower and unemployment was higher.
Table 1.
Descriptive Statistics for Study Hospitals, Average over Five Years (2007–2011)
| Safety-Net Hospitals† | Non-Safety-Net Hospitals | |
|---|---|---|
| No. of hospitals (total = 1,453) | 364 | 1,089 |
| Medicaid and uninsured patient load (%) | 42.4 | 20.4*** |
| Hospital characteristics | ||
| Ownership (%) | ||
| Public | 24.2 | 8.9*** |
| Private, not-for-profit | 54.1 | 75.0 |
| Private, for-profit | 21.7 | 16.1 |
| Size (%) | ||
| Small (<150 beds) | 43.7 | 39.7*** |
| Medium (150–449) | 43.0 | 51.4 |
| Large (450 and more) | 13.3 | 9.0 |
| Teaching status (%) | ||
| Major teaching | 16.4 | 7.5*** |
| Minor teaching | 20.9 | 26.8 |
| Nonteaching | 62.7 | 65.8 |
| System affiliation (%) | 63.4 | 67.1** |
| High-severity patients (%) | 24.6 | 28.4*** |
| Outpatient visits (#) | 186,532 | 199,280* |
| Financial measures | ||
| Operating margin (%) | −2.9 | 1.1*** |
| Total margin (%) | 2.5 | 4.4*** |
| Operating revenues ($)‡ | 2,299.1 | 2,383.2*** |
| Total revenues ($)‡ | 2,452.5 | 2,517.0* |
| Operating expenses ($)‡ | 2,350.9 | 2,342.8 |
| Total expenses ($)‡ | 2,380.8 | 2,388.6 |
| Market characteristics | ||
| Hospital concentration | 0.34 | 0.31** |
| HMO penetration§ (%) | 23.7 | 23.9 |
| Median household income | 49,492.3 | 52,127.6*** |
| Unemployment rate (%) | 8.4 | 7.7*** |
Note.
Significance testing for differences between safety-net and non-safety-net hospitals in ownership, size, and teaching status applies to the overall distribution across categories of each characteristic rather than by each specific category.
Safety-net hospitals were defined as those that had the percentage of Medicaid and uninsured patients falling within the top quartile of this measure in 2007.
Revenues and expenses were adjusted for inflation using the GDP deflator, and measured as per adjusted patient day.
Data on HMO penetration is available only for 1 year, 2006.
p < .05;
p < .01;
p < .001.
Figure1 displays descriptive data on the percentage of Medicaid and uninsured patients, operating margin, and total margin for safety-net versus non-safety-net hospitals in each year over the period 2007 through 2011. As expected, safety-net hospitals saw more Medicaid and uninsured patients than non-safety-net hospitals. Operating margin was lower in all years for safety-net hospitals relative to non-safety-net hospitals, and the difference appeared to remain relatively consistent over time. A similar pattern was seen for total margin, although the difference between safety-net and non-safety-net hospitals disappeared in 2008 before reappearing in 2009.
Figure 1.
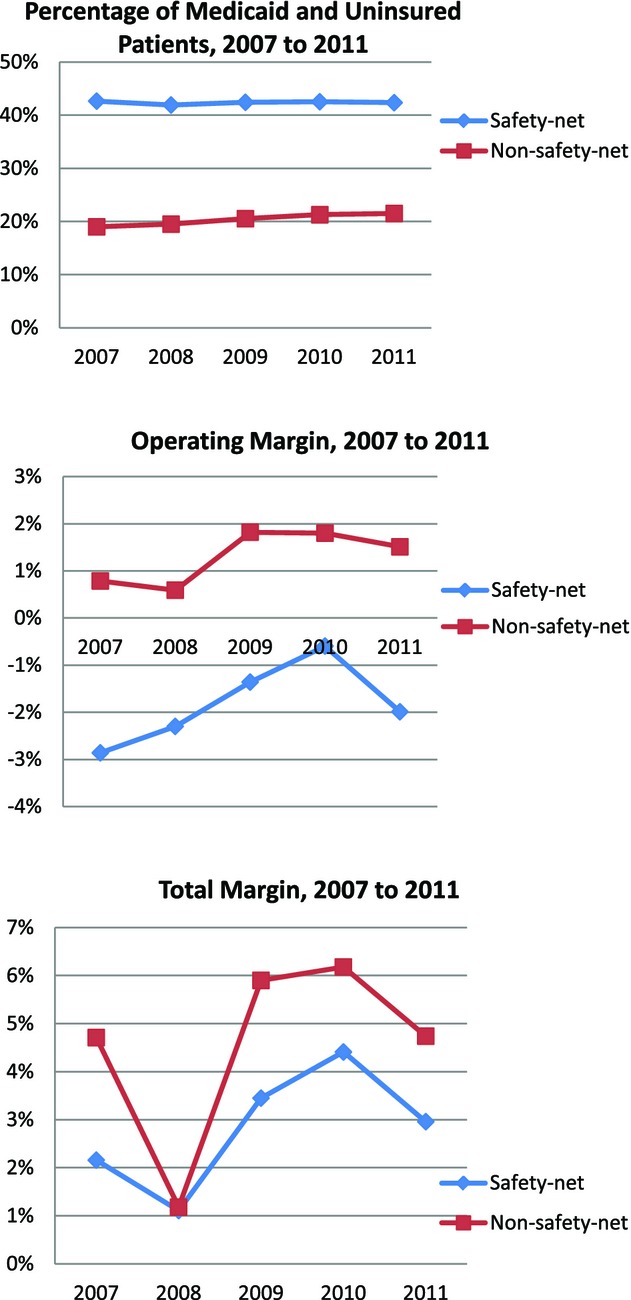
Patient Mix and Financial Performance in Safety-Net and Non-Safety-Net Hospitals, 2007–2011
Table2 reports the effects of safety-net status, as defined using patients in 2007, on hospital operating and total margins over time, controlling for hospital and market characteristics. On average, operating margin was 4.3 percent points lower and total margin 3.1 percent points lower in safety-net hospitals relative to non-safety-net hospitals, and the differences were statistically significant. Hospital operating margins remained stable throughout the recession, as did the difference in operating margin between safety-net and non-safety-net hospitals. In contrast, hospital total margins, on average, fell by 3 percentage points in 2008, the first year of the recession, and then rebounded by 2.3 percentage points in 2009, 2.8 percentage points in 2010, and 1.4 percentage points in 2011. In 2008, the difference in total margin between safety-net and non-safety-net hospitals disappeared (i.e., was no longer statistically significant) before returning to pre-recession levels in 2009. System affiliation was associated with both higher operating and total margins (4.6 and 2.7 percent points, respectively), and the results were statistically significant. A greater percentage of high-severity patients was associated with lower operating and total margins, although the magnitude of the effects was small. HMO penetration was associated with lower operating margin, but it had no statistically significant association with total margin.
Table 2.
Regression Results on Financial Margins in Relation to Safety-Net Status
|
Coefficient (SE) |
||
|---|---|---|
| Operating Margin | Total Margin | |
| Safety-net status† | −0.0430 (0.0071)*** | −0.0308 (0.0052)*** |
| Year 2008 | −0.0014 (0.0027) | −0.0300 (0.0028)*** |
| Year 2009 | 0.0078 (0.0052) | 0.0234 (0.0046)*** |
| Year 2010 | 0.0079 (0.0057) | 0.0277 (0.0049)*** |
| Year 2011 | 0.0068 (0.0054) | 0.0138 (0.0046)** |
| Safety-net × 2008 | 0.0072 (0.0043) | 0.0264 (0.0043)*** |
| Safety-net × 2009 | 0.0042 (0.0057) | 0.0017 (0.0047) |
| Safety-net × 2010 | 0.0110 (0.0059) | 0.0091 (0.0047) |
| Safety-net × 2011 | 0.0000 (0.0065) | 0.0097 (0.0052) |
| System affiliation | 0.0460 (0.0044)*** | 0.0274 (0.0030)*** |
| High-severity patients | −0.0006 (0.0003)* | −0.0009 (0.0002)*** |
| Outpatient visits (log) | −0.0043 (0.0024) | 0.0003 (0.0018) |
| Hospital concentration (above median) | 0.0080 (0.0051) | 0.0025 (0.0039) |
| HMO penetration (log) | −0.0118 (0.0033)*** | −0.0046 (0.0026) |
| Median household income | 0.0000 (0.0000) | 0.0000 (0.0000) |
| Unemployment rate (log) | 0.0080 (0.0068) | −0.0102 (0.0059) |
Safety-net hospitals were defined as those that had the percentage of Medicaid and uninsured patients falling within the top quartile of this measure in 2007.
p < .05;
p < .01;
p < .001.
Table3 presents the association of safety-net intensity in each year of the recession with operating and total margins, operating and total revenues per adjusted patient day, and operating and total expenses per adjusted patient day. The results are presented separately for privately owned hospitals versus publicly owned hospitals. Among privately owned hospitals, for both operating and total margins, a 10 percentage point increase in safety-net intensity was associated with a decrease in margin of approximately 1 percentage point. As in the previous model, the effect of safety-net intensity on total margin disappeared in 2008.
Table 3.
|
Margin |
Revenues§ |
Expenses§ |
||||
|---|---|---|---|---|---|---|
| Operating Coefficient | Total Coefficient | Operating Coefficient | Total Coefficient | Operating Coefficient | Total Coefficient | |
| Private hospitals | ||||||
| Safety-net intensity | −0.0946*** | −0.0990*** | −0.2013*** | −0.1921*** | −0.1009 | −0.0809 |
| × Year 2008 | 0.0097 | 0.0705*** | 0.0183 | 0.0523 | 0.0007 | −0.0250 |
| × Year 2009 | −0.0197 | −0.0121 | −0.0267 | −0.0203 | −0.0125 | −0.0024 |
| × Year 2010 | −0.0018 | 0.0024 | 0.0584 | 0.0603 | 0.0503 | 0.0705 |
| × Year 2011 | −0.0430 | 0.0168 | −0.0034 | 0.0578 | 0.0291 | 0.0457 |
| Public hospitals | ||||||
| Safety-net intensity | −0.2753*** | −0.1820*** | −0.1535 | −0.0403 | 0.0967 | 0.1533 |
| × Year 2008 | −0.0035 | 0.0407 | 0.0139 | 0.0251 | 0.0216 | −0.0041 |
| × Year 2009 | 0.0982 | 0.0775 | −0.0384 | −0.0181 | −0.0444 | −0.0533 |
| × Year 2010 | 0.1565** | 0.1250*** | 0.0164 | 0.0352 | −0.0609 | −0.0482 |
| × Year 2011 | 0.0174 | 0.0214 | −0.1778* | −0.1672* | −0.1706** | −0.1525* |
Each model includes the following control variables: system affiliation, percentage of high-severity patients, outpatient visits (log), hospital concentration (above median), HMO penetration (log), median household income, unemployment rate (log), yearly dummies, and significant interaction terms (p < .05) of ownership with these variables.
Safety-net intensity was measured as the percentage of Medicaid and uninsured patients.
Revenues and expenses were measured as per adjusted patient day, and logarithm was taken for both measures.
p < .05;
p < .01;
p < .001.
For publicly owned hospitals, safety-net intensity was negatively associated with operating and total margins and the effect sizes were larger than for private hospitals. Among public hospitals, a 10 percentage point increase in safety-net intensity was associated with a 2.8 percentage point decrease in operating margin and 1.8 percentage point decrease in total margin. There were no apparent effects of safety-net intensity on operating or total margins during the recession; however, in 2010, the effect of safety-net intensity on operating and total margins diminished relative to 2007.
Among private hospitals, increasing safety-net intensity appeared to reduce both operating and total revenues per adjusted patient day. A 10 percentage point increase in safety-net intensity was associated with a 1.8 percent decrease [[100*(exp(−0.2013) − 1)]*0.10] in operating revenue and a 1.7 percent decrease in total revenue. There were no statistically significant effects of safety-net intensity on revenue during the recession, nor were there any statistically significant effects for either operating or total expenses.
Among public hospitals, safety-net intensity was not associated with revenues or expenses until 2011, when increasing safety-net intensity led to a reduction in both. In 2011, a 10 percentage point increase in safety-net intensity was associated with reductions in operating and total revenues of 1.6 and 1.5 percent, respectively, and reductions in operating and total expenses of 1.6 and 1.4 percent, respectively.
Discussion
In contrast to our expectations, the recession did not appear to have a disproportionate negative effect on the financial performance of safety-net hospitals relative to non-safety-net hospitals. Hospitals serving greater proportions of Medicaid and uninsured patients were shown to have lower operating and total margins than non-safety-net hospitals; however, the differences between safety-net hospitals and their peers remained relatively constant throughout the recession. This was true for both privately owned and publicly owned hospitals.
These findings are consistent with a recent study that found both operating and total margins to be significantly lower for safety-net hospitals, and the gap in operating margin between safety-net and non-safety-net nonprofit hospitals to be relatively stable during the recession, although operating margins in 2008 declined more for nonprofit than for-profit hospitals (Bazzoli, Fareed, and Waters 2014). Our results are also consistent with findings from the Center for Studying Health Systems Change that suggested the effects of the recession on local safety-nets were not as severe as predicted among five communities participating in the study (Felland et al. 2010). The authors found that safety-net hospitals may have been prepared for some of the effects of the recession, as demand for their services had been increasing prior to the recession. Moreover, federal stimulus money may have lessened some of the effects of eroding state and local budgets (Felland et al. 2010; Bazzoli, Fareed, and Waters 2014).
Notably,total margin was more negatively affected by the onset of the recession in non-safety-net hospitals than in safety-net hospitals. This was also true for the safety-net hospitals in Bazzoli, Fareed, and Waters (2014) relative to the other nonprofit hospitals they studied; however, their study showed that the smallest effect on total margin was among for-profit hospitals. While this result was not hypothesized in advance, it is plausible, given the large investment portfolios held by many private, not-for-profit hospitals (Song and Reiter 2010). The credit crisis and recession in 2008 had a substantial negative impact on financial markets, and therefore, the investment portfolios of many hospitals and health systems (McCue 2010). As total margin includes the effects of income from earnings on financial investments, this ratio reflects the volatility in the financial markets. Examination of the ratio of long-term investments to total assets in the safety-net and non-safety-net hospitals in our sample revealed higher proportions of financial investments in the asset mix of non-safety-net hospitals, and the differences were statistically significant in all years (results not shown).
This study contributes to the emerging evidence on the effects of the recession on safety-net hospitals nationally. Specifically, it complements the most recent study by Bazzoli, Fareed, and Waters (2014) in several ways. First, this study used a different definition of safety-net hospitals that included both Medicaid and uninsured patients as identified using hospital discharge data, thus providing a more comprehensive measure. Second, this study examined the relationship between the annual percentage of Medicaid and uninsured patients and operating and total margins in public versus privately owned hospitals. Finally, this study decomposed and evaluated the components of the profit ratios to determine whether there were differential effects on revenues versus expenses.
There are, however, several important limitations that should be considered. First, our definition of safety-net hospital in our first model was based on the top quartile of our measure of safety-net status. There are, admittedly, alternative cutoffs that could be used to define safety-net hospitals; moreover, regardless of cutoff, there may be variation among hospitals falling within the safety-net classification. However, results of our analysis using continuous, annual measures of safety-net intensity were consistent with the findings using identification at baseline. Second, while we attempted to control for differences between safety-net and non-safety-net hospitals, safety-net status is not randomly assigned. Thus, it is possible there are unobserved differences that may have affected our results.
While our findings revealed that safety-net hospitals did not necessarily fare worse than their peers during the recession, these results may not necessarily be predictive of the future. Felland et al. (2010) noted that safety-net hospitals may not have felt the full effects of the recession by its end in 2009. Kane et al. (2012) echoed this caution, noting that safety-hospitals are likely to face more competition and increasing fiscal austerity in the future. Results from our study are suggestive of increasing financial pressure after the recession, particularly among public hospitals. While there was no association of safety-net status with either revenues or expenses among public hospitals during the recession, in 2011, increasing safety-net intensity was associated with both lower revenues and lower expenses in these hospitals. A report by the Center on Budget and Policy Priorities found that spending cuts by states may have been greater in 2011 than those made during the recession, although not all of the cuts were to health services. The report also noted that by the end of 2011, most federal stimulus funds were exhausted (Johnson, Oliff, and Williams 2011). The National Association of Public Hospitals and Health Systems confirmed that while states nationwide made a total of almost $2 billion in cuts to Medicaid spending for fiscal year (FY) 2010, many states proposed additional and even greater cuts for FY2011-2012 (National Association of Public Hospitals and Health Systems 2011a).
The significantly lower operating and total margins among safety-net hospitals as compared to other hospitals suggest that these providers have less financial cushion to weather sustained financial pressure that is not accompanied by stop-gap funding such as the American Recovery and Reinvestment Act. Recent evidence suggests that new reimbursement models and proposed cuts to safety-net subsidies such as disproportionate share funding under health reform may widen the gap between safety-net and non-safety-net providers (Mohan et al. 2013; Bazzoli and Clement 2014; Neuhausen et al. 2014), and between hospitals considered financially weak versus strong (Bazzoli, Fareed, and Waters 2014). Future studies should continue to track the performance of safety-net hospitals as the environment changes.
Acknowledgments
Joint Acknowledgment/Disclosure Statement: This study was funded by the Agency for Healthcare Research and Quality through intramural research. The views expressed herein are those of the authors. No official endorsement by any agency of the federal government, the University of North Carolina at Chapel Hill, or Data and Analytic Solutions, Inc. is intended or should be inferred.
Disclosures: None.
Disclaimers: None.
Supporting Information
Additional supporting information may be found in the online version of this article:
Author Matrix.
References
- AHA Data Viewer. 2014. [accessed on March 25, 2014]. Available at http://www.ahadataviewer.com/glossary/
- Bachrach D, Braslow L, Karl A. Toward a High Performance Health Care System for Vulnerable Populations: Funding for Safety-Net Hospitals. The Commonwealth Fund. 2012 and. “.” [accessed on August 15, 2014]. Available at http://www.commonwealthfund.org/publications/fund-reports/2012/mar/vulnerable-populations. [Google Scholar]
- Bazzoli GJ, Clement JP. The Experiences of Massachusetts Hospitals as Statewide Health Insurance Reform was Implemented. Journal of Health Care for the Poor and Underserved. 2014;25(1):63–78. doi: 10.1353/hpu.2014.0073. [DOI] [PubMed] [Google Scholar]
- Bazzoli GJ, Fareed N, Waters TM. Hospital Financial Performance in the Recent Recession and Implications for Institutions That Remain Financially Weak. Health Affairs. 2014;33(5):739–45. doi: 10.1377/hlthaff.2013.0988. [DOI] [PubMed] [Google Scholar]
- Bazzoli GJ, Kang R, Hasnain-Wynia R, Lindrooth RC. An Update on Safety-Net Hospitals: Coping with the Late 1990s and Early 2000s. Health Affairs (Millwood) 2005;24(4):1047–56. doi: 10.1377/hlthaff.24.4.1047. [DOI] [PubMed] [Google Scholar]
- Bazzoli GJ, Lindrooth RC, Kang R, Hasnain-Wynia R. The Influence of Health Policy and Market Factors on the Hospital Safety Net. Health Services Research. 2006;41(4 Pt 1):1159–80. doi: 10.1111/j.1475-6773.2006.00528.x. [DOI] [PMC free article] [PubMed] [Google Scholar]
- Cawley J, Moriya AS, Simon K. The Impact of the Macroeconomy on Health Insurance Coverage: Evidence from the Great Recession. Health Economics. 2013 doi: 10.1002/hec.3011. and. “.” November 14, 2013 E-pub ahead of print. [DOI] [PubMed] [Google Scholar]
- Clement JP, Grazier KL. HMO Penetration: Has It Hurt Public Hospitals? Journal of Health Care Finance. 2001;28(1):25–38. [PubMed] [Google Scholar]
- Cunningham PJ, Bazzoli GJ, Katz A. Caught in the Competitive Crossfire: Safety-Net Providers Balance Margin and Mission in a Profit-Driven Health Care Market. Health Affairs. 2008;27(5):w374–82. doi: 10.1377/hlthaff.27.5.w374. [DOI] [PubMed] [Google Scholar]
- Felland LE, Hurley RE, Kemper NM. Safety Net Hospital Emergency Departments: Creating Safety Valves for Non-Urgent Care. Issue Brief for Center Studying Health System Change. 2008;May(120):1–7. [PubMed] [Google Scholar]
- Felland LE, Lesser CS, Staiti AB, Katz A, Lichiello P. The Resilience of the Health Care Safety Net, 1996-2001. Health Services Research. 2003;38(1 Pt 2):489–502. doi: 10.1111/1475-6773.00126. [DOI] [PMC free article] [PubMed] [Google Scholar]
- Felland LE, Cunningham PJ, Cohen GR, November EA, Quinn BC. The Economic Recession: Early Impacts on Health Care Safety Net Providers. Center for Studying Health System Change Research Brief. 2010;15(January):1–8. [PubMed] [Google Scholar]
- Gapenski LC, Vogel WB, Langland-Orban B. The Determinants of Hospital Profitability. Hospital and Health Services Administration. 1993;38(1):63–80. [PubMed] [Google Scholar]
- Gaskin DJ. Safety Net Hospitals: Essential Providers of Public Health and Specialty Services. The Commonwealth Fund; 1999. [accessed on August 14, 2014]. Available at http://www.commonwealthfund.org/publications/fund-reports/1999/feb/safety-net-hospitals--essential-providers-of-public-health-and-specialty-services. [Google Scholar]
- Gaskin DJ, Hadley J. Population Characteristics of Markets of Safety-Net and Non-Safety-Net Hospitals. Journal of Urban Health. 1999;76(3):351–70. doi: 10.1007/BF02345673. [DOI] [PMC free article] [PubMed] [Google Scholar]
- Gaskin DJ, Hadley J, Freeman VG. Are Urban Safety-Net Hospitals Losing Low-Risk Medicaid Maternity Patients? Health Services Research. 2001;36(1):25–51. [PMC free article] [PubMed] [Google Scholar]
- Gautam K, Campbell C, Arrington B. Financial Performance of Safety-Net Hospitals in a Changing Health Care Environment. Health Services Management Research. 1996;9(3):156–71. doi: 10.1177/095148489600900302. [DOI] [PubMed] [Google Scholar]
- Gordon T. 2012. “ State and Local Budgets and the Great Recession ” [accessed on March 24, 2014]. Available at http://www.brookings.edu/research/articles/2012/12/state-local-budgets-gordon.
- Hadley J, Cunningham PJ. Availability of Safety Net Providers and Access to Care of Uninsured Persons. Health Services Research. 2004;39(5):1527–46. doi: 10.1111/j.1475-6773.2004.00302.x. [DOI] [PMC free article] [PubMed] [Google Scholar]
- Institute of Medicine. America's Health Care Safety Net: Intact but Endangered. Washington, DC: National Academy Press; 2000. “.” M. Lewin and S. Altman. [PubMed] [Google Scholar]
- Johnson N, Oliff P, Williams E. 2011. and. “ An Update on State Budget Cuts ” [accessed on March 24, 2014]. Available at http://www.cbpp.org/cms/?fa=view&id=1214.
- Kane NM, Singer SJ, Clark JR, Eeckloo K, Valentine M. Strained Local and State Government Finances Among Current Realities That Threaten Public Hospitals’ Profitability. Health Affairs (Millwood) 2012;31(8):1680–9. doi: 10.1377/hlthaff.2011.1401. [DOI] [PubMed] [Google Scholar]
- McCue MJ. A Descriptive Analysis of the 2008 Credit Crisis on Multistate Heatlhcare Systems: What Impact Did It Have on Their Financial Performance? Hospital Topics. 2010;88(2):53–60. doi: 10.1080/00185861003768977. “ ”. [DOI] [PubMed] [Google Scholar]
- McHugh M, Kang R, Hasnain-Wynia R. Understanding the Safety-Net: Inpatient Quality of Care Varies Based on How One Defines Safety-Net Hospitals. Medical Care Research and Review. 2009;66(5):590–605. doi: 10.1177/1077558709334895. [DOI] [PubMed] [Google Scholar]
- McKay NL, Gapenski LC. Nonpatient Revenues in Hospitals. Health Care Management Review. 2009;34(3):234–41. doi: 10.1097/HMR.0b013e3181a16bbc. [DOI] [PubMed] [Google Scholar]
- Mohan A, Grant J, Batalden M, McCormick D. The Health of Safety Net Hospitals Following Massachusetts Health Care Reform: Changes in Volume, Revenue, Costs, and Operating Margins from 2006 to 2009. International Journal of Health Services. 2013;43(2):321–35. doi: 10.2190/HS.43.2.h. [DOI] [PubMed] [Google Scholar]
- National Association of Public Hospitals and Health Systems. 2011a. “ Safety-Net Health Systems: Keeping Americans Healthy and Working ” [accessed on January 15, 2014]. Available at http://www.naph.org/Publications/Safety-Net-Economic-Impact-Brief.aspx.
- National Association of Public Hospitals and Health Systems. 2011b. “ Study Reveals NAPH Members Are ‘Providers of Choice’ for All Patients ” [accessed on March 24, 2014]. Available at http://essentialhospitals.org/wp-content/uploads/2013/12/NPH186.pdf.
- NBER Business Cycle Dating Committee. 2011. “ US Business Cycle Expansions and Contractions ” [accessed on March 24, 2014]. Available at http://www.nber.org/cycles.html.
- Neuhausen K, Davis AC, Needleman J, Brook RH, Zingmond D, Roby DH. Disproportionate-Share Hospital Payment Reductions May Threaten the Financial Stability of Safety-Net Hospitals. Health Affairs. 2014;33(6):988–96. doi: 10.1377/hlthaff.2013.1222. [DOI] [PMC free article] [PubMed] [Google Scholar]
- Office of Management and Budget. 2013. “ Revised Dilineations of Metropolitan Statistical Areas, Micropolitan Statistical Areas, and Combined Statistical Areas, and Guidance on Uses of the Delineations of These Areas ” [accessed on March 25, 2014]. Available at http://www.whitehouse.gov/sites/default/files/omb/bulletins/2013/b-13-01.pdf.
- Song PH, Reiter KL. Trends in Asset Structure between Not-For-Profit and Investor-Owned Hospitals. Medical Care Research and Review. 2010;67(6):694–706. doi: 10.1177/1077558710368807. [DOI] [PMC free article] [PubMed] [Google Scholar]
- U.S. Department of Commerce Bureau of Economic Analysis. 2014. “ Price Indexes for Gross Domestic Product ” [accessed on April 10, 2014]. Available at http://www.bea.gov/iTable/iTable.cfm?ReqID=9&step=1#reqid=9&step=3&isuri=1&903=4.
- Wong HS, Zhan C, Mutter R. Do Different Measures of Hospital Competition Matter in Empirical Investigations of Hospital Behavior? Review of Industrial Organization. 2005;26(1):27–60. [Google Scholar]
- Younis M, Rice J, Barkoulas J. An Empirical Investigation of Hospital Profitability in the Post-PPS Era. Journal of Health Care Finance. 2001;28(2):65–73. [PubMed] [Google Scholar]
- Zuckerman S, Bazzoli G, Davidoff A, LoSasso A. How Did Safety-Net Hospitals Cope in the 1990s? Health Affairs (Millwood) 2001;20(4):159–68. doi: 10.1377/hlthaff.20.4.159. [DOI] [PubMed] [Google Scholar]
- Zwanziger J, Khan N. Safety-Net Hospitals. Medical Care Research Review. 2008;65(4):478–95. doi: 10.1177/1077558708315440. [DOI] [PubMed] [Google Scholar]
- Zwanziger J, Khan N, Bamezai A. The Relationship between Safety Net Activities and Hospital Financial Performance. BMC Health Services Research. 2010;10(15):1–12. doi: 10.1186/1472-6963-10-15. [DOI] [PMC free article] [PubMed] [Google Scholar]
Associated Data
This section collects any data citations, data availability statements, or supplementary materials included in this article.
Supplementary Materials
Author Matrix.