

Abstract
Objective
We study the association between the timing of the Great Recession (GR) and health spending among uninsured adults distinguishing by citizenship/nativity status and time of U.S. residence.
Data Source
Uninsured U.S. citizens and noncitizens from the 2005–2006 and 2008–2009 Medical Expenditure Panel Survey.
Study Design
The probability of reporting any health spending and the natural logarithm of health spending are our main dependent variables. We compare health spending across population categories before/during the GR. Subsequently, we implement two-part regression analyses of total and specific health-spending measures. We predict average health spending before/during the GR with a smearing estimation.
Principal Findings
The probability of reporting any spending diminished for recent immigrants compared to citizens during the GR. For those with any spending, recent immigrants reported higher spending during the GR (27 percent). Average reductions in total spending were driven by the decline in the share of the population reporting any spending among citizens and noncitizens.
Conclusions
Our study findings suggest that recent immigrants could be forgoing essential care, which later translates into higher spending. It portrays the vulnerability of a population that would remain exposed to income shocks, even after the Affordable Care Act (ACA) implementation.
Keywords: Uninsured, immigrants, total health care costs, two-part model, recession
The 2007–2009 Great Recession (GR) had adverse effects on the incomes and savings of U.S. households. Higher unemployment led to income declines and increased number of uninsured individuals, which contributed to reduced growth in health spending (Holahan and McMorrow 2010). Earlier studies that investigated the association between the timing of the GR and health care found reduced utilization for all racial/ethnic groups, particularly in the case of prescription drugs and hospital stays (Catalano et al. 2011; Mortensen and Chen 2007). Research has also shown that U.S. households responded to diminishing incomes by reducing out-of-pocket health spending (Hurd 1995; Martin et al. 2011; Cunningham 1983).
The foreign-born population in the United States doubled from 20 million in 1990 to more than 40 million in 2010 (ASPE Issue Brief 2012). Even though the foreign-born population in the United States has higher employment rates compared to the native-born population, immigrants are more likely to have low-waged jobs. In consequence, foreign-born individuals are less likely to have employer-provided health insurance (Kenney and Huntress 2009a). In addition, approximately 11.7 million of U.S. immigrants are undocumented (PEW Hispanic Center 2013).
Different public programs such as Medicaid or the Children's Health Insurance Program (SCHIP) provide subsidized coverage to low-income families. Previous research shows that these programs reduce economic hardship, improve health, and contribute to the stability of household income among vulnerable families (Mills Compton and Golden 2005). Adult foreign-born individuals, however, have limited access to public programs for low-income and uninsured individuals due to program eligibility restrictions, benefit heterogeneity, and coverage variability across U.S. states and counties along with other economic, language, and cultural barriers (Fortuny and Chaudry 1964).
Place of residence greatly determines whether recent immigrants and undocumented immigrants are eligible for state- or county-funded coverage. Citizenship status and time of U.S. residence are also important factors determining access to federal and state assistance programs. Previous research has shown that immigrants, particularly the undocumented, spend considerably less on health care compared to the U.S.-born population (Goldman, Smith, and Sood 2011). Other studies show that citizenship status and time of U.S. residence are strongly associated with health insurance coverage, health spending (Mohanty et al. 2013; Ku 2009b,b2011), and Latino health-spending disparities (Vargas Bustamante and Chen 2011). Studies show, however, that immigrants are less likely to claim public benefits compared to native-born individuals even if they are eligible for a variety of reasons such as unawareness, access barriers, fear of deportation, and a strong belief on self-reliance, which could lead to lower health spending (Johnson 2006; Berk et al. 2000; Okie 2013; Stimpson, Wilson, and Su 2013).
The GR probably contributed to the overall reduction of health spending through increased unemployment and income/savings shortfalls. Previous research has suggested that adults, compared to children, experienced lower health insurance coverage rates after the GR partly because they benefited the least from existing public programs designed to offset the decline on health insurance (Holahan 2012). A recent study that investigated the impact of the GR on health spending identified larger changes in low-income cohorts and among populations with high concentrations of foreign-born and uninsured individuals (Chen et al. 1971). In addition, research has shown that growth in U.S. health spending has been declining since 2004 for a variety of reasons that are poorly understood (Holahan and McMorrow 2010).
While most studies assessing the impacts of the GR on health spending and access to care have focused on the overall U.S. population (Chen et al. 1971; Mortensen and Chen 2007), the specific impacts of this economic shock on the uninsured have not been investigated. Assessing the association between the timing of the GR and uninsured status is relevant, as the population without health insurance is more vulnerable to the adverse effects of economic shocks. In addition, low-income individuals have unequal access to federal and state assistance programs that could help buffer these effects. Lower uptake of public benefits by foreign-born individuals could suggest that uninsured immigrants could have been more exposed to the negative consequences of the GR on health spending.
To address this unexplored area of research, the present study investigates health-spending disparities between uninsured U.S. citizens and noncitizen residents before and during the 2007–2009 GR. No study to our knowledge has estimated the association between the timing of the GR and health-spending changes among uninsured adult individuals. Investigating the association between the timing of the GR among uninsured adults can portray vulnerabilities related with the exclusion of recent immigrants from government assistance programs. While the exclusion of undocumented immigrants under the ACA has been widely publicized (Zuckerman, Waidmann, and Lawton 2011), the ACA also kept in place the exclusion of Medicaid eligibility among documented noncitizen immigrants ≤5 years residence, which was introduced as part of the 1996 Personal Responsibility and Work Opportunity Act also known as Welfare Reform (Zimmermann and Tumlin 1999; Kaiser Commission on Medicaid and the Uninsured 2010).
Under existing rules, noncitizen recent immigrants would remain ineligible for Medicaid expanded coverage in those states that will offer it. Medicaid eligibility and access to the state and federal health insurance exchanges, however, would vary by citizenship status, documentation among immigrants, income, and time of U.S. residence. With the ACA rollout across states, those with higher incomes would receive fewer subsidies. In states that chose not to expand Medicaid, however, some of the poorest documented immigrants (as well as US citizens) would be able to access the exchanges, but without subsidies if their incomes fall below 100 percent of the Federal Poverty Line (Kaiser Commission on Medicaid and the Uninsured 2012). Consequently, existing ACA-related policies that offer expanded Medicaid coverage and subsidized insurance through state and federal exchanges may still be insufficient to incorporate immigrant populations.
Conceptual Framework
The main outcome and explanatory variable selection followed the framework developed by Mortensen and Chen to identify the association of the GR in health care access, utilization, and health spending in the U.S. population, respectively (Chen et al. 1971; Mortensen and Chen 2007). This framework was adapted in this study to identify health-spending differences among the uninsured U.S. population focusing on citizenship/nativity status differences and time of U.S. residence to account for heterogeneity in public program eligibility and differences in program take-up among foreign-born individuals. This study hypothesizes that the timing of the GR is associated with differences in the probability of reporting any health spending and on average health care costs (if any) between uninsured U.S. citizens and noncitizens, particularly among recent noncitizen immigrants (≤5 years of U.S. residence).
According to this framework, the timing of the GR is associated with changes in the probability of reporting total and specific types of health spending. For those who reported any spending, the timing of the recession would be associated with changes and the composition of health spending. Changes in both the probability of reporting any spending and average health spending would be a function of socioeconomic and demographic characteristics, health status, chronic conditions, access to care, and language fluency before and during the GR (Chen et al. 1971; Mortensen and Chen 2007). In this study, health insurance status was excluded from this conceptual framework as it focuses on the uninsured. This study hypothesizes, however, that the relationship between health spending, citizenship, and time of U.S. residence is potentially mediated by income, usual source of care, unemployment, and health status.
Study Data and Methods
Data
The study used data from the 2005–2006 and 2008–2009 Medical Expenditure Panel Survey (MEPS). The MEPS Consolidated File is a person-year level database, which provides detailed consumer information on health spending, socioeconomic characteristics, health, and health insurance status. This dataset is a repeated cross-section, nationally representative data of the U.S. civilian and noninstitutionalized population. Survey data were administered in English, Spanish, and using a mix of English and Spanish. Our study sample was restricted to the uninsured citizen and noncitizen population. Lack of health insurance in MEPS recorded whether individuals were uninsured for the full year (AHRQ 2008).
Health-Spending Measures
This study uses total and specific health-spending figures reported by individuals participating in MEPS. Total and specific measures of health spending were self-reported and included out-of-pocket payments, payments by private insurance, and other sources (AHRQ 2008). Two different types of health-spending measures were used in the analyses following the framework described above. A first series of constructed dichotomous terms indicated whether survey respondents had any health spending, or specifically any prescription drug (Rx), physician visit, emergency department (ED), and inpatient spending, respectively. The second series of measures were used to analyze the percentage change in the reported amounts of total health spending, Rx, physician, ED, and inpatient spending, respectively. Thus, the natural logarithm of each spending measure was estimated to address the skewness in the distribution of these variables (Wooldridge 2002). All health-spending measures are adjusted for inflation using the Consumer Price Index medical care component with 2010 as the base year.
Explanatory Variables
A dichotomous term equal to zero for wave 1 (2005–2006) and equal to one for wave 2 (2008–2009) was created to identify the timing of the GR. In addition, we constructed three mutually exclusive dichotomous measures of citizenship and time of U.S. residence: U.S.-born citizen, noncitizens with 5 years or less of U.S. residence (≤5 years), and noncitizens with more than 5 years residence (>5 years), which coincide with the 5-year waiting period that documented immigrants need to observe before they become eligible for federal public assistance programs. Interaction terms were constructed between the recession indicator and each population category. The total sample of uninsured adults 18–64 years of age (N = 10,466) included U.S. citizens (N = 7,346), noncitizen residents ≤5 years (N = 599), and noncitizen residents >5 years (N = 2521).
According to our conceptual framework, the analyses included socioeconomic (family income, education, employment status) and demographic (age, gender, marital status, region of residence) characteristics, health status (self-reported), chronic conditions (type 2 diabetes, cholesterol, heart disease, hypertension, osteoporosis, asthma, depression, anxiety), access to care (usual source of care), and language fluency (English survey response) before and during the GR as covariates. It is important to mention that the income variable included wages and other sources of income such as unemployment and government assistance (AHRQ 2008).
Statistical Analysis
To produce sample summary statistics, two comparisons of means analyses were performed. The first means analysis compared all measures across the two study periods, 2005–2006 (wave 1) and 2008–2009 (wave 2). The second means analysis compared the two categories of noncitizen residents with U.S. citizens as the reference group (Tables1). Subsequently, a two-part regression analysis was estimated pooling data from waves 1 and 2 to estimate the association between the GR and health spending (Goldberger 2006; Cragg 2012; Wooldridge 2002). The first part of these models represented the multivariate logistic regression between citizens (the reference group) and noncitizen residents sorted by time of U.S. residence. This model was used to estimate the likelihood of any health spending for each population category as compared to citizens. Zero health spending is widespread across the study data, indicating either no utilization due to need or respondents' unwillingness to spend for health care. A two-part model specification was selected compared to alternative models (e.g., Tobit, LPM) because this model specification first addresses the probability of reporting any health spending and estimates the association between the timing of the recession and health spending among those who reported any spending. Consequently, the regression specification for the first part of this model is the following:
| (1) |
where Y1 is a binary variable equal to one if surveyed individuals reported any health spending (overall or specific measures, respectively) during the survey year and zero otherwise. RI is a recession indicator with a value of one if the survey year was 2008–2009 and of zero if the survey year corresponded to 2005–2006. The term C includes three indicators that classify survey respondents by citizenship status and time of U.S. residence. The association between the timing of the GR and the measures of citizenship and time of U.S. residence is estimated using the RI *C interaction term. The term X is a vector of socioeconomic, demographic, and year variables listed in Table2. The terms α0, α1, β, Θ, and φ correspond to estimated coefficients, while ε1 is the error term.
Table 1.
Health Spending of Uninsured U.S. Citizens and Noncitizen Residents before and during the Great Recession
|
US Citizens |
Non-U.S. Citizens ≤5 Years |
Non-U.S. Citizens >5 Years |
||||
|---|---|---|---|---|---|---|
| 2005–2006 | 2008–2009 | 2005–2006 | 2008–2009 | 2005–2006 | 2008–2009 | |
| n = 3,554 | n = 3,792 | n = 313 | n = 286 | n = 1,130 | n = 1,391 | |
| Probability of any health spending | 0.75 | 0.75 | 0.66*** | 0.62** | 0.71** | 0.70*** |
| Average health spending (if any) | 2,404.77 | 2,445.14 | 1,604.07* | 1,452.2 | 1,551.5*** | 1,358.14*** |
| Probability of any Rx spending | 0.59 | 0.58 | 0.43*** | 0.44*** | 0.51*** | 0.53*** |
| Average Rx spending (if any) | 893 | 749.07‡ | 386.00** | 164.55*** | 487.74*** | 311.9***,§ |
| Probability of any physician visit spending | 0.54 | 0.54 | 0.45** | 0.45** | 0.53 | 0.51 |
| Average physician visit spending (if any) | 744.36 | 849.88 | 596.45 | 707.42 | 532.41* | 583.75** |
| Probability of any ED spending | 0.15 | 0.15 | 0.07*** | 0.07* | 0.1*** | 0.09 |
| Average ED spending (if any) | 933.17 | 1,051.43 | 861.06 | 1,087.91 | 664.9 | 948.6 |
| Probability of any inpatient spending | 0.05 | 0.04 | 0.09** | 0.07 | 0.05 | 0.04 |
| Average inpatient spending (if any) | 8,755.92 | 12,370.57 | 5,275.36 | 3,804.29 | 6,927.98 | 5,197.20* |
| Sample characteristics | ||||||
| Race/ethnicity | ||||||
| White | 0.53 | 0.46‡ | 0.04*** | 0.04*** | 0.03*** | 0.02***,† |
| Latino | 0.24 | 0.25 | 0.87*** | 0.82*** | 0.90*** | 0.91*** |
| African American | 0.18 | 0.23‡ | 0.04*** | 0.04*** | 0.04*** | 0.03*** |
| Other race | 0.05 | 0.06‡ | 0.05 | 0.10*,‡ | 0.03* | 0.04* |
| Age | ||||||
| Age 18–24 | 0.17 | 0.19 | 0.25*** | 0.26* | 0.09*** | 0.08*** |
| Age 25–34 | 0.22 | 0.22 | 0.40*** | 0.38*** | 0.32*** | 0.30*** |
| Age 35–44 | 0.21 | 0.18† | 0.22 | 0.19 | 0.30*** | 0.29*** |
| Age 45–54 | 0.23 | 0.23 | 0.07*** | 0.13***,† | 0.19** | 0.22† |
| Age 55–64 | 0.17 | 0.18 | 0.06*** | 0.05*** | 0.10*** | 0.11*** |
| Female | 0.53 | 0.52 | 0.58 | 0.56 | 0.56 | 0.53 |
| Married | 0.38 | 0.37 | 0.50*** | 0.46** | 0.62*** | 0.59*** |
| Self-reported health status | ||||||
| Very good/excellent | 0.46 | 0.47 | 0.49 | 0.46 | 0.41** | 0.43* |
| Good | 0.33 | 0.34 | 0.39* | 0.39 | 0.40** | 0.38** |
| Fair/poor | 0.21 | 0.20 | 0.12*** | 0.15 | 0.19 | 0.19 |
| Chronic conditions | ||||||
| Type 2 diabetes | 0.08 | 0.08 | 0.01*** | 0.06‡ | 0.08 | 0.10* |
| Hyperlipidemia | 0.06 | 0.13§ | 0.03* | 0.06*** | 0.06 | 0.13† |
| Heart disease | 0.01 | 0.02 | 0.00* | 0.00 | 0.01* | 0.01 |
| Hypertension | 0.17 | 0.21§ | 0.06*** | 0.10*** | 0.14** | 0.15** |
| Osteoarthritis | 0.01 | 0.01 | 0.00 | 0.01 | 0.01 | 0.01 |
| Asthma | 0.04 | 0.06† | 0.02* | 0.00***,† | 0.01*** | 0.03***,† |
| Depression | 0.12 | 0.10† | 0.07** | 0.03***,† | 0.07*** | 0.05***,† |
| Anxiety | 0.07 | 0.06 | 0.02*** | 0.01*** | 0.01*** | 0.02*** |
| Schooling | ||||||
| Less than high school | 0.36 | 0.35† | 0.59*** | 0.6*** | 0.71*** | 0.65***,‡ |
| High school degree | 0.48 | 0.50 | 0.25*** | 0.28*** | 0.23*** | 0.27***,‡ |
| College degree | 0.07 | 0.07 | 0.09 | 0.09 | 0.03*** | 0.04*** |
| Advanced degree | 0.09 | 0.08 | 0.07 | 0.03** | 0.03*** | 0.04***,‡ |
| Family income | ||||||
| Less than 100% FPL | 0.27 | 0.28 | 0.37*** | 0.42*** | 0.31* | 0.33*** |
| 100–200% FPL | 0.33 | 0.31 | 0.34 | 0.36 | 0.44*** | 0.38***,‡ |
| More than 200% FPL | 0.40 | 0.40 | 0.29*** | 0.22***,† | 0.25*** | 0.29***,† |
| Usual source of care | 0.57 | 0.54† | 0.35*** | 0.36*** | 0.47*** | 0.43***,† |
| Unemployed | 0.25 | 0.27† | 0.29 | 0.26 | 0.28* | 0.27 |
| English response | 0.88 | 0.87 | 0.17*** | 0.30***,§ | 0.19*** | 0.22*** |
| Urban | 0.74 | 0.82§ | 0.94*** | 0.91*** | 0.91*** | 0.93***,† |
| Region | ||||||
| Northeast | 0.10 | 0.09 | 0.12 | 0.11 | 0.08 | 0.09 |
| Midwest | 0.18 | 0.20‡ | 0.05*** | 0.10*** | 0.06*** | 0.08*** |
| South | 0.49 | 0.47 | 0.48 | 0.45 | 0.41*** | 0.40*** |
| West | 0.23 | 0.23 | 0.35*** | 0.34*** | 0.45*** | 0.42*** |
Note. Rx, prescription drugs; ED, emergency department. For comparison of means 1 (Ref: US citizens), statistically significant differences are ***p < .001; **p < .01; *p < .05. For comparison of means 2 (Ref: Before the Great Recession), they are §p < .001, ‡p < .01, †p < .05.
Source: 2005–2006 and 2008–2009 Medical Expenditure Panel Survey data.
Table 2.
Two-Part Multivariate Logistic Regression Analysis of Total Health Spending before and during the Great Recession among the Uninsured Population: Part 1 – Any Cost, Part 2 – Ln (Total Cost)
|
Step 1: Any Health Spending |
Step 2: LN (Health Spending) |
|||||||||||||||
|---|---|---|---|---|---|---|---|---|---|---|---|---|---|---|---|---|
|
1a |
2a |
3a |
4a |
1b |
2b |
3b |
4b |
|||||||||
| Coef | p | Coef | p | Coef | p | Coef | p | Coef | p | Coef | p | Coef | p | Coef | p | |
| Before recession (2005–2006) | Reference | Reference | Reference | Reference | Reference | Reference | Reference | Reference | ||||||||
| Recession indicator (2008–2009) | −0.01 | .91 | −0.06 | .41 | −0.06 | .47 | 0.00 | 1.00 | −0.12 | .03 | −0.17 | .00 | −0.16 | .00 | −0.14 | .01 |
| U.S. citizens | Reference | Reference | Reference | Reference | Reference | Reference | Reference | Reference | ||||||||
| Non-U.S. citizens ≤5 years | −0.11 | .61 | −0.01 | .98 | −0.03 | .90 | 0.13 | .55 | −0.27 | .07 | −0.17 | .22 | −0.20 | .17 | −0.15 | .31 |
| Non-U.S. citizens >5 years | −0.09 | .47 | −0.03 | .79 | 0.00 | .99 | 0.09 | .49 | −0.15 | .09 | −0.09 | .29 | −0.03 | .69 | 0.01 | .93 |
| Non-U.S. citizens ≤5 years × recession indicator | −0.59 | .05 | −0.61 | .04 | −0.59 | .05 | −0.63 | .04 | 0.42 | .05 | 0.41 | .05 | 0.43 | .04 | 0.41 | .04 |
| Non-U.S. citizens >5 years × recession indicator | −0.11 | .44 | −0.09 | .52 | −0.09 | .52 | −0.11 | .45 | −0.06 | .55 | −0.05 | .59 | −0.07 | .50 | −0.08 | .46 |
| Race/ethnicity | ||||||||||||||||
| White | Reference | Reference | Reference | Reference | Reference | Reference | Reference | Reference | ||||||||
| Latino | −0.37 | .00 | −0.40 | .00 | −0.33 | .00 | −0.26 | .02 | −0.37 | .00 | −0.39 | .00 | −0.32 | .00 | −0.30 | .00 |
| African American | −0.26 | .00 | −0.36 | .00 | −0.35 | .00 | −0.31 | .00 | −0.30 | .00 | −0.32 | .00 | −0.33 | .00 | −0.31 | .00 |
| Other race | −0.27 | .05 | −0.37 | .01 | −0.36 | .01 | −0.32 | .03 | −0.19 | .15 | −0.29 | .01 | −0.34 | .00 | −0.33 | .00 |
| Age (years) | ||||||||||||||||
| Age 18–24 | Reference | Reference | Reference | Reference | Reference | Reference | Reference | Reference | ||||||||
| Age 25–34 | −0.01 | .90 | −0.08 | .41 | −0.12 | .25 | −0.07 | .49 | −0.03 | .73 | −0.10 | .18 | −0.16 | .04 | −0.13 | .09 |
| Age 35–44 | −0.01 | .90 | −0.24 | .02 | −0.26 | .01 | −0.25 | .02 | 0.34 | .00 | 0.11 | .19 | 0.05 | .57 | 0.06 | .47 |
| Age 45–54 | 0.44 | .00 | 0.01 | .96 | −0.02 | .82 | −0.05 | .65 | 0.46 | .00 | 0.07 | .37 | 0.01 | .91 | 0.00 | .98 |
| Age 55–64 | 0.76 | .00 | 0.08 | .54 | 0.04 | .75 | 0.00 | .98 | 0.98 | .00 | 0.39 | .00 | 0.31 | .00 | 0.25 | .01 |
| Female | 0.76 | .00 | 0.75 | .00 | 0.73 | .00 | 0.62 | .00 | 0.24 | .00 | 0.23 | .00 | 0.22 | .00 | 0.16 | .00 |
| Married | 0.28 | .00 | 0.27 | .00 | 0.28 | .00 | 0.16 | .02 | 0.09 | .08 | 0.11 | .02 | 0.13 | .01 | 0.07 | .14 |
| Self-reported health status | ||||||||||||||||
| Very good/excellent | Reference | Reference | Reference | Reference | Reference | Reference | ||||||||||
| Good | 0.14 | .10 | 0.14 | .08 | 0.15 | .09 | 0.12 | .04 | 0.14 | .01 | 0.14 | .01 | ||||
| Fair/poor | 0.40 | .00 | 0.42 | .00 | 0.46 | .00 | 0.45 | .00 | 0.49 | .00 | 0.49 | .00 | ||||
| Chronic conditions | ||||||||||||||||
| Type 2 diabetes | 1.76 | .00 | 1.76 | .00 | 1.62 | .00 | 0.55 | .00 | 0.58 | .00 | 0.55 | .00 | ||||
| Hyperlipidemia | 0.72 | .00 | 0.72 | .00 | 0.49 | .01 | 0.52 | .00 | 0.52 | .00 | 0.46 | .00 | ||||
| Heart disease | 1.15 | .01 | 1.19 | .01 | 1.09 | .01 | 0.70 | .00 | 0.69 | .00 | 0.67 | .00 | ||||
| Hypertension | 1.20 | .00 | 1.19 | .00 | 0.98 | .00 | 0.33 | .00 | 0.34 | .00 | 0.26 | .00 | ||||
| Osteoarthritis | 0.89 | .08 | 0.92 | .07 | 0.73 | .14 | 0.87 | .00 | 0.86 | .00 | 0.75 | .00 | ||||
| Asthma | 0.61 | .00 | 0.63 | .00 | 0.52 | .01 | 0.26 | .01 | 0.26 | .01 | 0.22 | .01 | ||||
| Depression | 0.35 | .01 | 0.36 | .00 | 0.35 | .00 | 0.33 | .00 | 0.33 | .00 | 0.32 | .00 | ||||
| Anxiety | 0.98 | .00 | 0.97 | .00 | 0.84 | .00 | 0.54 | .00 | 0.52 | .00 | 0.47 | .00 | ||||
| Schooling | ||||||||||||||||
| Less than high school | Reference | Reference | Reference | Reference | ||||||||||||
| High school degree | 0.12 | .12 | 0.08 | .29 | 0.16 | .00 | 0.14 | .00 | ||||||||
| College degree | 0.23 | .09 | 0.21 | .13 | 0.40 | .00 | 0.40 | .00 | ||||||||
| Advanced degree | 0.37 | .01 | 0.32 | .02 | 0.38 | .00 | 0.36 | .00 | ||||||||
| English response | −0.05 | .67 | −0.06 | .60 | 0.08 | .36 | 0.07 | .39 | ||||||||
| Urban | −0.09 | .39 | −0.08 | .43 | 0.09 | .14 | 0.09 | .14 | ||||||||
| Region | ||||||||||||||||
| Northeast | Reference | Reference | Reference | Reference | ||||||||||||
| Midwest | 0.03 | .85 | 0.15 | .26 | −0.26 | .00 | −0.19 | .03 | ||||||||
| South | −0.08 | .47 | 0.06 | .58 | −0.14 | .06 | −0.09 | .25 | ||||||||
| West | −0.21 | .08 | −0.06 | .63 | −0.15 | .08 | −0.08 | .33 | ||||||||
| Family income | ||||||||||||||||
| More than 200% FPL | Reference | Reference | ||||||||||||||
| Less than 100% FPL | −0.20 | .02 | −0.09 | .14 | ||||||||||||
| 100–200% FPL | −0.09 | .27 | −0.17 | .00 | ||||||||||||
| Usual source of care | 1.10 | .00 | 0.41 | .00 | ||||||||||||
| Unemployed | 0.03 | .74 | 0.26 | .00 | ||||||||||||
Note. Model 1: recession indicator + citizenship + race/ethnicity + age + sex/gender + marital status; model 2: model 1 + health; model 3: model 2 + education + English response + urban/rural + US Census Region; model 4: model 3 + family income + usual source of care + employment status.
Source: 2005–2006 and 2008–2009 Medical Expenditure Panel Survey data.
The second part of the two-part model implemented a multivariate log-linear regression analyses between citizens (the reference group) and noncitizens sorted by time of U.S. residence. This model estimated the total change in health spending (overall or specific measures, respectively) among those who reported any health spending (Tables2 and 3). These conditional models of changes in the share of health care cost were estimated as:
| (2) |
where Y2 is the natural logarithm of health spending for those with any health care expenditures and other terms mirror those defined above.
Table 3.
Two-Part Multivariate Analysis of Different Types of Health Spending before and during the Great Recession among the Uninsured Population: Part 1 – Any Cost, Part 2 – Ln (Total Cost)
| Rx Spending | MD Visits Spending | ED Spending | Inpatient Spending | |
|---|---|---|---|---|
| Part 1 – Any cost | Or | Or | Or | Or |
| Before recession (2005–2006) | Ref | Ref | Ref | Ref |
| Recession indicator (2008–2009) | −0.08 | 0.04 | 0.13 | −0.21 |
| U.S. citizens | Ref | Ref | Ref | Ref |
| Non-U.S. citizens ≤5 years | −0.09 | 0.02 | −0.72* | 0.61* |
| Non-U.S. citizens >5 years | −0.04 | 0.10 | −0.15 | 0.38 |
| Non-U.S. citizens ≤5 years × recession indicator | −0.07 | −0.27 | −0.10 | 0.14 |
| Non-U.S. citizens >5 years × recession indicator | 0.20 | −0.03 | −0.32 | −0.18 |
| Part 2 – Ln (total cost) | Coef | Coef | Coef | Coef |
| Before recession (2005–2006) | Ref | Ref | Ref | Ref |
| Recession indicator (2008–2009) | −0.50*** | 0.01 | 0.17 | 0.15 |
| U.S. citizens | Ref | Ref | Ref | Ref |
| Non-U.S. citizens ≤5 years | −0.32 | 0.04 | 0.20 | 0.34 |
| Non-U.S. citizens >5 years | 0.21 | 0.06 | −0.41 | 0.03 |
| Non-U.S. citizens ≤5 years × recession indicator | 0.00 | 0.33 | 0.42 | −1.06* |
| Non-U.S. citizens >5 years × recession indicator | −0.44*** | 0.03 | 0.33 | −0.44 |
| Covariates | Yes | Yes | Yes | Yes |
Note. “Recession indicator” corresponds to a dichotomous variable equal to zero for wave 1 (2005–2006) and equal to 1 for wave 2 (2008–2009). All regressions used Model 3 specification, which controlled for all covariates. They are not shown for brevity but are available upon request. MD visits: physician visits Rx: prescription drugs. ED: emergency department.
Statistically significant differences are ***p < .001; **p < .01; *p < .05.
Source: 2005–2006 and 2008–2009 Medical Expenditure Panel Survey data.
A stepwise estimation with four model specifications test for the robustness of the main results and analyze the role of health status, family income, usual source of care, and unemployment status as potential mediator factors (Table2). The analyses do not formally test for mediation of these factors as this study focuses on the association between health spending and the timing of the GR. Model 1 included the recession indicator, citizenship and time of U.S. residence, race/ethnicity, age, sex, and marital status. Model 2 appended health status. Model 3 added to this specification education, English response, rural/urban residence, and U.S. Census region. Model 4 appended to Model 3 family income, employment status, and having a usual source of care. Two-part models for specific health-spending measures used Model 4 specification. It is important to acknowledge that standard errors in interaction term logit models were adjusted accordingly (Ai and Norton 2003). The study used Stata command “tpm” to estimate the two-part model outcomes (Belotti et al. 2012). All regressions were adjusted for sampling weights provided in MEPS to ensure that our results were nationally representative of the noninstitutionalized civilian U.S. population.
Average health spending before and during the GR for citizens and noncitizens was predicted using the outcomes from the two-part model (Figure1). This analysis took into account population differences and their respective probabilities of reporting health spending. The natural logarithm of health spending was first transformed to a U.S. dollar figure using a smearing estimation (Duan 2011). Specifically, the estimated residual of the multivariate regression was substituted to obtain an estimate of the smearing factor. Consistent estimates of retransformed average health spending were calculated using the smearing factors, under the assumption of homoscedasticity in the error term. The predicted figure of health spending was subsequently multiplied by the predicted probability of reporting any health spending from the first part of the two-part model. Health-spending figures were adjusted to constant U.S. dollars for the year 2010.
Figure 1.
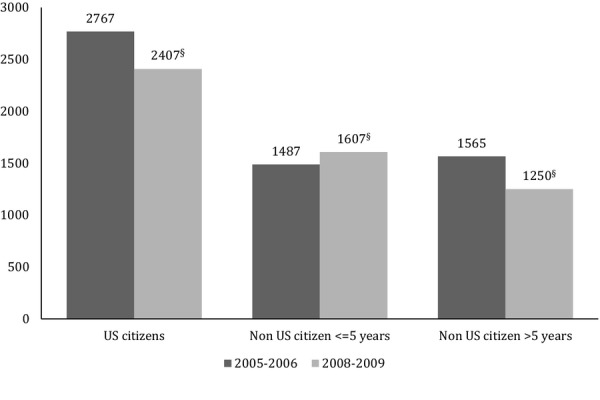
Estimated Total Health Spending before and during the Great Recession among the Uninsured Population by Citizenship and Nativity StatusNote. Predicted health spending was estimated using the two-part model outcomes. By contrast with average means shown in Table1, predicted spending in Figure1 accounts for population differences. Natural log values (Ln) of health spending were first transformed to monetary values using a smearing estimation. This predicted value was multiplied by the predicted probability of reporting any health spending (Prob). All costs were adjusted using U.S. dollars of 2010. Health spending before the recession (2005–2006) was the reference group for each citizenship/nativity category. Statistically significant differences are §p < .001, ‡p < .01, †p < .05.Source: 2005–2006 and 2008–2009 Medical Expenditure Panel Survey data.
Study Results
Table1 presents the sample summary statistics reporting whether uninsured individuals had any health spending and average health spending (if any) in wave 1 (2005–2006) and wave 2 (2008–2009) for each population and spending category. In wave 1, uninsured noncitizens had lower probabilities of reporting health spending (overall, and for specific measures, respectively) compared to uninsured U.S. citizens (reference group). In addition, corresponding average health-spending measures were consistently lower. Most differences were statistically significant with a few exceptions for specific average health-spending categories such as physician visits, ED, and inpatient spending, which were likely to be nonsignificant due to small sample sizes of noncitizens in these categories.
Probability differences of reporting any health spending were more widespread between U.S. citizens and noncitizens ≤5 years residence (75 percent vs. 66 percent before the recession, and 75 percent vs. 62 percent during the recession) compared with differences between the former and noncitizens >5 years (75 percent vs. 71 percent before the recession, and 75 percent vs. 70 percent during the recession). Average spending was $2,405, $1,604, and $1,552 for U.S. citizens, noncitizens ≤5 years, and noncitizens >5 years residence, respectively. In wave 2, health-spending differences between uninsured U.S. citizens and noncitizens remained relatively constant with a few exceptions. In the comparison of means for each spending category before and during the GR, only Rx spending reduced significantly for U.S. citizens ($893 before and $749.07 during the recession) and noncitizens >5 years residence ($487.74 before and $311.9 during the recession). According to Table1, the share of uninsured African Americans and individuals aged 45–54 years of age increased during the GR. By contrast, the share of high-income uninsured individuals declined during the GR.
Table2 shows the first two-part multivariate regression analyses corresponding to overall health spending among uninsured U.S. citizens and noncitizens before and during the GR. A stepwise estimation with four model specifications shows the associations between health spending (the probability of reporting any spending and average spending if any) and the timing of the recession. Models 1–3 (a,b) exclude health status, family income, usual source of care, and unemployment status to test whether these measures were potential mediating mechanisms between the timing of the recession and health spending.
In the first part of the two-part regression analyses, results for Models 1–4a consistently show that the single category with reduced health-spending probability (marginal effects range from −0.59 to −0.63) that was statistically significant (p < .05) during the GR corresponds to noncitizens with ≤5 years residence (recent immigrants). Coefficients for U.S. citizens and noncitizens >5 years were consistently statistically nonsignificant. These findings are robust to the stepwise inclusion of health status, income, usual source of care, and unemployment status among other covariates.
In the second part of the two-part regression analyses, Models 1–4b show that average spending (if any) was consistently lower among uninsured individuals during the GR (average probabilities range from −12 in Model 1b to −14 percent in Models 4b), controlling for different set of covariates. As in the first part of the model, Models 1–4b show that recent immigrants were the single population category with statistically different health spending during the recession. Average health spending (if any) increased by 27 percent according to Model 4b that accounts for all covariates. This amount was estimated from the difference between the coefficient of the recession indicator (−0.14) and the interaction term corresponding to noncitizens with ≤5 years residence (0.41). In addition, results among those who reported any health spending show a robust and statistically significant relationship between health care spending and reporting any chronic condition (Model 2b), education, and region of residence (Model 3b), family income, usual source of care, and unemployment status (Model 4b).
Table3 shows the results of the two-model multivariate regression models including all covariates to estimate the association of the GR with specific health-spending measures. According to the analyses, noncitizens >5 years residence reported a 94 percent reduction on average spending in prescription drugs (−0.50 from Recession indicator + −0.44 of interaction term) during the GR compared to U.S. citizens. Recent immigrants (≤5 years residence) reported reduced probability of any ER utilization (marginal effect −0.72) and increased probability of inpatient care spending (marginal effect 0.61). In addition, recent immigrants reported a 106 percent reduction on average spending on inpatient care (if any) during the GR compared to U.S. citizens. Covariates in Table3 are not shown in the interest of brevity but are available upon request.
Using the results from the two-part regression model, average health spending for uninsured citizens and noncitizens was estimated before and during the GR, taking into account population differences and their respective health-spending probabilities. Figure1 shows a decline in predicted health spending for the three population categories during the GR. Citizens' health spending experienced an estimated drop of 13 percent from $2,767 to $2,407 before and during the GR, respectively. Likewise, health spending for noncitizens with >5 years residence declined by 20 percent from $1,565 to $1,250, before and during the GR, respectively. By contrast, spending for recent immigrants increased by 8 percent from $1,487 to $1,607. All these health-spending differences were statistically significant. It is important to emphasize that health-spending differences in Table1 and those on Ln (total cost) in Tables2 and 3 are only among individuals reporting any spending. By contrast, results in Figure1 report average spending in the full sample not only among those with any spending.
Discussion
This study shows that health spending among the uninsured differed by citizenship status, time of U.S. residence, and GR timing. Citizens compared to noncitizens were more likely to report any health spending and had higher average spending (if any) for overall and specific health-spending measures. These differences, however, disappeared for noncitizens >5 years residence when population characteristics were included in the multivariate regression models (Tables2 and 3).
The study findings also showed a consistent decline in reported health spending during the GR for both citizens and noncitizens >5 years residence, either with unadjusted health-spending figures (Table1) and when health spending was predicted adjusting for population characteristics and for the probability of reporting any health spending (Figure1). By contrast, recent immigrants (≤5 years residence) reported a statistically significant reduction on the probability of reporting any health spending during the GR according to the two-part regression analyses.
The second main finding shows that average health spending among recent immigrants who reported any was 27 percent higher during the GR compared to citizens. This finding would suggest that recent immigrants might have forgone care during the recession as shown in the reduced likelihood of reporting any spending. Higher health spending for those with any may be due to health conditions that could have become critical as they progressed unchecked. The first part of our two-part model estimation shows that recent immigrants were less likely to report any spending during the GR. Thus, higher reported spending among recent immigrants could partly be due to higher average spending resulting from fewer individuals reporting any health spending.
This study hypothesized that health status, income, usual source of care, and unemployment status could potentially mediate the relationship between health spending, citizenship, and time of U.S. residence among the uninsured. The analyses, shows that while these factors are significantly related with average health spending (if any), higher average spending among recent immigrants during the GR was robust to the stepwise inclusion of these measures.
Increased average spending among recent immigrants was confirmed when predicted health spending was estimated in Figure1. By contrast with overall reductions on average spending observed among uninsured citizens and noncitizens >5 years residence, average spending for uninsured recent immigrants increased by 8 percent during the recession when adjusted for the lower likelihood of having any cost. These results would confirm that recent immigrants are forgoing essential care, which could result in higher health expenditures in the future when these problems become life threatening. It is important, however, to highlight that a lower share of the population in the three categories reported health spending during the GR, suggesting that the recession affected all uninsured populations to some degree. A share of health-spending variability could also be related with changes in the composition of the uninsured and the number of individuals in each population category forgoing or shifting health spending across different categories.
This study also investigated whether the composition of specific measures of health spending (if any) could have shifted as a consequence of the GR. Our findings show that noncitizens >5 years residence reported a significant reduction on prescription drug average spending (94 percent) during the GR. The adjustment in prescription drug spending is consistent with previous research (Chen et al. 1971). These findings may indicate that the demand for Rx was more elastic during the recession for these two population groups. In addition, as it has been discussed by previous studies, declines on prescription drug spending could be related with the development of fewer blockbuster drugs, the adoption of tiered formularies, and increased use of generics (Holahan and McMorrow 2010).
In the case of reporting any spending on physician visit, ED, and inpatient spending, differences between uninsured citizens and noncitizens remained relatively constant and nonstatistically significant during the GR. The most important changes were an increased probability of reporting inpatient spending and a reduced probability of reporting ED spending. Interestingly, uninsured individuals with 100–200 percent FPL observed a statistically significant decline of 17 percent in health spending compared to uninsured individuals with <100 percent FPL. Perhaps this difference is explained by Emergency Medicaid eligibility, as uninsured individuals <100 percent of FPL would qualify, while those above this threshold would not. Meaningful differences in other categories of spending are possible as differences are large as suggested by our comparison of means analyses; however, the lack of significant differences on physician visits or ED spending could be due to small sample sizes of noncitizens on these particular categories.
While the study results primarily showed the association between the timing of the GR with shifts on health spending between citizens and noncitizens, the heterogeneous response of health spending along the citizenship and U.S. residency lines was suggestive of different impacts of the GR among the uninsured. Our study findings suggest that average declines in total spending were perhaps driven by the decline in the share of the population reporting any spending. According to the study findings, recent immigrants were more likely to report better health status and fewer incidences of chronic conditions; however, those with health problems may be more likely to delay or forgo health care, which could contribute to health complications and health deterioration. Higher spending by fewer recent immigrants may originate from individuals with fewer possibilities of substituting or cutting down on health spending, perhaps those with chronic or life-threatening conditions.
The study findings are indicative of more vulnerability among recent immigrants to the negative consequences of economic shocks. They also coincide with the period of time that documented immigrants have to observe before they become eligible for federal assistance programs such as Medicaid, unemployment insurance, and supplemental nutritional assistance, among others. These programs probably tempered household income and health spending for millions of eligible citizen and noncitizen households during the GR (Seefeldt and Graham 2013).
When differences in population characteristics and probabilities of reporting any spending were addressed, differences between citizens and noncitizens with >5 years residence became statistically nonsignificant. These findings could suggest that time of U.S. residence and in less extent citizenship are driving our findings. Future research should investigate whether citizenship or residency rules are independent factors deterring access to government assistant programs. Likewise, this study implemented a stepwise estimation to test the robustness of the main results to the inclusion of potential mediator factors such as income, health status, usual source of care, and unemployment status. Future research should formally test these mediating relationships. As undocumented migrants are ineligible for federal benefits, future research should investigate whether identified differences would hold after accounting for documentation status.
The heterogeneous distribution of uninsured low-income noncitizen residents across the U.S. and eligibility differences in Medicaid expansion coverage across states would leave approximately 3.5 million low-income noncitizens uninsured (State Health Access Data Assistance Center 2014). Consequently, it is likely that problems associated with uninsured status among low-income noncitizen immigrants would persist or worsen in some regions if present trends continue. Understanding the response of uninsured individuals to income shocks, such as the GR, and its corresponding adjustment to health spending portray some of the ACA limitations with respect to immigrant coverage.
The withdrawal of federal support for immigrant health coverage has shifted the burden of covering this population to state and local safety net providers (Kaiser Commission on Medicaid and the Uninsured 2010). Almost half of U.S. states, particularly those with large immigrant populations, provide some type of state- and county-level coverage (Fortuny and Chaudry 1964). The lack of federal funding, however, makes it vulnerable to cuts, more stringent eligibility criteria, and swings in antiimmigrant sentiment. If present trends continue, noncitizens who will remain uninsured would continue to have incentives to forgo essential care until health conditions become life threatening. Safety net hospitals would continue to face uncompensated care costs from this particular population group that would remain uninsured. The uncompensated care burden, however, may shift to hospitals located in areas with larger number of uninsured noncitizen immigrants and may shift away from primary care in those areas.
Limitations
Our study used a pooled cross-sectional design, which limited the analyses of differences over time. Health-spending and health status data were self-reported. Recall bias and other types of measurement error may affect the accuracy of health-spending measures. While MEPS recorded if uninsured individuals were U.S. citizens or noncitizen residents, it did not identify undocumented individuals. Undocumented immigrants are likely to be overrepresented in the noncitizen category with >5 years of U.S. residence as recent estimates show that nearly two-thirds of undocumented immigrants have lived in the United States for at least a decade (PEW Hispanic Center 2013). Health spending may be inaccurate for foreign-born individuals who are not fluent in either English or Spanish as the study was only administered in these two languages or a combination of them. Our results for physician visits, ED, and inpatient spending should be interpreted with caution as sample sizes for noncitizens were small for these spending categories.
Conclusions
The ACA will procure affordable health insurance coverage for the majority of uninsured citizen and noncitizen population in our study. Important gaps, however, will remain among recent and undocumented immigrants. Our study findings suggest that uninsured individuals reacted differently to the negative consequences of the GR. Uninsured U.S. citizens and noncitizens with more of 5 years of U.S. residence observed similar responses to this economic shock. By contrast, uninsured recent immigrants who were not eligible for federal assistance programs and experienced a heterogeneous provision of state-based benefits were less likely to report any health spending, and those who did spent more. These findings portray the existing vulnerability of recent immigrants to income shocks such as economic recessions. Easing existing health insurance exclusion rules for recent immigrants could potentially be considered to address coverage gaps that would persist among U.S. immigrants under the ACA implementation.
Acknowledgments
Joint Acknowledgment/Disclosure Statement: We gratefully acknowledge support from the Eunice Kennedy Shiver National Center for Child Health and Human Development grant R24 HD041041, Maryland Population Research Centre Seed Grant Program, the Agency for Healthcare Research & Quality R-03 HS022634-01, and the John Randolph Haynes Foundation. We thank two anonymous reviewers for helpful feedback on earlier drafts of the manuscript.
Disclosures: None.
Disclaimers: None.
Supporting Information
Additional supporting information may be found in the online version of this article:
Author Matrix.
References
- AHRQ. 2008. Agency for Health Research and Quality “ Medical Expenditure Panel Survey ”. [accessed on September 8, 2013]. Available at http://www.meps.ahrq.gov/mepsweb/
- Ai CR. Norton EC. Interaction Terms in Logit and Probit Models. Economics Letters. 2003;80(1):123–9. and. “. ”. [Google Scholar]
- ASPE Issue Brief. The Affordable Care Act: Coverage Implications and Issues for Immigrant Families. Washington, DC: U.S. Department of Health and Human Services; 2012. [Google Scholar]
- Belotti F, Dep P, Manning WG. Norton E. tpm: Estimating Two-part Models. The Stata Journal. 2012;vv(ii):1–13. and. “. ”. [Google Scholar]
- Berk ML, Schur CL, Chavez LR. Frankel M. Health Care Use among Undocumented Latino Immigrants. Health Affairs (Millwood) 2000;19(4):51–64. doi: 10.1377/hlthaff.19.4.51. and. “. ”. [DOI] [PubMed] [Google Scholar]
- Catalano R, Goldman-Mellor S, Saxton K, Margerison-Zilko C, Subbaraman M, LeWinn K. Anderson E. The Health Effects of Economic Decline. Annual Review of Public Health. 2011;32:431–50. doi: 10.1146/annurev-publhealth-031210-101146. and. “. ”. [DOI] [PMC free article] [PubMed] [Google Scholar]
- Chen J, Vargas-Bustamante A, Mortensen K. Thomas SB. Using Quantile Regression to Examine Health Care Expenditures during the Great Recession. Health Services Research. 2014;49(2):705–30. doi: 10.1111/1475-6773.12113. and. “. ”. [DOI] [PMC free article] [PubMed] [Google Scholar]
- Cragg JG. Some Statistical Models for Limited Dependent Variables with Application to Demand for Durable Goods. Econometrica. 1971;39(5):829–44. “. ”. [Google Scholar]
- Cunningham PJ. Despite the Recession's Effects on Incomes and Jobs, the Share of People with High Medical Costs Was Mostly Unchanged. Health Affairs (Millwood) 2012;31(11):2563–70. doi: 10.1377/hlthaff.2012.0148. “. ”. [DOI] [PubMed] [Google Scholar]
- Duan N. Smearing Estimate—A Nonparametric Retransformation Method. Journal of the American Statistical Association. 1983;78(383):605–10. “. ”. [Google Scholar]
- Fortuny and Chaudry. A Comprehensive Review of Immigrant Access to Health and Human Services. Washington, DC: U.S. Department of Health and Human Services; 2011. [Google Scholar]
- Goldberger AS. Econometric Theory. New York: John Wiley & Sons; 1964. [Google Scholar]
- Goldman DP, Smith JP. Sood N. Immigrants and the Cost of Medical Care. Health Affairs (Millwood) 2006;25(6):1700–11. doi: 10.1377/hlthaff.25.6.1700. and. “. ”. [DOI] [PubMed] [Google Scholar]
- Holahan J. The 2007-09 Recession and Health Insurance Coverage. Health Affairs (Millwood) 2011;30(1):145–52. doi: 10.1377/hlthaff.2010.1003. “. ”. [DOI] [PubMed] [Google Scholar]
- Holahan J. McMorrow S. Medicare and Medicaid Spending Trends and the Deficit Debate. New England Journal of Medicine. 2012;367(5):393–5. doi: 10.1056/NEJMp1204899. and. “. ”. [DOI] [PubMed] [Google Scholar]
- Hurd MaSR. Effects of the Financial Crisis and Great Recession on American Households. Santa Monica, CA: RAND Labor & Population; 2010. [Google Scholar]
- Johnson KR. Public Benefits and Immigration – The Intersection of Immigration Status, Ethnicity, Gender, and Class. UCLA Law Review. 1995;42(6):1509–75. “. ”. [Google Scholar]
- Kaiser Commission on Medicaid and the Uninsured. Medicaid and SCHIP Eligibility for Immigrants. Washington, DC: Kaiser Commission on Medicaid and the Uninsured; 2006. [Google Scholar]
- Kaiser Commission on Medicaid and the Uninsured. Summary of New Health Reform Law. Washington, DC: Kaiser Family Foundation; 2010. Focus on Health Care. [Google Scholar]
- Kenney and Huntress. The Affordable Care Act: Coverage Implications and Issues for Immigrant Families. Washington, DC: The Urban Institute; 2012. [Google Scholar]
- Ku L. Health Insurance Coverage and Medical Expenditures of Immigrants and Native-Born Citizens in the United States. American Journal of Public Health. 2009a;99(7):1322–8. doi: 10.2105/AJPH.2008.144733. “. ”. [DOI] [PMC free article] [PubMed] [Google Scholar]
- Ku L. Medical and Dental Care Utilization and Expenditures under Medicaid and Private Health Insurance. Medical Care Research and Review. 2009b;66(4):456–71. doi: 10.1177/1077558709334896. “. ”. [DOI] [PubMed] [Google Scholar]
- Martin A, Lassman D, Whittle L. Catlin A. Recession Contributes to Slowest Annual Rate of Increase in Health Spending in Five Decades. Health Affairs (Millwood) 2011;30(1):11–22. doi: 10.1377/hlthaff.2010.1032. and. “. ”. [DOI] [PubMed] [Google Scholar]
- Mills Compton and Golden. Assessing the Evidence about Work Support Benefits and Low-Income Families. Washington, DC: The Urban Institute; 2011. [Google Scholar]
- Mohanty SA, Woolhandler S, Himmelstein DU, Pati S, Carrasquillo O. Bor DH. Health Care Expenditures of Immigrants in the United States: A Nationally Representative Analysis. American Journal of Public Health. 2005;95(8):1431–8. doi: 10.2105/AJPH.2004.044602. and. “. ”. [DOI] [PMC free article] [PubMed] [Google Scholar]
- Mortensen K. Chen J. The Great Recession and Racial and Ethnic Disparities in Health Services Use. Journal of the American Medical Association Internal Medicine. 2013;173(4):315–7. doi: 10.1001/jamainternmed.2013.1414. and. “. ”. [DOI] [PubMed] [Google Scholar]
- Okie S. Immigrants and Health Care—At the Intersection of Two Broken Systems. New England Journal of Medicine. 2007;357(6):525–9. doi: 10.1056/NEJMp078113. “. ”. [DOI] [PubMed] [Google Scholar]
- PEW Hispanic Center. A Nation of Immigrants: A Portrait of the 40 Million, Including 11 million Unauthorized. Washington, DC: Pew Research Center; 2013. [Google Scholar]
- Seefeldt K. Graham JD. America's Poor and the Great Recession. Bloomington, IN: Indiana University Press; 2013. [Google Scholar]
- State Health Access Data Assistance Center. State Estimates of the Low-Income Uninsured Not Eligible for the ACA Medicaid Expansion. Minneapolis, MN: Robert Wood Johnson Foundation; 2013. [Google Scholar]
- Stimpson JP, Wilson FA. Su D. Unauthorized Immigrants Spend Less Than Other Immigrants and US Natives on Health Care. Health Affairs (Millwood) 2013;32(7):1313–8. doi: 10.1377/hlthaff.2013.0113. and. “. ”. [DOI] [PubMed] [Google Scholar]
- Vargas Bustamante A. Chen J. Health Expenditure Dynamics and Years of U.S. Residence: Analyzing Spending Disparities among Latinos by Citizenship/Nativity Status. Health Services Research. 2011;47(2):794–818. doi: 10.1111/j.1475-6773.2011.01278.x. and. “. ”. [DOI] [PMC free article] [PubMed] [Google Scholar]
- Wooldridge J. Econometric Analysis of Cross Section and Panel Data. Cambridge, MA: MIT Press; 2002. [Google Scholar]
- Zimmermann W. Tumlin KC. Patchwork Policies: State Assistance for Immigrants under Welfare Reform. Washington, DC: The Urban Institute; 1999. [Google Scholar]
- Zuckerman S, Waidmann TA. Lawton E. Undocumented Immigrants, Left Out of Health Reform, Likely to Continue to Grow as Share of the Uninsured. Health Affairs (Millwood) 2011;30(10):1997–2004. doi: 10.1377/hlthaff.2011.0604. and. “. ”. [DOI] [PubMed] [Google Scholar]
Associated Data
This section collects any data citations, data availability statements, or supplementary materials included in this article.
Supplementary Materials
Author Matrix.