

Abstract
Objective
To characterize hospitals based on patterns of their combined financial and clinical outcomes for heart failure hospitalizations longitudinally.
Data Source
Detailed cost and administrative data on hospitalizations for heart failure from 424 hospitals in the 2005–2011 Premier database.
Study Design
Using a mixture modeling approach, we identified groups of hospitals with distinct joint trajectories of risk-standardized cost (RSC) per hospitalization and risk-standardized in-hospital mortality rate (RSMR), and assessed hospital characteristics associated with the distinct patterns using multinomial logistic regression.
Principal Findings
During 2005–2011, mean hospital RSC decreased from $12,003 to $10,782, while mean hospital RSMR declined from 3.9 to 3.2 percent. We identified five distinct hospital patterns: highest cost and low mortality (3.2 percent of the hospitals), high cost and low mortality (20.4 percent), medium cost and low mortality (34.6 percent), medium cost and high mortality (6.2 percent), and low cost and low mortality (35.6 percent). Longer hospital stay and greater use of intensive care unit and surgical procedures were associated with phenotypes with higher costs or greater mortality.
Conclusions
Hospitals vary substantially in the joint longitudinal patterns of cost and mortality, suggesting marked difference in value of care. Understanding determinants of the variation will inform strategies for improving the value of hospital care.
Keywords: Cost, mortality, value of care, trajectory, heart failure
Hospital care is the most expensive component of the national health expenditure in the United States, totaling $814.0 billion in 2010 (Martin et al. 2012). Hospital cost per inpatient stay averaged $9,700 in 2010, up from $6,700 in 1997 (Pfuntner, Wier, and Steiner 2013). These average estimates, however, may obscure substantial differences among hospitals. Several recent studies have highlighted hospital variation in health care spending that is not explained by patient characteristics (Timbie and Normand 2008; Chen et al. 2010; Miller et al. 2011; Robinson 2011).
While these findings may highlight opportunities for cost savings, lowering costs could affect quality and result in unintended health consequences for patients. To provide a perspective on the value of hospital care, identification of hospital practice patterns requires combining cost and patient outcomes. In addition, we should give attention to temporal trends in these outcomes to gain a more comprehensive view of individual hospital performance and to identify hospitals that perform consistently well over time.
Heart failure is an ideal condition to study when assessing value of hospital care. It is among the most common reasons for hospital admission, is associated with considerable risk for morbidity and mortality, and has substantial costs (Thomas and Rich 2007; Wier et al. 2011; Pfuntner, Wier, and Steiner 2013). There has been evidence of wide variation in hospital practices and use of technologies for patients with heart failure, such as admission to intensive care units (ICUs) and performance of percutaneous or surgical procedures, with important implications for hospital costs and patient outcomes (Chen et al. 2012; Safavi et al. 2013).
Borrowing the term “phenotype” from the genetics literature, which characterizes the observable traits of an organism, we sought to identify hospital phenotypes featuring distinct patterns in value of care for heart failure hospitalizations. Specifically, we classified hospitals on the basis of their combined pattern of in-hospital cost and in-hospital mortality using data from a large nationwide collaborative network of hospitals. We further examined how hospital structural and utilization characteristics were associated with specific phenotypes. In-hospital mortality is an important indicator of early success in the treatment of patients with heart failure, is important to patients, and has been shown to be a reasonable marker for hospital performance despite its limitation in lack of a standardized follow-up time (Rosenthal et al. 2000; Borzecki et al. 2010). Characterizing hospital phenotypes in value of care is essential to identifying institutions that deliver high-quality care most efficiently and understanding how they achieve that level of performance.
Methods
Data Source and Sample Population
We used the Premier database maintained by Premier, Inc., Charlotte, NC. The database contains administrative and operational data from a voluntary network of hospitals in the United States and ancillary providers across the country, representing more than 330 million discharges. Premier deidentified patient data in accordance with the Health Insurance Portability and Accountability Act and assigned a random hospital identifier. The Yale University Human Investigation Committee exempted this study protocol because it is not considered Human Subjects Research as defined by the Office of Human Research Protections.
We included in the study cohort all hospitalizations from January 1, 2005, through December 31, 2011, with a principal diagnosis of heart failure, that is, International Classification of Diseases, Ninth Revision, Clinical Modification (ICD-9-CM) codes 402.x1, 404.x1, 404.x3, and 428.xx. We excluded hospitalizations for patients who were younger than 18 years at the time of admission or were transferred to/from another acute care facility; hospitalizations attended by pediatricians; and hospitalizations involving a left ventricular assist device (LVAD) implantation or heart transplant, as they were not representative of the general heart failure population.
Patient and Hospital Characteristics
Patient characteristics available in the Premier database included age, sex, race/ethnicity, and insurance status. We classified patient comorbidities based on diagnosis codes in the hospital discharge file and the Healthcare Cost and Utilization Project software according to methods described by Elixhauser et al. (1998).
Hospital characteristics included bed count, teaching status, Census region, and population served (urban vs. rural). We constructed additional measures of hospital characteristics using pooled data on each hospital's heart failure hospitalizations during 2005–2011. This included (1) the average annual volume of heart failure hospitalizations; (2) the proportions of hospitalizations that were covered by Medicare or Medicaid, were African American, or had a cardiologist as the attending physician; (3) the median length of stay; (4) the proportions of hospitalizations with admission to an ICU; and (5) the proportion of hospitalizations involving any cardiovascular percutaneous or surgical procedures (Appendix SA2) (Chen et al. 2012). Although we excluded hospitalizations involving LVAD implantation or heart transplant, we measured whether a hospital ever performed these procedures during the study period as another hospital characteristic.
Measurement of Value in Hospital Care
We measured each hospital's value of care by jointly characterizing its in-hospital cost and mortality. For costs, we included all hospital costs during the inpatient stay (excluding physician costs). Drawing on detailed accounting cost data from participating hospitals, the Premier database contains a date-stamped log of all billed items and related costs during hospitalizations (e.g., medications, laboratory, diagnostic, and therapeutic services). It has been widely used in previous studies assessing costs of hospital care (Pasquali et al. 2011). To remove geographic variation in input prices, we first calculated a standardized unit cost for each charge item in each year by dividing the total cost for that item by its total quantities of utilization across all heart failure hospitalizations in that year. We then applied these standardized unit costs to estimate the cost of each hospitalization for the corresponding year based on the quantity of each charge item used during the hospital stay (Lagu et al. 2013). Hospital costs derived this way more appropriately reflect variation in hospital resource utilization. All cost estimates were adjusted to 2011 U.S. dollars using the Centers for Medicare & Medicaid Services (CMS) Prospective Payment System hospital input price index (Centers for Medicare and Medicaid Services 2012). To reduce the influence of outliers, we Winsorized the data within each year at the 0.5th and 99.5th percentiles (Dixon and Yuen 1974; Jha et al. 2009; Adams et al. 2010). We measured in-hospital mortality because patients were deidentified in our database and we were not able to determine their vital status after discharge.
Statistical Analysis
We calculated risk-standardized cost (RSC) for each hospital-year by adjusting for differences in patient case mix across hospitals and over time. We modeled cost data using a hierarchical generalized linear model (HGLM) with a log link and a Gamma distribution while adjusting for patient age and comorbidities, and allowing for a random intercept for each hospital-year to account for the rightly skewed cost data and the clustering of hospitalizations within each hospital (Appendix SA3). We chose Gamma distribution and log link function based on results from the modified Park test and Box–Cox test (Manning and Mullahy 2001; Osborne 2010).
We calculated RSC for each hospital-year by dividing the sum of predicted costs across all heart failure hospitalizations in this hospital-year (conditional on the hospital's random effect) by the sum of expected costs across these hospitalizations based on the HGLM model and then multiplying the national average observed cost of all heart failure hospitalizations for the corresponding year. Likewise, we estimated the risk-standardized mortality rate (RSMR) for each hospital-year using an HGLM with a logit link and binomial distribution. The model included a hospital-year random effect and adjustment for patient age and comorbidities as described elsewhere (Krumholz et al. 2006).
To identify hospital phenotypes in value of care, we applied a group-based, semiparametric mixture modeling approach via a SAS macro PROC TRAJ (Nagin 2005; Jones and Nagin 2007). Using longitudinal hospital-level data on RSC and RSMR, this approach identified classes of hospitals based on their combined trajectory pattern of in-hospital cost and mortality over time. Each identified hospital phenotype was defined by a distinct cost-mortality pattern, as featured by a unique pair of RSC and RSMR trajectories. The model parameters (shapes of the trajectories in each phenotype and the size of each phenotype) were estimated via maximum likelihood estimation (Appendix SA4). Both RSC and RSMR were best modeled as a linear function of time, where time was measured as the number of years since 2005. We assessed models with different number of phenotypes and determined the optimal number of phenotypes based on several criteria: the Bayesian Information Criteria index, average posterior probability of phenotype, 95 percent confidence intervals (CIs) of adjacent trajectories, and whether additional phenotypes identified in successive models represent substantially distinct phenotypes or a mere subdivision of major phenotypes already identified.
We then examined the association of hospital phenotypes with various hospital characteristics via bivariate analyses and a multinomial logistic regression model where the identified phenotypes were the dependent variable and hospital characteristics were candidate explanatory variables. Covariates were selected into the model via stepwise selection.
We included hospitalizations from all hospitals for the risk-adjustment model and the calculation of hospital-level RSC and RSMR. However, to adequately model hospitals' longitudinal trajectories, we limited our phenotype analysis to hospitals with at least 2 years of data. Hospitals with less than 25 heart failure hospitalizations in any of the 2 years were also excluded to provide more reliable estimates of hospital-level RSC and RSMR. When compared with a sensitivity analysis, including all hospitals with any heart failure hospitalization during the study period, there was no meaningful difference in the results.
Several additional sensitivity analyses were conducted to test the robustness of our findings. First, we estimated costs with and without adjustment for patients' mortality status. The results showed no change in hospital phenotype membership. Second, because some surgical procedures were associated with high up-front costs but longer term benefits that could not be adequately captured in our in-hospital data, we performed a sensitivity analysis after excluding hospitalizations involving any cardiovascular percutaneous or surgical procedures.
Results
Trends in Cost and Mortality
We identified 921,747 hospitalizations for heart failure from 491 hospitals. Of these, 424 hospitals had 25 or more hospitalizations for at least 2 years and were included in our phenotype analysis (with a total of 909,788 heart failure hospitalizations). These hospitals were mostly nonteaching, small to medium size, and served urban populations (Table1). Of the 424 hospitals, 397 (93.6 percent) had at least 3 years of data and 286 (67.5 percent) had data for all 7 years.
Table 1.
Sample Characteristics at the Hospital and Hospitalization Level
| Characteristics | Hospital Level (N = 424) n (%) | Hospitalization Level (N = 909,788) n (%) |
|---|---|---|
| Bed size | ||
| <200 | 148 (34.9) | 126,370 (13.9) |
| 200–400 | 166 (39.2) | 352,857 (38.8) |
| >400 | 110 (25.9) | 430,561 (47.3) |
| Teaching hospital | ||
| Yes | 115 (27.1) | 343,399 (37.7) |
| No | 309 (72.9) | 566,389 (62.3) |
| Census region | ||
| Midwest | 89 (21.0) | 172,186 (18.9) |
| Northeast | 70 (14.5) | 183,189 (20.1) |
| South | 180 (42.5) | 422,124 (46.4) |
| West | 85 (20.1) | 132,289 (14.5) |
| Urban/rural population served | ||
| Urban | 332 (78.3) | 809,609 (89.0) |
| Rural | 92 (21.7) | 100,179 (11.0) |
At the hospital level, RSC per heart failure hospitalization (after adjustment for inflation and patient case mix) decreased over time (mean ± SD: $12,003 ± 3,666 in 2005 vs. $10,782 ± 2,603 in 2011) (Table2). Mean RSMR declined from 3.9 percent in 2005 to 3.2 percent in 2011 among the hospitals. Both RSC and RSMR differed by 4- to 7-fold across the hospitals in each year; for example, in 2011, RSC ranged from $5,373 to $26,147, while RSMR varied from 1.6 to 9.7 percent.
Table 2.
Hospital Costs and In-Hospital Mortality among Inpatient Stays for Heart Failure, by Year
| 2005 | 2006 | 2007 | 2008 | 2009 | 2010 | 2011 | |
|---|---|---|---|---|---|---|---|
| Hospitalization level | |||||||
| Number of hospitalizations | 112,636 | 130,947 | 127,801 | 127,994 | 136,804 | 140,120 | 133,486 |
| Observed cost, mean (SD) | $11,486 (12,590) | $11,134 (11,496) | $11,490 (12,476) | $11,284 (11,929) | $11,097 (11,418) | $10,670 (10,812) | $10,466 (10,601) |
| Observed in-hospital mortality rate, % | 3.8 | 3.5 | 3.3 | 3.3 | 3.2 | 3.1 | 3.1 |
| Hospital level | |||||||
| Number of hospitals | 318 | 360 | 359 | 369 | 382 | 403 | 398 |
| Risk-standardized cost, mean (SD) | $12,003 (3,666) | $11,514 (3,022) | $11,924 (3,352) | $11,660 (3,118) | $11,429 (2,858) | $11,004 (2,679) | $10,782 (2,603) |
| Risk-standardized in-hospital mortality rate, mean (SD) | 3.9% (0.9) | 3.6% (0.9) | 3.4% (0.8) | 3.4% (0.8) | 3.3% (0.8) | 3.2% (0.7) | 3.2% (0.8) |
Note. SD, standard deviation. All costs are reported in inflation-adjusted 2011 U.S. dollars.
Hospital Phenotypes in Value of Care
We identified five distinct hospital phenotypes based on the RSC–RSMR joint trajectories: (1) highest cost and low mortality (phenotype 1, n = 14 hospitals); (2) high cost and low mortality (phenotype 2, n = 86 hospitals); (3) medium cost and low mortality (phenotype 3, n = 147 hospitals); (4) medium cost and high mortality (phenotype 4, n = 26 hospitals); and (5) low cost and low mortality (phenotype 5, n = 151 hospitals).
Figure1 shows the RSC and RSMR trajectories of each phenotype with 95 percent CIs. The average posterior probability of group membership, an indicator of a model's capacity to differentiate the phenotypes with higher value indicating better model performance, was greater than 0.92 for each of the phenotypes (Nagin 2005). The 95 percent CIs clearly distinguished the five RSC trajectories and the high versus low RSMR trajectories. Hospitals in phenotypes 2, 3, and 5 had comparable RSMR yet very distinct RSC, while hospitals in phenotypes 3 and 4 had similar RSC, but very different RSMR. Phenotype 1 exhibits high but decreasing RSC in conjunction with a low but gradually ascending RSMR.
Figure 1.
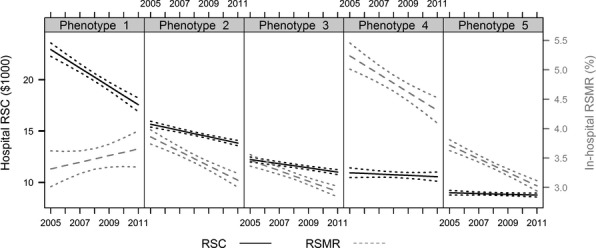
Distinct Hospital Phenotypes Identified by Jointly Modeling the Longitudinal Trajectory of In-Hospital Risk-Standardized Cost (RSC) and Risk-Standardized Mortality Rate (RSMR) Dotted lines reflect confidence intervals for each trajectory, based on the 95 percent confidence intervals of the point estimates in each year Phenotype 1: Highest cost and low mortality (n = 14 hospitals, 3.2 percent of the hospitals in sample) Phenotype 2: High cost and low mortality (n = 86 hospitals, 20.4 percent of the hospitals in sample) Phenotype 3: Medium cost and low mortality (n = 147 hospitals, 34.6 percent of the hospitals in sample) Phenotype 4: Medium cost and high mortality (n = 26 hospitals, 6.2 percent of the hospitals in sample) Phenotype 5: Low cost and low mortality (n = 151 hospitals, 35.6 percent of the hospitals in sample)
To minimize the potential confounding effect of any remaining patient case mix differences across hospitals, we further examined the cost-mortality trajectories of 103 urban teaching hospitals by phenotype. As urban teaching hospitals tend to be large referral centers caring for sicker patients, they likely have similar patient severity. We found that the variation across the phenotypes in the average trajectory of RSC and RSMR among these hospitals largely mirrors that observed in the overall sample (Appendix SA5). Our sensitivity analysis based on hospitalizations without cardiovascular percutaneous or surgical procedures revealed similar findings. Although the average RSC was lower than that of the overall sample, the general pattern of hospital variation persisted (Appendix SA6).
Hospital Characteristics Associated with Phenotypes
In bivariate analysis, phenotypes with higher RSC were more likely to be teaching hospitals, larger in size, serve urban populations, have a cardiologist as the attending physician, and perform cardiovascular percutaneous and surgical procedures compared with phenotypes with lower RSC (Appendix SA7). Hospitals in phenotypes with higher RSC were also more likely to perform LVAD or heart transplant, even though we excluded these hospitalizations from our analysis. However, there is substantial overlap in other hospital characteristics across the phenotypes. Rates of ICU admission did not differ across the phenotypes in bivariate analysis. Although length of stay differed significantly across the phenotypes in general, pair-wise comparisons showed no significant difference between some phenotypes (e.g., phenotypes 2 and 4 or phenotypes 1 and 3).
Because of potential confounding factors that may “artificially” suppress or inflate significant association between particular hospital characteristics and hospital phenotype group, we conducted multivariable regression analysis to identify hospital characteristics that are independently associated with phenotype group membership. The resulting multinomial logistic regression analysis identified several attributes that were associated with a hospital's likelihood of having a specific phenotype, including length of stay, ICU admission rate, and procedure rates (Table3). A 1 percentage point increase in ICU admission rate was associated with a 6–9 percent increase in the likelihood of having phenotypes 1, 2, and 3, characteristic of higher RSC, relative to phenotype 5 (low cost and low mortality). A 1 percentage point increase in the rate of cardiovascular percutaneous or surgical procedures was associated with a 1.18- to 2.09-fold increase in a hospital's likelihood of having phenotypes with higher RSC or RSMR, relative to phenotype 5. Likewise, each additional day of hospital stay was associated with a 4.93- to 13.54-fold increase in a hospital's likelihood of having phenotypes 1, 2, 3, and 4.
Table 3.
Adjusted Association of Hospital Characteristics with the Phenotypes: Results from Multinomial Logistic Regression
|
Odds Ratio† (95% Confidence Interval) |
||||
|---|---|---|---|---|
| Hospital Characteristics | Phenotype 1 (vs. Phenotype 5) | Phenotype 2 (vs. Phenotype 5) | Phenotype 3 (vs. Phenotype 5) | Phenotype 4 (vs. Phenotype 5) |
| Proportion of heart failure hospitalizations during 2005–2011 with ICU admission | 1.09 (1.04–1.15) | 1.09 (1.06–1.13) | 1.06 (1.03–1.09) | 1.03 (0.98–1.08) |
| Proportion of heart failure hospitalizations during 2005–2011 involving a cardiovascular percutaneous or surgical procedure | 2.09 (1.77–2.46) | 1.89 (1.69–2.12) | 1.43 (1.31–1.55) | 1.18 (1.03–1.34) |
| Median length of hospital stay of heart failure hospitalizations during 2005–2011 | 7.74 (2.51–23.88) | 13.54 (6.15–29.83) | 5.35 (2.96–9.70) | 4.93 (2.18–11.14) |
ICU, intensive care unit.
Estimates reflect the odds ratio of a hospital having a given phenotype compared to phenotype 5 (low cost and low mortality). Model also adjusted for the Census region of each hospital's location.
Discussion
Our study demonstrated a reduction in RSC among hospitalizations for heart failure during 2005–2011 as well as decreasing RSMR over this period. More important, across a large sample of hospitals, we observed marked heterogeneity in the value of hospital care for patients with heart failure. We identified five distinct hospital phenotypes based on their combined cost and mortality longitudinal outcomes. In particular, hospitals in phenotype 5 consistently maintained low cost and low mortality over 7 years, exemplifying “positive deviance” in value of care. Potential savings in health care costs and patient lives can be substantial if all hospitals could achieve this level of performance.
To our knowledge, this is the first study describing longitudinal patterns in hospitals' combined financial and clinical outcomes. Combining cost and mortality outcomes enabled us to evaluate the value of hospital care, which neither cost nor mortality alone can achieve. It allowed us to identify clusters of hospitals that achieve similar mortality outcomes but different costs, or comparable costs but distinct mortality rates. Moreover, by studying hospital performance longitudinally, we were able to benchmark hospitals based on both the level and rate of change in the outcome of interest, and identify hospitals that demonstrate consistent patterns or important changes in performance. For instance, a decrease in RSC in phenotype 1 hospitals was accompanied by a gradually increasing RSMR. Although we are not able to make causal inferences within this study, the potential that an unintended health consequences of cost reduction has occurred warrants further investigation.
The linkages between various hospital attributes and the phenotypes reveal behavior traits that distinguish “positive deviant” hospitals from other hospitals. We found length of stay, ICU use, and procedure rates as key factors associated with a hospital's likelihood of having a particular cost-mortality phenotype. Nevertheless, these factors may be intermediate outcomes influenced by other hospital characteristics, rather than the root determinants for performance variations. Such characteristics may include hospital discharge policy, administrative/operational issues (e.g., difficulties in accessing rehabilitation facilities) (Hwabejire et al. 2013), and threshold for when to intervene with invasive procedures or admit patients to the ICU. Due to lack of data, existing studies rarely examined how hospitals differ in these operational practices. However, the limited evidence has suggested large variation in discharge criteria across hospitals in various patient populations (Weiss and Annamalai 2003; Fiore et al. 2012). Future research conducting in-depth assessment of practices at low cost and low mortality hospitals versus other hospitals may help discern how they achieved the exceptional performance (Krumholz, Curry, and Bradley 2011).
Prior studies have cautioned that hospitals were classified less favorably when in-hospital rather than 30-day mortality was used, and that it could favor hospitals with shorter length of stays (Rosenthal et al. 2000; Borzecki et al. 2010; Drye et al. 2012). Nonetheless, choice of the mortality measure rarely changed a hospital's classification from high outlier to low outlier, or vice versa (Rosenthal et al. 2000; Borzecki et al. 2010; Drye et al. 2012). Given the magnitude of the difference in RSMRs between high- and low-mortality phenotypes observed in our study, it is unlikely that hospitals in the high-mortality phenotype would shift to a low-mortality pattern if 30-day measures were used. Moreover, high-mortality hospitals had lengths of stay that were comparable to hospitals in one of the low-mortality phenotypes. We cannot attribute their divergent mortality rate to length of stay alone. Future research with a standardized observation period for both cost and mortality measures (e.g., 30 days or 1 year postadmission) would help validate our findings and provide complementary data on hospital phenotypes in longer term outcomes. It would also inform whether hospitals with higher costs achieve better long-term outcomes even though their short-term outcomes are similar to those at lower cost institutions.
The decreases in RSC and RSMR found in our study are consistent with recent evidence of nationwide declines in hospital length of stay and in-hospital mortality for patients with heart failure (Chen et al. 2013). This may indicate improved quality of care. In addition, because our analysis was based on risk-standardized measures, the decreasing trend may partially reflect the increased prevalence or coding of comorbidities in heart failure patients over time. For example, a higher proportion of patients were found to have renal failure or hypertension later in our study period. Similar trends have been reported in other studies of hospitalizations for heart failure with evidence supporting increased patient complexity rather than “upcoding” behaviors (Heidenreich et al. 2010; Chen et al. 2013).
This study has several limitations. First, our findings may not be generalizable to other hospitals in the United States, as the database only includes hospitals that voluntarily participated in the Premier network. However, hospitals in our sample exhibit a reasonable diversity of geographic location and characteristics. Key patient characteristics in our sample, including patient age, major comorbidities, length of stay, and in-hospital mortality rate, are also comparable to those based on heart failure hospitalizations in the National Inpatient Sample (Chen et al. 2013). Second, some studies suggested stratifying risk-adjustment models for survivors and nonsurvivors when estimating costs (Timbie and Normand 2008). We used a single model due to small sample size for nonsurvivors. Our sensitivity analysis showed no change in hospital phenotype membership when estimating costs with and without adjustment for patients' mortality status. Third, our risk-adjustment models relied on patient case mix information from administrative data. This may limit our ability to fully capture differences in patient severity among hospitals. It is possible that patients at hospitals with longer length of stay or higher rate of ICU admission or cardiovascular surgical or percutaneous procedures might have more severe heart failure that were not measurable with our data. However, our earlier work of profiling hospital performance for CMS demonstrated that administrative data can provide estimates that are similar to those of models employing much richer clinical data (Krumholz et al. 2006; Keenan et al. 2008). In addition, comparison of cost-mortality trajectories in urban teaching hospitals and results from our sensitivity analysis based on nonprocedural admissions corroborate our main findings. Finally, we focused on in-hospital mortality as our measure of patient outcome. Characterization of hospital value of care may be affected by the specific outcome measures used. Other outcome measures such as functional status and symptoms are important for heart failure patients as well. Future studies incorporating these measures will provide a more comprehensive view of hospital value of care by allowing for a perspective on patients' quality of life instead of just survivorship.
Further research is needed to fully delineate hospital characteristics that are associated with the different phenotypes. This approach will help discern how some hospitals succeeded in maintaining low costs while delivering excellent outcomes of care, and offer opportunities for broader application of their successful experience to promote high value care.
Acknowledgments
Joint Acknowledgment/Disclosure Statements: This work was supported by grant DF10-301 from the Patrick and Catherine Weldon Donaghue Medical Research Foundation in West Hartford, Connecticut, and by grant UL1 RR024139-06S1 from the National Center for Advancing Translational Sciences in Bethesda, Maryland. Drs. Xu and Krumholz are supported by grant U01 HL105270-04 (Center for Cardiovascular Outcomes Research at Yale University). The funders had no role in the design and conduct of the study; collection, management, analysis, and interpretation of the data; and preparation, review, or approval of the manuscript. Dr. Krumholz reports that he is the recipient of a research grant from Medtronic, Inc. through Yale University, to develop methods of clinical trial data sharing and is chair of a cardiac scientific advisory board for UnitedHealth.
Disclosures: None.
Disclaimers: None.
Supporting Information
Additional supporting information may be found in the online version of this article:
Author Matrix.
List of Cardiovascular Percutaneous and Surgical Procedures (Ordered by Frequency).
Appendix SA3: Risk-Adjustment Models for In-Hospital Costs and In-Hospital Mortality Rate.
Appendix SA4: Parameter Estimates for the Joint Trajectories of Risk-Standardized Cost (RSC) and Risk-Standardized Mortality Rate (RSMR).
Appendix SA5: Average Risk-Standardized Cost (RSC) and Risk-Standardized Mortality Rate (RSMR) among Urban Teaching Hospitals Compared to Overall Sample, by Phenotype.
Appendix SA6: Distinct Hospital Phenotypes Based on the Cost-Mortality Pattern of NonProcedural Hospitalizations.
Appendix SA7: Association of Hospital Characteristics with the Phenotypes, Unadjusted.
References
- Adams JL, Mehrotra A, Thomas JW. McGlynn EA. Physician Cost Profiling–Reliability and Risk of Misclassification. New England Journal of Medicine. 2010;362(11):1014–21. doi: 10.1056/NEJMsa0906323. and. “. ”. [DOI] [PMC free article] [PubMed] [Google Scholar]
- Borzecki AM, Christiansen CL, Chew P, Loveland S. Rosen AK. Comparison of In-Hospital versus 30-day Mortality Assessments for Selected Medical Conditions. Medical Care. 2010;48(12):1117–21. doi: 10.1097/MLR.0b013e3181ef9d53. and. “. ”. [DOI] [PubMed] [Google Scholar]
- Centers for Medicare and Medicaid Services. 2012. “ Market Basket Data: Actual Regulation Market Basket Change and Medicare Payment Updates as Published in the “Federal Register.” Current History and Forecasts of the Market Baskets ” [accessed on December 28, 2012]. Available at http://www.cms.gov/Research-Statistics-Data-and-Systems/Statistics-Trends-and-Reports/MedicareProgramRatesStats/MarketBasketData.html.
- Chen LM, Jha AK, Guterman S, Ridgway AB, Orav EJ. Epstein AM. Hospital Cost of Care, Quality of Care, and Readmission Rates: Penny Wise and Pound Foolish? Archives of Internal Medicine. 2010;170(4):340–6. doi: 10.1001/archinternmed.2009.511. and. “ ”. [DOI] [PubMed] [Google Scholar]
- Chen SI, Dharmarajan K, Kim N, Strait KM, Li SX, Safavi KC, Lindenauer PK, Krumholz HM. Lagu T. Procedure Intensity and the Cost of Care. Circulation: Cardiovascular Quality and Outcomes. 2012;5(3):308–13. doi: 10.1161/CIRCOUTCOMES.112.966069. and. “. ”. [DOI] [PMC free article] [PubMed] [Google Scholar]
- Chen J, Dharmarajan K, Wang Y. Krumholz HM. National Trends in Heart Failure Hospital Stay Rates, 2001 to 2009. Journal of the American College of Cardiology. 2013;61(10):1078–88. doi: 10.1016/j.jacc.2012.11.057. and. “. ”. [DOI] [PMC free article] [PubMed] [Google Scholar]
- Dixon WJ. Yuen KK. Trimming and Winsorization: A Review. Statistical Papers. 1974;15(2–3):157–70. and. “. ”. [Google Scholar]
- Drye EE, Normand SL, Wang Y, Ross JS, Schreiner GC, Han L, Rapp M. Krumholz HM. Comparison of Hospital Risk-Standardized Mortality Rates Calculated by Using In-Hospital and 30-day Models: An Observational Study with Implications for Hospital Profiling. Annals of Internal Medicine. 2012;156(1 Pt 1):19–26. doi: 10.1059/0003-4819-156-1-201201030-00004. and. “. ”. [DOI] [PMC free article] [PubMed] [Google Scholar]
- Elixhauser A, Steiner C, Harris DR. Coffey RM. Comorbidity Measures for Use with Administrative Data. Medical Care. 1998;36(1):8–27. doi: 10.1097/00005650-199801000-00004. and. “. ”. [DOI] [PubMed] [Google Scholar]
- Fiore JF, Jr, Browning L, Bialocerkowski A, Gruen RL, Faragher IG. Denehy L. Hospital Discharge Criteria Following Colorectal Surgery: A Systematic Review. Colorectal Disease. 2012;14(3):270–81. doi: 10.1111/j.1463-1318.2010.02477.x. and. “. ”. [DOI] [PubMed] [Google Scholar]
- Heidenreich PA, Sahay A, Kapoor JR, Pham MX. Massie B. Divergent Trends in Survival and Readmission Following a Hospitalization for Heart Failure in the Veterans Affairs Health Care System 2002 to 2006. Journal of the American College of Cardiology. 2010;56(5):362–8. doi: 10.1016/j.jacc.2010.02.053. and. “. ”. [DOI] [PubMed] [Google Scholar]
- Hwabejire JO, Kaafarani HMA, Imam AM, Solis CV, Verge J, Sullivan NM, DeMoya MA, Alam HB. Velmahos GC. Excessively Long Hospital Stays after Trauma Are Not Related to the Severity of Illness: Let's Aim to the Right Target. Journal of the American Medical Association Surgery. 2013;148(10):956–61. doi: 10.1001/jamasurg.2013.2148. and. “. ”. [DOI] [PubMed] [Google Scholar]
- Jha AK, Orav EJ, Dobson A, Book RA. Epstein AM. Measuring Efficiency: The Association of Hospital Costs and Quality of Care. Health Affairs. 2009;28(3):897–906. doi: 10.1377/hlthaff.28.3.897. and. “. ”. [DOI] [PubMed] [Google Scholar]
- Jones BL. Nagin DS. Advances in Group-Based Trajectory Modeling and an SAS Procedure for Estimating Them. Sociological Methods Research. 2007;35(4):542–71. and. “. ”. [Google Scholar]
- Keenan PS, Normand SL, Lin Z, Drye EE, Bhat KR, Ross JS, Schuur JD, Stauffer BD, Bernheim SM, Epstein AJ, Wang Y, Herrin J, Chen J, Federer JJ, Mattera JA. Krumholz HM. An Administrative Claims Measure Suitable for Profiling Hospital Performance on the Basis of 30-day All-Cause Readmission Rates among Patients with Heart Failure. Circulation: Cardiovascular Quality and Outcomes. 2008;1(1):29–37. doi: 10.1161/CIRCOUTCOMES.108.802686. and. “. ”. [DOI] [PubMed] [Google Scholar]
- Krumholz HM, Curry LA. Bradley EH. Survival after Acute Myocardial Infarction (SAMI) Study: The Design and Implementation of a Positive Deviance Study. American Heart Journal. 2011;162(6):981–7. doi: 10.1016/j.ahj.2011.09.004. and. “. ” e9. [DOI] [PMC free article] [PubMed] [Google Scholar]
- Krumholz HM, Wang Y, Mattera JA, Han LF, Ingber MJ, Roman S. Normand SL. An Administrative Claims Model Suitable for Profiling Hospital Performance Based on 30-day Mortality Rates among Patients with Heart Failure. Circulation. 2006;113(13):1693–701. doi: 10.1161/CIRCULATIONAHA.105.611194. and. “. ”. [DOI] [PubMed] [Google Scholar]
- Lagu T, Krumholz HM, Dharmarajan K, Partovian C, Kim N, Mody PS, Li SX, Strait KM. Lindenauer PK. Spending More, Doing More, or Both? An Alternative Method for Quantifying Utilization during Hospitalizations. Journal of Hospital Medicine. 2013;8(7):373–9. doi: 10.1002/jhm.2046. and. “. ”. [DOI] [PMC free article] [PubMed] [Google Scholar]
- Manning WG. Mullahy J. Estimating Log Models: To Transform or Not to Transform? Journal of Health Economics. 2001;20(4):461–94. doi: 10.1016/s0167-6296(01)00086-8. and. “ ”. [DOI] [PubMed] [Google Scholar]
- Martin AB, Lassman D, Washington B. Catlin A. Growth in US Health Spending Remained Slow in 2010; Health Share of Gross Domestic Product Was Unchanged from 2009. Health Affairs. 2012;31(1):208–19. doi: 10.1377/hlthaff.2011.1135. and. “. ”. [DOI] [PubMed] [Google Scholar]
- Miller DC, Gust C, Dimick JB, Birkmeyer N, Skinner J. Birkmeyer JD. Large Variations in Medicare Payments for Surgery Highlight Savings Potential from Bundled Payment Programs. Health Affairs. 2011;30(11):2107–15. doi: 10.1377/hlthaff.2011.0783. and. “. ”. [DOI] [PMC free article] [PubMed] [Google Scholar]
- Nagin DS. Group-Based Modeling of Development. Cambridge, MA: Harvard University Press; 2005. [Google Scholar]
- Osborne JW. Improving Your Data Transformations: Applying the Box-Cox Transformation. Practical Assessment, Research & Evaluation. 2010;15(12):1–9. “. ”. [Google Scholar]
- Pasquali SK, Sun JL, d'Almada P, Jaquiss RD, Lodge AJ, Miller N, Kemper AR, Lannon CM. Li JS. Center Variation in Hospital Costs for Patients Undergoing Congenital Heart Surgery. Circulation: Cardiovascular Quality and Outcomes. 2011;4(3):306–12. doi: 10.1161/CIRCOUTCOMES.110.958959. and. “. ”. [DOI] [PMC free article] [PubMed] [Google Scholar]
- Pfuntner A, Wier LM. Steiner C. Costs for Hospital Stays in the United States, 2010. Rockville, MD: Agency for Healthcare Research and Quality; 2013. and. Healthcare Cost and Utilization Project. . HCUP Statistical Brief #146 [accessed on October 4, 2013]. Available at http://www.hcup-us.ahrq.gov/reports/statbriefs/sb146.pdf. [PubMed] [Google Scholar]
- Robinson JC. Variation in Hospital Costs, Payments, and Profitabilty for Cardiac Valve Replacement Surgery. Health Services Research. 2011;46(6 Pt 1):1928–45. doi: 10.1111/j.1475-6773.2011.01288.x. “. ”. [DOI] [PMC free article] [PubMed] [Google Scholar]
- Rosenthal GE, Baker DW, Norris DG, Way LE, Harper DL. Snow RJ. Relationships between In-Hospital and 30-day Standardized Hospital Mortality: Implications for Profiling Hospitals. Health Services Research. 2000;34(7):1449–68. and. “. ”. [PMC free article] [PubMed] [Google Scholar]
- Safavi KC, Dharmarajan K, Kim N, Strait KM, Li SX, Chen SI, Lagu T. Krumholz HM. Variation Exists in Rates of Admission to Intensive Care Units for Heart Failure Patients across Hospitals in the United States. Circulation. 2013;127(8):923–9. doi: 10.1161/CIRCULATIONAHA.112.001088. and. “. ”. [DOI] [PMC free article] [PubMed] [Google Scholar]
- Thomas S. Rich MW. Epidemiology, Pathophysiology, and Prognosis of Heart Failure in the Elderly. Heart Failure Clinics. 2007;3(4):381–7. doi: 10.1016/j.hfc.2007.07.004. and. “. ”. [DOI] [PMC free article] [PubMed] [Google Scholar]
- Timbie JW. Normand SL. A Comparison of Methods for Combining Quality and Efficiency Performance Measures: Profiling the Value of Hospital Care Following Acute Myocardial Infarction. Statistics in Medicine. 2008;27(9):1351–70. doi: 10.1002/sim.3082. and. “. ”. [DOI] [PubMed] [Google Scholar]
- Weiss J. Annamalai VR. Discharge Criteria for Bronchiolitis Patients. Pediatrics. 2003;111(2):445. doi: 10.1542/peds.111.2.445. and. “. ”. [DOI] [PubMed] [Google Scholar]
- Wier LM, Pfuntner A, Maeda J, Stranges E, Ryan K, Jagadish P, Collins Sharp B. Elixhauser A. HCUP Facts and Figures: Statistics on Hospital-based Care in the United States, 2009. Rockville, MD: Agency for Healthcare Research and Quality; 2011. and [accessed October 4, 2013]. Available at http://www.hcup-us.ahrq.gov/reports/factsandfigures/2009/TOC_2009.jsp. [PubMed] [Google Scholar]
Associated Data
This section collects any data citations, data availability statements, or supplementary materials included in this article.
Supplementary Materials
Author Matrix.
List of Cardiovascular Percutaneous and Surgical Procedures (Ordered by Frequency).
Appendix SA3: Risk-Adjustment Models for In-Hospital Costs and In-Hospital Mortality Rate.
Appendix SA4: Parameter Estimates for the Joint Trajectories of Risk-Standardized Cost (RSC) and Risk-Standardized Mortality Rate (RSMR).
Appendix SA5: Average Risk-Standardized Cost (RSC) and Risk-Standardized Mortality Rate (RSMR) among Urban Teaching Hospitals Compared to Overall Sample, by Phenotype.
Appendix SA6: Distinct Hospital Phenotypes Based on the Cost-Mortality Pattern of NonProcedural Hospitalizations.
Appendix SA7: Association of Hospital Characteristics with the Phenotypes, Unadjusted.