

The Japanese Association for Thoracic Surgery has conducted annual surveys of thoracic surgery throughout Japan since 1987 to determine the statistics regarding the number of procedures according to operative category. Here, we have summarized the results from our annual survey of thoracic surgery performed during 2012.
Table 1 Questionnaires sent out and received back by the end of December 2013
| Sent out | Returned | Response rate (%) | |
|---|---|---|---|
| (A) Cardiovascular surgery | 601 | 583 | 97.0 |
| (B) General thoracic surgery | 802 | 777 | 96.9 |
| (C) Esophageal surgery | 582 | 555 | 95.4 |
Table 2 Categories subclassified according to the number of operations performed
| Number of operations performed | Category | |
|---|---|---|
| Cardiovascular surgery | General thoracic surgery | |
| 0 | 39 | 41 |
| 1–24 | 46 | 92 |
| 25–49 | 99 | 92 |
| 50–99 | 163 | 193 |
| 100–149 | 86 | 134 |
| 150–199 | 60 | 107 |
| ≧200 | 90 | 118 |
| Total | 583 | 777 |
| Number of operations performed | Esophageal surgery |
|---|---|
| 0 | 86 |
| 1–4 | 99 |
| 5–9 | 81 |
| 10–19 | 105 |
| 20–29 | 48 |
| 30–39 | 35 |
| 40–49 | 30 |
| ≧50 | 71 |
| Total | 555 |
Fig. 1.

Cardiovascular surgery, IHD ischemic heart disease
The incidence of hospital mortality was added to the survey to determine the nationwide status, which has contributed to the Japanese surgeons to understand the present status of thoracic surgery in Japan and to make progress to improve operative results by comparing their work with those of others. The Association was able to gain a better understanding of the present problems as well as future prospects, which has been reflected to its activity including education of its members. Thirty-day mortality (so-called “operative mortality) is defined as death within 30 days of operation regardless of the patient’s geographic location and even though the patient had been discharged from the hospital.
Hospital mortality is defined as death within any time interval after an operation if the patient had not been discharged from the hospital. Hospital-to-hospital transfer is not considered discharge: transfer to a nursing home or a rehabilitation unit is considered hospital discharge unless the patient subsequently dies of complications of the operation. The definitions of the Ad Hoc Liaison Committee for Standardizing Definitions of Prosthetic Heart Valve Morbidity of the Society of Thoracic Surgeons and the American Association for Thoracic Surgery (Edmunds et al. Ann Thorac Surg 1996;62:932–5; J Thorac Cardiovasc Surg 1996;112:708–11).
Thoracic surgery was classified into three categories—cardiovascular, general thoracic, and esophageal surgery—and the patient data were examined and analyzed for each group. Access to the computerized data is offered to all members of this Association. We honor and value all member’s continued kind support and contributions (Tables 1, 2).
Table 1 Congenital (total; 9,558)
(1) CPB (+) (total; 7,171)
| Neonate | Infant | 1–17 years | ≧18 years | Total | |||||||||||||||||
|---|---|---|---|---|---|---|---|---|---|---|---|---|---|---|---|---|---|---|---|---|---|
| Cases | 30-day mortality | Hospital mortality | Cases | 30-day mortality | Hospital mortality | Cases | 30-day mortality | Hospital mortality | Cases | 30-day mortality | Hospital mortality | Cases | 30-day mortality | Hospital mortality | |||||||
| Hospital | After discharge | Hospital | After discharge | Hospital | After discharge | Hospital | After discharge | Hospital | After discharge | ||||||||||||
| 1 | PDA | 15 | 0 | 0 | 0 | 2 | 0 | 0 | 0 | 4 | 0 | 0 | 0 | 24 | 1 (4.2) | 0 | 1 (4.2) | 45 | 1 (2.2) | 0 | 1 (2.2) |
| 2 | Coarctation (simple) | 7 | 0 | 0 | 0 | 13 | 0 | 0 | 0 | 17 | 0 | 0 | 0 | 7 | 0 | 0 | 0 | 44 | 0 | 0 | 0 |
| 3 | +VSD | 32 | 2 (6.3) | 0 | 2 (6.3) | 34 | 0 | 0 | 0 | 8 | 0 | 0 | 0 | 2 | 0 | 0 | 0 | 76 | 2 (2.6) | 0 | 2 (2.6) |
| 4 | +DORV | 2 | 0 | 0 | 1 (50.0) | 3 | 0 | 0 | 0 | 2 | 0 | 0 | 0 | 0 | 0 | 0 | 0 | 7 | 0 | 0 | 1 (14.3) |
| 5 | +AVSD | 5 | 0 | 0 | 0 | 4 | 0 | 0 | 0 | 1 | 0 | 0 | 0 | 0 | 0 | 0 | 0 | 10 | 0 | 0 | 0 |
| 6 | +TGA | 3 | 1 (33.3) | 0 | 1 (33.3) | 3 | 0 | 0 | 0 | 1 | 0 | 0 | 0 | 0 | 0 | 0 | 0 | 7 | 1 (14.3) | 0 | 1 (14.3) |
| 7 | +SV | 9 | 2 (22.2) | 0 | 2 (22.2) | 7 | 0 | 0 | 0 | 4 | 0 | 0 | 0 | 0 | 0 | 0 | 0 | 20 | 2 (10.0) | 0 | 2 (10.0) |
| 8 | +Others | 2 | 0 | 0 | 0 | 5 | 0 | 0 | 0 | 4 | 0 | 0 | 0 | 1 | 0 | 0 | 0 | 12 | 0 | 0 | 0 |
| 9 | Interrupt. of Ao (simple) | 1 | 0 | 0 | 0 | 2 | 1 (50.0) | 0 | 1 (50.0) | 2 | 0 | 0 | 0 | 1 | 0 | 0 | 0 | 6 | 1 (16.7) | 0 | 1 (16.7) |
| 10 | +VSD | 25 | 2 (8.0) | 0 | 2 (8.0) | 16 | 0 | 0 | 0 | 4 | 0 | 0 | 0 | 10 | 0 | 0 | 0 | 55 | 2 (3.6) | 0 | 2 (3.6) |
| 11 | +DORV | 3 | 1 (33) | 0 | 1 (33.3) | 4 | 0 | 0 | 0 | 2 | 0 | 0 | 0 | 0 | 0 | 0 | 0 | 9 | 1 (11.1) | 0 | 1 (11.1) |
| 12 | +Truncus | 2 | 1 (50.0) | 0 | 1 (50.0) | 2 | 0 | 0 | 0 | 0 | 0 | 0 | 0 | 0 | 0 | 0 | 0 | 4 | 1 (25.0) | 0 | 1 (25.0) |
| 13 | +TGA | 2 | 0 | 0 | 0 | 1 | 0 | 0 | 0 | 0 | 0 | 0 | 0 | 0 | 0 | 0 | 0 | 3 | 0 | 0 | 0 |
| 14 | +Others | 4 | 0 | 0 | 0 | 10 | 1 (10.0) | 0 | 1 (10.0) | 2 | 0 | 0 | 0 | 1 | 0 | 0 | 0 | 17 | 1 (5.9) | 0 | 1 (5.9) |
| 15 | Vascular ring | 0 | 0 | 0 | 0 | 4 | 0 | 0 | 0 | 3 | 0 | 0 | 0 | 0 | 0 | 0 | 0 | 7 | 0 | 0 | 0 |
| 16 | PS | 1 | 0 | 0 | 0 | 15 | 0 | 0 | 0 | 14 | 0 | 0 | 0 | 4 | 0 | 0 | 1 (25.0) | 34 | 0 | 0 | 1 (2.9) |
| 17 | PAIVS or critical PS | 12 | 0 | 0 | 0 | 50 | 1 (2.0) | 0 | 1 (2.0) | 55 | 0 | 0 | 0 | 2 | 0 | 0 | 1 (50.0) | 119 | 1 (0.8) | 0 | 2 (1.7) |
| 18 | TAPVR | 126 | 9 (7.1) | 0 | 15 (11.9) | 49 | 1 (2) | 2 (4.08) | 2 (4.1) | 8 | 0 | 0 | 0 | 0 | 0 | 0 | 0 | 183 | 10 (5) | 2 (1.1) | 17 (9) |
| 19 | PAPVR ± ASD | 0 | 0 | 0 | 0 | 4 | 0 | 0 | 0 | 52 | 0 | 0 | 0 | 29 | 0 | 0 | 0 | 85 | 0 | 0 | 0 |
| 20 | ASD | 11 | 1 (9.1) | 0 | 1 (9.1) | 54 | 0 | 0 | 0 | 693 | 0 | 0 | 0 | 573 | 2 (0.3) | 1 (0.2) | 2 (0.3) | 1,331 | 3 (0.2) | 1 (0.08) | 3 (0.2) |
| 21 | Cor triatriatum | 1 | 0 | 0 | 0 | 13 | 2 (15.4) | 0 | 2 (15.4) | 3 | 0 | 0 | 0 | 4 | 0 | 0 | 0 | 21 | 2 (9.5) | 0 | 2 (9.5) |
| 22 | AVSD (partial) | 1 | 1 (100.0) | 0 | 1 (100.0) | 19 | 1 (5.3) | 0 | 1 (5.3) | 40 | 0 | 0 | 0 | 13 | 0 | 0 | 0 | 73 | 2 (2.7) | 0 | 2 (2.7) |
| 23 | AVSD (complete) | 4 | 0 | 0 | 1 (25.0) | 108 | 5 (4.6) | 0 | 5 (4.6) | 69 | 0 | 0 | 0 | 4 | 0 | 0 | 0 | 185 | 5 (2.7) | 0 | 6 (3.2) |
| 24 | +TOF or DORV | 0 | 0 | 0 | 0 | 6 | 1 (16.7) | 0 | 2 (33.3) | 21 | 0 | 0 | 0 | 3 | 0 | 0 | 0 | 30 | 1 (3.3) | 0 | 2 (6.7) |
| 25 | +Others | 1 | 0 | 0 | 0 | 10 | 1 (10.0) | 0 | 1 (10.0) | 8 | 0 | 0 | 0 | 1 | 0 | 0 | 0 | 20 | 1 (5.0) | 0 | 1 (5.0) |
| 26 | VSD (subarterial) | 3 | 0 | 0 | 0 | 128 | 0 | 0 | 0 | 197 | 0 | 0 | 0 | 29 | 0 | 0 | 0 | 357 | 0 | 0 | 0 |
| 27 | VSD (perimemb./muscular) | 10 | 0 | 0 | 0 | 770 | 0 | 1 (0.13) | 0 | 390 | 0 | 0 | 0 | 90 | 0 | 0 | 0 | 1,260 | 0 | 1 (0.1) | 0 |
| 28 | VSD + PS | 0 | 0 | 0 | 0 | 39 | 0 | 0 | 0 | 33 | 0 | 0 | 0 | 7 | 0 | 0 | 0 | 79 | 0 | 0 | 0 |
| 29 | DCRV ± VSD | 2 | 0 | 0 | 0 | 16 | 0 | 0 | 0 | 39 | 0 | 0 | 0 | 19 | 0 | 0 | 0 | 76 | 0 | 0 | 0 |
| 30 | Aneurysm of sinus valsalva | 0 | 0 | 0 | 0 | 6 | 0 | 0 | 0 | 1 | 0 | 0 | 0 | 24 | 0 | 0 | 0 | 31 | 0 | 0 | 0 |
| 31 | TOF | 15 | 1 (6.7) | 0 | 1 (6.7) | 168 | 0 | 0 | 0 | 231 | 2 (0.9) | 0 | 2 (0.9) | 22 | 0 | 0 | 2 (9.1) | 436 | 3 (0.7) | 0 | 5 (1.1) |
| 32 | PA + VSD | 4 | 0 | 0 | 0 | 78 | 1 (1.3) | 0 | 1 (1.3) | 125 | 3 (2.4) | 0 | 5 (4.0) | 9 | 0 | 0 | 0 | 216 | 4 (1.9) | 0 | 6 (2.8) |
| 33 | DORV | 17 | 1 (5.9) | 0 | 1 (5.9) | 91 | 1 (1.1) | 0 | 3 (3.3) | 112 | 2 (1.8) | 0 | 2 (1.8) | 3 | 1 (33.3) | 0 | 1 (33.3) | 223 | 5 (2.2) | 0 | 7 (3.1) |
| 34 | TGA (simple) | 101 | 2 (2.0) | 0 | 3 (3.0) | 12 | 0 | 0 | 0 | 0 | 0 | 0 | 0 | 4 | 0 | 0 | 0 | 117 | 2 (1.7) | 0 | 3 (2.6) |
| 35 | +VSD | 44 | 1 (2.3) | 0 | 1 (2.3) | 17 | 1 (5.9) | 0 | 1 (5.9) | 2 | 0 | 0 | 0 | 0 | 0 | 0 | 0 | 63 | 2 (3.2) | 0 | 2 (3.2) |
| 36 | VSD + PS | 4 | 0 | 0 | 0 | 8 | 0 | 0 | 0 | 26 | 0 | 0 | 0 | 2 | 0 | 0 | 0 | 40 | 0 | 0 | 0 |
| 37 | Corrected TGA | 2 | 0 | 0 | 0 | 11 | 0 | 0 | 0 | 42 | 1 (2.4) | 0 | 1 (2.4) | 13 | 0 | 0 | 0 | 68 | 1 (1.5) | 0 | 1 (1.5) |
| 38 | Truncus arteriosus | 4 | 0 | 0 | 0 | 26 | 2 (7.7) | 0 | 3 (11.5) | 12 | 0 | 0 | 0 | 1 | 0 | 0 | 0 | 43 | 2 (4.7) | 0 | 3 (7.0) |
| 39 | SV | 27 | 5 (18.5) | 0 | 8 (29.6) | 219 | 7 (3.2) | 0 | 11 (5.0) | 282 | 4 (1.4) | 0 | 9 (3.2) | 21 | 2 (9.5) | 0 | 2 (9.5) | 549 | 18 (3.3) | 0 | 30 (5.5) |
| 40 | TA | 2 | 0 | 0 | 0 | 30 | 0 | 0 | 0 | 53 | 0 | 0 | 0 | 5 | 0 | 0 | 0 | 90 | 0 | 0 | 0 |
| 41 | HLHS | 45 | 10 (22.2) | 0 | 10 (22.2) | 130 | 11 (8.5) | 1 (0.77) | 15 (11.5) | 71 | 0 | 0 | 0 | 0 | 0 | 0 | 0 | 246 | 21 (8.5) | 1 (11.7) | 25 (10.2) |
| 42 | Aortic valve lesion | 7 | 3 (42.9) | 0 | 3 (42.9) | 16 | 0 | 0 | 0 | 75 | 3 (4.0) | 0 | 3 (4.0) | 19 | 1 (5.3) | 0 | 1 (5.3) | 117 | 7 (6.0) | 0 | 7 (6.0) |
| 43 | Mitral valve lesion | 2 | 1 (50.0) | 0 | 1 (50.0) | 56 | 0 | 0 | 2 (3.6) | 75 | 1 (1.3) | 0 | 1 (1.3) | 14 | 0 | 0 | 0 | 147 | 2 (1.4) | 0 | 4 (2.7) |
| 44 | Ebstein | 10 | 1 (10.0) | 0 | 1 (10.0) | 17 | 1 (5.9) | 0 | 1 (5.9) | 31 | 0 | 0 | 0 | 12 | 0 | 0 | 0 | 70 | 2 (2.9) | 0 | 2 (2.9) |
| 45 | Coronary disease | 0 | 0 | 0 | 0 | 11 | 0 | 0 | 0 | 16 | 0 | 0 | 0 | 13 | 0 | 0 | 0 | 40 | 0 | 0 | 0 |
| 46 | Others | 11 | 0 | 0 | 1 (9.1) | 27 | 3 (11.1) | 0 | 3 (11.1) | 34 | 2 (5.9) | 0 | 2 (5.9) | 14 | 0 | 0 | 0 | 86 | 5 (5.8) | 0 | 6 (7.0) |
| 47 | Redo VSD | 0 | 0 | 0 | 0 | 6 | 0 | 0 | 0 | 10 | 0 | 0 | 0 | 7 | 0 | 0 | 0 | 23 | 0 | 0 | 0 |
| 48 | PS release | 0 | 0 | 0 | 0 | 8 | 0 | 0 | 0 | 42 | 0 | 0 | 0 | 23 | 0 | 0 | 0 | 73 | 0 | 0 | 0 |
| 49 | RV-PA conduit replace | 0 | 0 | 0 | 0 | 3 | 0 | 0 | 0 | 68 | 1 (1.5) | 0 | 1(1.5) | 17 | 0 | 0 | 1 (5.9) | 88 | 1 (1.1) | 0 | 2 (2.3) |
| 50 | Others | 1 | 0 | 0 | 0 | 62 | 6 (9.7) | 0 | 7 (11.3) | 121 | 2 (1.7) | 0 | 4 (3.3) | 46 | 1 (2.2) | 0 | 1 (2.2) | 230 | 9 (3.9) | 0 | 12 (5.2) |
| Total | 580 | 45 (7.8) | 0 | 58 (10.0) | 2,393 | 47 (2.0) | 4 (0.17) | 63 (2.6) | 3,105 | 21 (0.7) | 0 | 30 (1.0) | 1,093 | 8 (0.7) | 1 (0.1) | 13 (1.2) | 7,171 | 121 (1.7) | 5 (0.1) | 164 (2.3) | |
Values in parenthesis represent mortality %
CPB cardiopulmonary bypass, PDA patient ductus arteriosus, VSD ventricular septal defect, DORV double outlet right ventricle, AVSD atrioventricular septal defect, TGA transposition of great arteries, SV single ventricle, Interupt. of Ao., interrupted aortic arch, PS pulmonary stenosis, PA-IVS pulmonary atresia with intact ventricular septum, TAPVR total anomalous pulmonary venous return, PAPVR partial anomalous pulmonary venous return, ASD atrial septal defect, TOF tetralogy of Fallot, DCRV double-chambered right ventricle, TA tricuspid atresia, HLHS hypoplastic left heart syndrome, RV-PA right ventricle–pulmonary artery
(2) CPB (−) (total; 2,387)
| Neonate | Infant | 1–17 years | ≧18 years | Total | |||||||||||||||||
|---|---|---|---|---|---|---|---|---|---|---|---|---|---|---|---|---|---|---|---|---|---|
| Cases | 30-day mortality | Hospital mortality | Cases | 30-day mortality | Hospital mortality | Cases | 30-day mortality | Hospital mortality | Cases | 30-day mortality | Hospital mortality | Cases | 30-day mortality | Hospital mortality | |||||||
| Hospital | After discharge | Hospital | After discharge | Hospital | After discharge | Hospital | After discharge | Hospital | After discharge | ||||||||||||
| 1 | PDA | 358 | 2 (0.6) | 0 | 3 (0.8) | 225 | 0 | 0 | 2 (0.9) | 46 | 0 | 0 | 0 | 1 | 0 | 0 | 0 | 630 | 2 (0.3) | 0 | 5 (0.8) |
| 2 | Coarctation (simple) | 21 | 0 | 0 | 0 | 14 | 0 | 0 | 0 | 4 | 0 | 0 | 0 | 1 | 0 | 0 | 0 | 40 | 0 | 0 | 0 |
| 3 | +VSD | 38 | 1 (2.6) | 1 (2.6) | 1 (2.6) | 26 | 1 (3.8) | 0 | 1 (3.8) | 0 | 0 | 0 | 0 | 0 | 0 | 0 | 0 | 64 | 2 (3.1) | 1 (1.6) | 2 (3.1) |
| 4 | +DORV | 5 | 0 | 0 | 1 (20.0) | 2 | 0 | 0 | 0 | 0 | 0 | 0 | 0 | 0 | 0 | 0 | 0 | 7 | 0 | 0 | 1 (14.3) |
| 5 | +AVSD | 5 | 1 (20.0) | 0 | 1 (20.0) | 0 | 0 | 0 | 0 | 0 | 0 | 0 | 0 | 0 | 0 | 0 | 0 | 5 | 1 (20.0) | 0 | 1 |
| 6 | +TGA | 7 | 0 | 0 | 0 | 0 | 0 | 0 | 0 | 0 | 0 | 0 | 0 | 0 | 0 | 0 | 0 | 7 | 0 | 0 | 0 |
| 7 | +SV | 5 | 0 | 0 | 0 | 2 | 0 | 0 | 0 | 0 | 0 | 0 | 0 | 0 | 0 | 0 | 0 | 7 | 0 | 0 | 0 |
| 8 | +Others | 4 | 0 | 0 | 0 | 2 | 0 | 0 | 0 | 0 | 0 | 0 | 0 | 0 | 0 | 0 | 0 | 6 | 0 | 0 | 0 |
| 9 | Interrupt. of Ao (simple) | 1 | 0 | 0 | 0 | 0 | 0 | 0 | 0 | 0 | 0 | 0 | 0 | 0 | 0 | 0 | 0 | 1 | 0 | 0 | 0 |
| 10 | +VSD | 21 | 0 | 0 | 1 (4.8) | 5 | 0 | 0 | 0 | 2 | 0 | 0 | 0 | 0 | 0 | 0 | 0 | 28 | 0 | 0 | 1 (3.6) |
| 11 | +DORV | 4 | 1 (25) | 0 | 2 (50) | 0 | 0 | 0 | 0 | 0 | 0 | 0 | 0 | 0 | 0 | 0 | 0 | 4 | 1 (25) | 0 | 2 (50) |
| 12 | +Truncus | 3 | 0 | 0 | 0 | 0 | 0 | 0 | 0 | 0 | 0 | 0 | 0 | 0 | 0 | 0 | 0 | 3 | 0 | 0 | 0 |
| 13 | +TGA | 2 | 0 | 0 | 0 | 1 | 0 | 0 | 0 | 0 | 0 | 0 | 0 | 0 | 0 | 0 | 0 | 3 | 0 | 0 | 0 |
| 14 | +Others | 7 | 0 | 0 | 1 (14.3) | 0 | 0 | 0 | 0 | 0 | 0 | 0 | 0 | 0 | 0 | 0 | 0 | 7 | 0 | 0 | 1 (14.3) |
| 15 | Vascular ring | 1 | 0 | 0 | 0 | 12 | 1 (8.3) | 0 | 1 (8.3) | 9 | 0 | 0 | 0 | 0 | 0 | 0 | 0 | 22 | 1 (4.5) | 0 | 1 (4.5) |
| 16 | PS | 0 | 0 | 0 | 0 | 1 | 0 | 0 | 0 | 0 | 0 | 0 | 0 | 0 | 0 | 0 | 0 | 1 | 0 | 0 | 0 |
| 17 | PAIVS or critical PS | 30 | 3 (10.0) | 0 | 3 (10.0) | 26 | 0 | 0 | 0 | 3 | 0 | 0 | 0 | 2 | 0 | 0 | 0 | 61 | 3 (4.9) | 0 | 3 (4.9) |
| 18 | TAPVR | 1 | 0 | 0 | 0 | 2 | 0 | 0 | 0 | 0 | 0 | 0 | 0 | 0 | 0 | 0 | 0 | 3 | 0 | 0 | 0 |
| 19 | PAPVR ± ASD | 0 | 0 | 0 | 0 | 0 | 0 | 0 | 0 | 0 | 0 | 0 | 0 | 1 | 0 | 0 | 0 | 1 | 0 | 0 | 0 |
| 20 | ASD | 0 | 0 | 0 | 0 | 0 | 0 | 0 | 0 | 12 | 0 | 0 | 0 | 15 | 0 | 0 | 0 | 27 | 0 | 0 | 0 |
| 21 | Cor triatriatum | 0 | 0 | 0 | 0 | 0 | 0 | 0 | 0 | 0 | 0 | 0 | 0 | 0 | 0 | 0 | 0 | 0 | 0 | 0 | 0 |
| 22 | AVSD (partial) | 2 | 0 | 0 | 0 | 4 | 0 | 0 | 0 | 1 | 0 | 0 | 0 | 0 | 0 | 0 | 0 | 7 | 0 | 0 | 0 |
| 23 | AVSD (complete) | 32 | 0 | 0 | 0 | 68 | 0 | 0 | 1 (1.5) | 4 | 0 | 0 | 0 | 0 | 0 | 0 | 0 | 104 | 0 | 0 | 1 (1.0) |
| 24 | +TOF or DORV | 3 | 0 | 0 | 0 | 13 | 1 (7.7) | 0 | 1 (7.7) | 6 | 0 | 0 | 0 | 0 | 0 | 0 | 0 | 22 | 1 (4.5) | 0 | 1 (4.5) |
| 25 | +Others | 3 | 1 (33.3) | 0 | 1 (33.3) | 4 | 0 | 0 | 0 | 2 | 0 | 0 | 0 | 0 | 0 | 0 | 0 | 9 | 1 (11.1) | 0 | 1 (11.1) |
| 26 | VSD (subarterial) | 2 | 0 | 0 | 0 | 11 | 0 | 0 | 0 | 2 | 0 | 0 | 0 | 2 | 0 | 0 | 0 | 17 | 0 | 0 | 0 |
| 27 | VSD (perimemb./muscular) | 38 | 0 | 0 | 0 | 117 | 1 (0.9) | 0 | 3 (2.6) | 5 | 0 | 0 | 0 | 1 | 0 | 0 | 0 | 161 | 1 (0.6) | 0 | 3 (1.9) |
| 28 | VSD + PS | 0 | 0 | 0 | 0 | 1 | 0 | 0 | 0 | 0 | 0 | 0 | 0 | 0 | 0 | 0 | 0 | 1 | 0 | 0 | 0 |
| 29 | DCRV ± VSD | 0 | 0 | 0 | 0 | 0 | 0 | 0 | 0 | 0 | 0 | 0 | 0 | 0 | 0 | 0 | 0 | 0 | 0 | 0 | 0 |
| 30 | Aneurysm of sinus valsalva | 1 | 0 | 0 | 0 | 0 | 0 | 0 | 0 | 0 | 0 | 0 | 0 | 1 | 0 | 0 | 0 | 2 | 0 | 0 | 0 |
| 31 | TOF | 24 | 0 | 0 | 0 | 100 | 2 (2.0) | 0 | 2 (2.0) | 13 | 0 | 0 | 0 | 4 | 0 | 0 | 0 | 141 | 2 (1.4) | 0 | 2 (1.4) |
| 32 | PA + VSD | 26 | 0 | 0 | 0 | 83 | 0 | 0 | 0 | 15 | 0 | 0 | 0 | 1 | 0 | 0 | 0 | 125 | 0 | 0 | 0 |
| 33 | DORV | 27 | 0 | 0 | 0 | 55 | 1 (1.8) | 0 | 2 (3.6) | 14 | 0 | 0 | 0 | 2 | 0 | 0 | 0 | 98 | 1 (1.0) | 0 | 2 (2.0) |
| 34 | TGA (simple) | 7 | 0 | 0 | 0 | 1 | 0 | 0 | 0 | 1 | 0 | 0 | 0 | 1 | 0 | 0 | 0 | 10 | 0 | 0 | 0 |
| 35 | +VSD | 7 | 0 | 0 | 0 | 3 | 0 | 0 | 0 | 0 | 0 | 0 | 0 | 0 | 0 | 0 | 0 | 10 | 0 | 0 | 0 |
| 36 | VSD + PS | 9 | 1 (11.1) | 0 | 1 (11.1) | 5 | 0 | 0 | 0 | 2 | 0 | 0 | 0 | 0 | 0 | 0 | 0 | 16 | 1 (6.3) | 0 | 1 (6.3) |
| 37 | Corrected TGA | 8 | 0 | 0 | 0 | 18 | 1 (5.6) | 0 | 1 (5.6) | 4 | 0 | 0 | 0 | 0 | 0 | 0 | 0 | 30 | 1 (3.3) | 0 | 1 (3.3) |
| 38 | Truncus arteriosus | 20 | 0 | 0 | 1 (5.0) | 1 | 0 | 0 | 0 | 5 | 0 | 0 | 0 | 0 | 0 | 0 | 0 | 26 | 0 | 0 | 1 (3.8) |
| 39 | SV | 72 | 2 (2.8) | 0 | 3 (4.2) | 57 | 1 (1.8) | 0 | 3 (5.3) | 21 | 1 (4.8) | 0 | 1 | 3 | 1 (33.3) | 0 | 1 (33.3) | 153 | 5 (3.3) | 0 | 8 (5.2) |
| 40 | TA | 18 | 0 | 0 | 0 | 20 | 0 | 0 | 0 | 12 | 0 | 0 | 0 | 1 | 0 | 0 | 0 | 51 | 0 | 0 | 0 |
| 41 | HLHS | 81 | 2 (2.5) | 0 | 3 (3.7) | 19 | 0 | 0 | 0 | 3 | 0 | 0 | 0 | 0 | 0 | 0 | 0 | 103 | 2 (1.9) | 0 | 3 (2.9) |
| 42 | Aortic valve lesion | 4 | 0 | 0 | 0 | 2 | 0 | 0 | 0 | 4 | 0 | 0 | 0 | 2 | 0 | 0 | 0 | 12 | 0 | 0 | 0 |
| 43 | Mitral valve lesion | 0 | 0 | 0 | 0 | 0 | 0 | 0 | 0 | 1 | 0 | 0 | 0 | 0 | 0 | 0 | 0 | 1 | 0 | 0 | 0 |
| 44 | Ebstein | 6 | 1 (16.7) | 0 | 2 (33.3) | 4 | 0 | 0 | 0 | 1 | 0 | 0 | 0 | 3 | 0 | 0 | 0 | 14 | 1 (7.1) | 0 | 2 (14.3) |
| 45 | Coronary disease | 1 | 1 (100.0) | 0 | 1 (100.0) | 0 | 0 | 0 | 0 | 2 | 0 | 0 | 0 | 1 | 0 | 0 | 0 | 4 | 1 (25.0) | 0 | 1 (25.0) |
| 46 | Others | 24 | 1 (4.2) | 0 | 1 (4.2) | 65 | 1 (1.5) | 0 | 1 (1.5) | 75 | 1 (1.3) | 0 | 1 | 23 | 0 | 0 | 0 | 187 | 3 (1.6) | 0 | 3 (1.6) |
| 47 | Redo VSD | 0 | 0 | 0 | 0 | 3 | 0 | 0 | 0 | 36 | 0 | 0 | 0 | 1 | 0 | 0 | 0 | 40 | 0 | 0 | 0 |
| 48 | PS release | 0 | 0 | 0 | 0 | 0 | 0 | 0 | 0 | 1 | 0 | 0 | 0 | 0 | 0 | 0 | 0 | 1 | 0 | 0 | 0 |
| 49 | RV-PA conduit replace | 0 | 0 | 0 | 0 | 0 | 0 | 0 | 0 | 0 | 0 | 0 | 0 | 0 | 0 | 0 | 0 | 0 | 0 | 0 | 0 |
| 50 | Others | 18 | 0 | 0 | 1 (5.6) | 36 | 0 | 0 | 0 | 45 | 0 | 0 | 0 | 16 | 1 (6.3) | 0 | 1 (6.3) | 115 | 1 (0.9) | 0 | 2 (1.7) |
| Total | 946 | 17 (1.8) | 1 (0.1) | 27 (2.9) | 1,008 | 10 (1.0) | 0 | 18 (1.8) | 351 | 2 (0.6) | 0 | 2 | 82 | 2 (2.4) | 0 | 2 (2.4) | 2,387 | 31 (1.3) | 1 (0.04) | 49 (2.1) | |
Values in parenthesis represent mortality %
CPB cardiopulmonary bypass, PDA patient ductus arteriosus, VSD ventricular septal defect, DORV double outlet right ventricle, AVSD atrioventricular septal defect, TGA transposition of great arteries, SV single ventricle, Interupt. of Ao. interrupted aortic arch, PS pulmonary stenosis, PA-IVS pulmonary atresia with intact ventricular septum, TAPVR total anomalous pulmonary venous return, PAPVR partial anomalous pulmonary venous return, ASD atrial septal defect, TOF tetralogy of Fallot, DCRV double-chambered right ventricle, TA tricuspid atresia, HLHS hypoplastic left heart syndrome, RV-PA right ventricle–pulmonary artery
(3) Main procedure
| Neonate | Infant | 1–17 years | ≧18 years | Total | |||||||||||||||||
|---|---|---|---|---|---|---|---|---|---|---|---|---|---|---|---|---|---|---|---|---|---|
| Cases | 30-day mortality | Hospital mortality | Cases | 30-day mortality | Hospital mortality | Cases | 30-day mortality | Hospital mortality | Cases | 30-day mortality | Hospital mortality | Cases | 30-day mortality | Hospital mortality | |||||||
| Hospital | After discharge | Hospital | After discharge | Hospital | After discharge | Hospital | After discharge | Hospital | After discharge | ||||||||||||
| 1 | SP shunt | 170 | 5 (2.9) | 0 | 9 (5.3) | 425 | 9 (2.1) | 0 | 12 (2.8) | 58 | 1 (1.7) | 0 | 1 (1.7) | 1 | 0 | 0 | 0 | 654 | 15 (2.3) | 0 | 22 (3.4) |
| 2 | PAB | 359 | 6 (1.7) | 0 | 10 (2.8) | 250 | 3 (1.2) | 0 | 5 (2.0) | 15 | 0 | 0 | 0 | 2 | 0 | 0 | 0 | 626 | 9 (1.4) | 0 | 15 (2.4) |
| 3 | Bidirectional Glenn or hemi-Fontan ± α | 0 | 0 | 0 | 0 | 265 | 6 (2.3) | 0 | 6 (2.3) | 106 | 0 | 0 | 2 (1.9) | 4 | 0 | 0 | 0 | 375 | 6 (1.6) | 0 | 8 (2.1) |
| 4 | Damus–Kaye–Stansel operation | 4 | 1 (25.0) | 0 | 2 | 45 | 2 | 0 | 2 | 21 | 0 | 0 | 0 | 0 | 0 | 0 | 0 | 70 | 3 (4.3) | 0 | 4 (5.7) |
| 5 | PA reconstruction/repair (including redo) | 9 | 0 | 0 | 0 | 99 | 1 (1.0) | 0 | 2 (2.0) | 108 | 0 | 0 | 1 (0.9) | 18 | 0 | 0 | 1 (5.6) | 234 | 1 (0.4) | 0 | 4 (1.7) |
| 6 | RVOT reconstruction/repair | 16 | 2 (12.5) | 0 | 2 (12.5) | 107 | 0 | 0 | 1 (0.9) | 231 | 2 (0.9) | 0 | 2 (0.9) | 17 | 0 | 0 | 0 | 371 | 4 (1.1) | 0 | 5 (1.3) |
| 7 | Rastelli procedure | 3 | 1 (33.3) | 0 | 1 (33.3) | 44 | 2 (4.5) | 0 | 2 (4.5) | 108 | 2 (1.9) | 0 | 3 (2.8) | 10 | 0 | 0 | 0 | 165 | 5 (3.0) | 0 | 6 (3.6) |
| 8 | Arterial switch procedure | 154 | 5 (3.2) | 0 | 8 (5.2) | 23 | 1 (4.3) | 0 | 1 (4.3) | 6 | 0 | 0 | 0 | 0 | 0 | 0 | 0 | 183 | 6 (3.3) | 0 | 9 (4.9) |
| 9 | Atrial switch procedure | 4 | 0 | 0 | 0 | 0 | 0 | 0 | 0 | 2 | 0 | 0 | 0 | 1 | 0 | 0 | 0 | 7 | 0 | 0 | 0 |
| 10 | Double switch procedure | 0 | 0 | 0 | 0 | 0 | 0 | 0 | 0 | 11 | 0 | 0 | 0 | 0 | 0 | 0 | 0 | 11 | 0 | 0 | 0 |
| 11 | Repair of anomalous origin of CA | 1 | 0 | 0 | 0 | 6 | 0 | 0 | 0 | 14 | 0 | 0 | 0 | 7 | 0 | 0 | 0 | 28 | 0 | 0 | 0 |
| 12 | Closure of coronary AV fistula | 0 | 0 | 0 | 0 | 1 | 0 | 0 | 0 | 5 | 0 | 0 | 1 (20.0) | 24 | 0 | 0 | 0 | 30 | 0 | 0 | 1 (3.3) |
| 13 | Fontan/TCPC | 1 | 0 | 0 | 0 | 3 | 0 | 0 | 0 | 408 | 4 (1.0) | 0 | 6 (1.5) | 26 | 2 (7.7) | 0 | 3 (11.5) | 438 | 6 (1.4) | 0 | 9 (2.1) |
| 14 | Norwood procedure | 42 | 8 (19.0) | 1 (2.4) | 7 (16.7) | 78 | 7 (9.0) | 0 | 11 (14.1) | 10 | 1 (10.0) | 0 | 2 (20.0) | 0 | 0 | 0 | 0 | 130 | 16 (12.3) | 1 (8.1) | 20 (15.4) |
| 15 | Ventricular septation | 0 | 0 | 0 | 0 | 7 | 2 (28.6) | 0 | 2 (28.6) | 4 | 0 | 0 | 0 | 1 | 0 | 0 | 0 | 12 | 2 (16.7) | 0 | 2 (16.7) |
| 16 | Left side AV valve repair (including redo) | 0 | 0 | 0 | 0 | 66 | 1 (1.5) | 0 | 1 (1.5) | 63 | 1 (1.6) | 0 | 1 (1.6) | 11 | 1 (9.1) | 0 | 1 (9.1) | 140 | 3 (2.1) | 0 | 3 (2.1) |
| 17 | Left side AV valve replace (including redo) | 1 | 1 (100) | 0 | 1 (100) | 15 | 1 (6.7) | 0 | 1 (6.7) | 41 | 2 (4.9) | 0 | 2 (4.9) | 20 | 0 | 0 | 0 | 77 | 4 (5.2) | 0 | 4 (5.2) |
| 18 | Right side AV valve repair (including redo) | 2 | 0 | 0 | 0 | 13 | 0 | 0 | 0 | 34 | 0 | 0 | 0 | 30 | 0 | 0 | 0 | 79 | 0 | 0 | 0 |
| 19 | Right side AV valve replace (including redo) | 0 | 0 | 0 | 0 | 1 | 0 | 0 | 0 | 6 | 0 | 0 | 0 | 8 | 0 | 0 | 0 | 15 | 0 | 0 | 0 |
| 20 | Common AV valve repair (including redo) | 2 | 1 (50.0) | 0 | 1 (50.0) | 34 | 5 (14.7) | 0 | 5 (14.7) | 19 | 1 (5.3) | 0 | 1 (5.3) | 1 | 0 | 0 | 0 | 56 | 7 (12.5) | 0 | 7 (12.5) |
| 21 | Common AV valve replace (including redo) | 2 | 1 (50.0) | 0 | 1 (50.0) | 6 | 1 (16.7) | 0 | 1 (16.7) | 8 | 0 | 0 | 1 (12.5) | 3 | 0 | 0 | 0 | 19 | 2 (10.5) | 0 | 3 (15.8) |
| 22 | Repair of supra-aortic stenosis | 1 | 0 | 0 | 0 | 6 | 1 (16.7) | 0 | 1 (16.7) | 9 | 1 (11.1) | 0 | 1 (11.1) | 0 | 0 | 0 | 0 | 16 | 2 (12.5) | 0 | 2 (12.5) |
| 23 | Repair of subaortic stenosis (including redo) | 1 | 1 (100.0) | 0 | 1 (100.0) | 7 | 0 | 0 | 1 (14) | 36 | 0 | 0 | 0 | 4 | 0 | 0 | 0 | 48 | 1 (2.1) | 0 | 2 (4.2) |
| 24 | Aortic valve plasty ± VSD closure | 3 | 0 | 0 | 0 | 12 | 0 | 0 | 1 (8.3) | 24 | 0 | 0 | 0 | 4 | 0 | 0 | 0 | 43 | 0 | 0 | 1 (2.3) |
| 25 | Aortic valve replacement | 0 | 0 | 0 | 0 | 2 | 0 | 0 | 0 | 22 | 0 | 0 | 0 | 23 | 0 | 0 | 0 | 47 | 0 | 0 | 0 |
| 26 | AVR with annular enlargement | 1 | 0 | 0 | 0 | 3 | 0 | 0 | 0 | 13 | 0 | 0 | 0 | 6 | 1 (16.7) | 0 | 1 (16.7) | 23 | 1 (4.3) | 0 | 1 (4.3) |
| 27 | Aortic root replace (except Ross) | 0 | 0 | 0 | 0 | 0 | 0 | 0 | 0 | 6 | 0 | 0 | 0 | 5 | 0 | 0 | 0 | 11 | 0 | 0 | 0 |
| 28 | Ross procedure | 0 | 0 | 0 | 0 | 3 | 0 | 0 | 0 | 10 | 0 | 0 | 0 | 1 | 0 | 0 | 0 | 14 | 0 | 0 | 0 |
| Total | 776 | 32 (4.1) | 1 (0.1) | 43 (5.5) | 1,521 | 42 (2.8) | 0 | 55 (3.6) | 1,398 | 15 (1.1) | 0 | 24 (1.7) | 227 | 4 (1.8) | 0 | 6 (2.6) | 3,922 | 93 (2.4) | 1 (0.03) | 128 (3.3) | |
Values in parenthesis represent mortality %
SP systemic pulmonary, PAB pulmonary artery banding, PA pulmonary artery, RVOT right ventricular outflow tract, CA coronary artery, AV fustula arteriovenous fistula, TCPC total cavopulmonary connection, AV valve atrioventricular valve, VSD ventricular septal defect, AVR aortic valve replacement
Abstract of the survey
We sent out survey questionnaire forms to the departments of each category in all 1,986 institutions (601 cardiovascular, 802 general thoracic and 582 esophageal) nationwide in early April 2013. The response rates in each category by the end of December 2013 were 97.0, 96.8, and 95.2 %, respectively. This high response rate has been keep throughout recent survey, and more than 95 % response rate in all fields in 2012 survey has to be congratulated.
2012 Final report
(A) Cardiovascular surgery
First, we are very pleased with the high response rate to our survey of cardiovascular surgery (97.0 %), which definitely enhances the quality of this annual report. We very much appreciate the enormous effort put into completing the survey at each participating institution.
Figure 1 shows the development of cardiovascular surgery in Japan over the last 26 years. Aneurysm surgery includes only operations for thoracic and thoracoabdominal aortic aneurysm. Pacemaker implantation includes only transthoracic implantation and transvenous implantation is excluded. The number of pacemaker and assist device implantation operations is not included in the total number of surgical operations. A total of 63,800 cardiovascular operations were performed at 583 institutions during 2012 alone and included 28 heart transplantations, which were restarted in 1999.
Fig. 1.
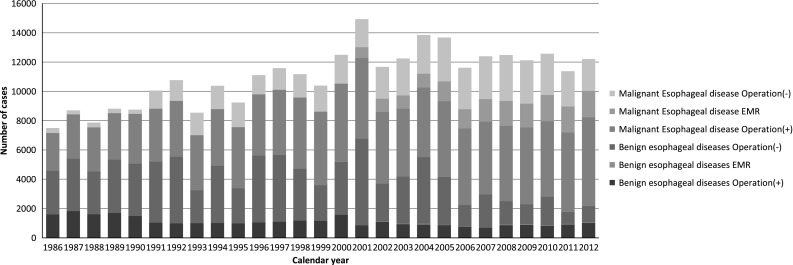
Annual trend of in-patients with esophageal diseases, EMR endoscopic mucosal resection (including endoscopic submucosal)
The number of operations for congenital heart disease (9,558 cases) decreased slightly (3.1 %) compared with that of 2011 (9,859 cases), while there was 3.9 % increase when compared with the data of 10 years ago (9,202 cases in 2002). The number of operations for adult cardiac disease (20,913 cases in valvular heart disease, 16,752 cases in ischemic heart disease, 14,944 cases in thoracic aortic aneurysm and 1,663 cases for other procedures) increased compared with those of 2011 in all categories (9.1, 7.5, 5.8 and 5.1 %, respectively). During the last 10 years, the numbers of operations for adult heart disease increased constantly except for that of ischemic heart disease (81.0 % increase in valvular heart disease, 26.6 % decrease in ischemic heart disease, 112.4 % increase in thoracic aortic aneurysm, and 40.7 % increase in other procedures compared those of 2002). The concomitant coronary artery bypass grafting procedure (CABG) is not included in ischemic heart disease but included in other categories such as valvular heart disease in our study, then, the number of CABG still remained over 20,000 cases per year (21,569 cases) in 2012, which is 89.4 % of that in 2002 (24,135 cases).
Data for individual categories are summarized in tables through 1 to 7.
In 2012, 7,171 open-heart operations for congenital heart disease were performed with overall hospital mortality of 2.3 %. The number of operations for congenital heart disease was quite steady throughout these 10 years (maximum 7,386 cases in 2006), while overall hospital mortality decreased gradually from that of 3.6 % in 2002. In detail, the most common disease was atrial septal defect (1,331 cases), however, its number deceased to 71.7 % of that in 2002, which might be due to the recent development of catheter closure of atrial septal defect in Japan. Hospital mortality for complex congenital heart disease improved dramatically in the last 10 years such as interrupted aortic arch with ventricular septal defect (13.9 % in 2002 to 3.6 % in 2012), complete atrio-septal defect (4.2 to 3.2 %), Tetralogy of Fallot (3.8 to 1.1 %), transposition of the great arteries with and without ventricular septal defect (14.0 to 3.2 % and 7.4 to 2.6 %, respectively), single ventricle and tricuspid atresia (9.2 to 5.5 % and 3.9 to 0 %, respectively), and hypoplastic left heart syndrome (37.9 to 10.2 %). Right heart bypass surgery is now commonly performed (375 bidirectional Glenn procedures and 438 Fontan type procedures including total cavopulmonary connection) with acceptable hospital mortality (2.1 % in each procedure). Norwood type I procedure was performed in 130 cases with relatively low hospital mortality rate of 15.4 %.
As previously mentioned, the number of operations for valvular heart disease increased by 81 % in the last 10 years, and the hospital mortality associated with primary single valve replacement was 3.0 and 4.5 % for the aortic and the mitral position, while that for primary mitral valve repair was 1.3 %. However, hospital mortality rate for redo valve surgery was still high and was 9.3 and 6.7 % for aortic and mitral procedure, respectively. Finally, overall hospital mortality did not show any improvement during the last 10 years (3.1 % in 2002 and 3.2 % in 2012), which might be partially due to the recent progression of age of the patients. Repair of the valve became popular procedure (484 cases in the aortic, 6,002 cases in the mitral, and 4,947 case in the tricuspid), and mitral valve repair constituted 28.7 % of all valvular heart disease operation and 57.6 % of all mitral valve procedure (10,425 procedures), which are similar to those of the last 4 years and increased compared with those of 2002 (19.5 and 34.9 %, respectively). Aortic and mitral valve replacement with bioprosthesis were performed in 8,926 cases and 3,002 cases, respectively, with the number consistently increasing. The ratio of prostheses changed dramatically during the last 10 years, and the usage of bioprosthesis is 74.3 % at the aortic position (37.3 % in 2002) and 61.0 % at the mitral position (24.2 % in 2002). CABG as a concomitant procedure increased gradually to 23.9 % of operations for all valvular heart disease (12.1 % in 2002).
Isolated CABG was performed in 15,462 cases which were only 71.5 % of that of 10 years ago (2002), however, there was an increase of 8.5 % compared with that in 2011. Among these 15,462 cases, off-pump CABG was intended in 9,499 cases (61.4 %) with a success rate of 97.9 %, so final success rate of off-pump CABG was 60.2 %. The percentage of intended off-pump CABG was 55.2 % in 2003, and was increased to 60.3 % in 2004, then was kept over 60 % until now. Conversion rate from off-pump CABG to on-pump CABG of 2.1 % was just same as that in 2011. In 15,462 isolated CABG patients, 96.5 % of them received at least one arterial graft, while, all arterial graft CABG was performed in only 23.5 % of them.
The operative and hospital mortality rates associated with primary elective CABG procedures in 13,004 cases were 0.6 and 1.1 %, respectively. Similar data analysis of CABG including primary/redo and elective/emergency data was begun in 2003, and the operative and hospital mortality rates associated with primary elective CABG procedures in 2003 were 1.0 and 1.5 %, respectively, so operative results of primary CABG have been improved. However, hospital mortality of primary emergency CABG in 2,224 cases was 7.4 %, which was still high in spite of slight improvement compared with 9.7 % of hospital mortality rate in 2003. In comparison with data in 2003, the results of conversion improved both conversion rate (3.1 to 2.1 %) and hospital mortality (8.5 to 5.1 %).
A total of 1,274 patients underwent surgery for complications of myocardial infarction, including 413 operations for a left ventricular aneurysm or ventricular septal perforation or cardiac rupture and 296 operations for ischemic mitral regurgitation.
Operations for arrhythmia were performed mainly as a concomitant procedure in 3,992 cases with satisfactory mortality (1.8 % hospital mortality) including 3,771 MAZE procedures. MAZE procedure has become quite popular procedure when compared with that in 2002 (1,141 cases).
Operations for thoracic aortic dissection were performed in 6,266 cases. For 4,186 Stanford type A acute aortic dissections, hospital mortality was 10.6 %, which was similar to that in 2011 (11.1 %) and better than that in 2002 (15.5 %). Operations for a non-dissected thoracic aneurysm were carried out in 8,678 cases, with overall hospital mortality of 5.4 %, which was better than that in 2011 (6.7 %). The hospital mortality associated with unruptured aneurysm was 4.0 %, and that of ruptured aneurysm was 22.2 %, which remains markedly high.
The number of stent graft procedures remarkably increased recently. A total of 835 patients with aortic dissection underwent stent graft placement: thoracic endovascular aortic repair (TEVAR) in 723 cases, open stent grafting in 109 cases, and unspecified in 3 cases. The number of TEVAR for type B chronic aortic dissections increased from 359 cases in 2011 to 492 cases in 2012. The hospital mortality rates associated with TEVAR for type B aortic dissection were 7.3 % in acute cases and 2.6 % for chronic cases, respectively.
A total of 3,236 patients with non-dissected aortic aneurysm underwent stent graft placement with 18.8 % increase compared with that in 2011 (2,725 cases); TEVAR in 3,006 cases (23.6 % increase compared with that in 2011), open stent grafting in 226 cases (20.8 % decrease compared with that in 2011), and unspecified in 4 cases. The hospital mortality rates for TEVAR were 2.5 and 16.1 % for non-ruptured and ruptured aneurysm, respectively.
In summary, the total cardiovascular operations increased during 2012 by 3,516 cases, with steadily improving results in almost all categories compared with those in 2011.
Table 2 Acquired (total, (1) + (2) + (4) + (5) + (6) + (7) + isolated ope. for arrhythmia in (3); 39,177
(1) Valvular heart disease (total; 20,913)
| Valve | Cases | Operation | 30-day mortality | Hospital mortality | Redo | ||||||||||||
|---|---|---|---|---|---|---|---|---|---|---|---|---|---|---|---|---|---|
| Mechanical | Bioprosthesis | Ross procedure | Repair | With CABG | Hospital | After discharge | 30-day mortality | Hospital mortality | |||||||||
| Replace | Repair | Replace | Repair | Replace | Repair | Cases | Hospital | After discharge | |||||||||
| Isolated | A | 9,688 | 2,219 | 7,074 | 3 | 392 | 2,316 | 189 (2.0) | 6 (1.5) | 9 (0.1) | 0 | 275 (3.0) | 6 (1.5) | 365 | 20 (5.5) | 0 | 34 (9.3) |
| M | 4,617 | 721 | 847 | 0 | 3,049 | 773 | 45 (2.9) | 23 (0.8) | 1 (0.1) | 2 (0.1) | 71 (4.5) | 41 (1.3) | 356 | 14 (3.9) | 0 | 24 (6.7) | |
| T | 312 | 9 | 92 | 211 | 42 | 5 (5.0) | 2 (0.9) | 0 | 0 | 8 (7.9) | 5 (2.4) | 66 | 2 (3.0) | 0 | 6 (9.1) | ||
| P | 18 | 0 | 15 | 3 | 1 | 0 | 0 | 0 | 0 | 0 | 0 | 10 | 0 | 0 | 0 | ||
| A + M | A | 1,380 | 444 | 882 | 0 | 54 | 215 | 65 | (4.7) | 0 | 96 | (7.0) | 100 | ||||
| M | 303 | 383 | 0 | 694 | 8 (8.0) | 0 | 11 (11.0) | ||||||||||
| A + T | A | 400 | 110 | 281 | 1 | 8 | 45 | 15 | (3.8) | 0 | 29 | (7.3) | 55 | ||||
| T | 3 | 23 | 0 | 374 | 2 (3.6) | 0 | 5 (9.1) | ||||||||||
| M + T | M | 3,388 | 634 | 925 | 1,829 | 294 | 65 | (1.9) | 0 | 91 | (2.7) | 274 | |||||
| T | 6 | 50 | 3,332 | 14 (5.1) | 0 | 26 (9.5) | |||||||||||
| A + M + T | A | 1,040 | 321 | 689 | 0 | 30 | 117 | 37 | (3.6) | 0 | 51 | (4.9) | 76 | ||||
| M | 262 | 348 | 0 | 430 | 4 (5.3) | 0 | 5 (6.6) | ||||||||||
| T | 0 | 9 | 1 | 1,030 | |||||||||||||
| Others | 70 | 18 | 38 | 0 | 16 | 5 | 3 | (4.3) | 0 | 3 | (4.3) | 7 | 1 (14.3) | 0 | 1 (14.3) | ||
| Total | 20,913 | 5,050 | 11,656 | 5 | 11,452 | 3,808 | 455 | (2.2) | 12 | 676 | (3.2) | 1,309 | 65 (5.0) | 0 | 112 (8.6) | ||
Number of redo cases is included in total case number of 18,713
Values in parenthesis represent mortality %
CABG coronary artery bypass grafting, A aortic valve, M mitral valve, T tricuspid valve, P pulmonary valve
(2) Ischemic heart disease (total, (A) + (B) + (C); 16,752)
(A) Isolated CABG (total; (a) + (b); 15,462)
(a-1) On-pump arrest CABG (total; 3,749)
| Primary, elective | Primary, emergency | Redo, elective | Redo, emergency | Arterial graft only | Artery graft+SVG | SVG only | Others | |||||||||||||
|---|---|---|---|---|---|---|---|---|---|---|---|---|---|---|---|---|---|---|---|---|
| Cases | 30-day mortality | Hospital mortality | Cases | 30-day mortality | Hospital mortality | Cases | 30-day mortality | Hospital mortality | Cases | 30-day mortality | Hospital mortality | |||||||||
| Hospital | After discharge | Hospital | After discharge | Hospital | After discharge | Hospital | After discharge | |||||||||||||
| 1VD | 79 | 0 | 0 | 1 (1.3) | 20 | 2 (10.0) | 0 | 2 (10.0) | 2 | 0 | 0 | 0 | 0 | 0 | 0 | 0 | 66 | 6 | 29 | 0 |
| 2VD | 454 | 4 (0.9) | 0 | 5 (1.1) | 44 | 2 (4.5) | 0 | 2 (4.5) | 10 | 1 (10.0) | 0 | 1 (10.0) | 4 | 2 (50.0) | 0 | 2 (50.0) | 111 | 367 | 34 | 0 |
| 3VD | 1,648 | 13 (0.8) | 0 | 17 (1.0) | 203 | 12 (5.9) | 0 | 14 (6.9) | 12 | 0 | 0 | 0 | 0 | 0 | 0 | 0 | 132 | 1,691 | 40 | 0 |
| LMT | 1,003 | 16 (1.6) | 0 | 20 (2.0) | 255 | 13 (5.1) | 0 | 17 (6.7) | 14 | 2 (14.3) | 0 | 2 (14.3) | 1 | 1 (100.0) | 0 | 1 (100.0) | 146 | 1,080 | 47 | 0 |
| Uncertain | 0 | |||||||||||||||||||
| Total | 3,184 | 33 (1.0) | 0 | 43 (1.4) | 522 | 29 (5.6) | 35 (6.7) | 38 | 3 (7.9) | 3 (7.9) | 5 | 3 (60.0) | 3 (60.0) | 455 | 3,144 | 150 | 0 | |||
| Kawasaki | 10 | 0 | 0 | 0 | 1 | 0 | 0 | 0 | 0 | 0 | 0 | 0 | 0 | 0 | 0 | 0 | 7 | 4 | 0 | 0 |
| Hemodialysis | 193 | 7 (3.6) | 0 | 8 (4.1) | 40 | 9 (22.5) | 0 | 10 (25.0) | 4 | 0 | 0 | 0 | 2 | 0 | 0 | 0 | 13 | 217 | 9 | 0 |
Values in parenthesis represent mortality %
LMT includes LMT alone or LMT with other branch diseases. CABG coronary artery bypass grafting, 1VD one-vessel disease, 2VD two-vessel disease, 3VD three-vessel disease, LMT left main trunk, SVG saphenous vein graft
(a-2) On-pump beating CABG (total; 2,214)
| Primary, elective | Primary, emergency | Redo, elective | Redo, emergency | Arterial graft only | Artery graft+SVG | SVG only | Others | |||||||||||||
|---|---|---|---|---|---|---|---|---|---|---|---|---|---|---|---|---|---|---|---|---|
| Cases | 30-day mortality | Hospital mortality | Cases | 30-day mortality | Hospital mortality | Cases | 30-day mortality | Hospital mortality | Cases | 30-day mortality | Hospital mortality | |||||||||
| Hospital | After discharge | Hospital | After discharge | Hospital | After discharge | Hospital | After discharge | |||||||||||||
| 1VD | 23 | 0 | 0 | 1 (4.3) | 14 | 0 | 0 | 1 (7.1) | 4 | 0 | 0 | 0 | 4 | 1 (25.0) | 0 | 2 (50.0) | 22 | 5 | 18 | 0 |
| 2VD | 235 | 2 (0.9) | 0 | 6 (2.6) | 65 | 7 (10.8) | 0 | 7 (10.8) | 11 | 1 (9.1) | 0 | 1 (9.1) | 3 | 0 | 0 | 0 | 65 | 223 | 25 | 1 |
| 3VD | 805 | 8 (1.0) | 1 (0.1) | 16 (2.0) | 211 | 20 (9.5) | 0 | 28 (13.3) | 12 | 0 | 0 | 1 (8.3) | 1 | 0 | 0 | 0 | 107 | 889 | 33 | 0 |
| LMT | 550 | 4 (0.7) | 0 | 9 (1.6) | 264 | 27 (10.2) | 1 (0.4) | 36 (13.6) | 10 | 0 | 0 | 0 | 2 | 0 | 0 | 0 | 139 | 639 | 48 | 0 |
| Total | 1,613 | 14 (0.9) | 32 (2.0) | 554 | 54 (9.7) | 72 (13.0) | 37 | 1 (2.7) | 2 (5.4) | 10 | 1 (10.0) | 2 (20.0) | 333 | 1,756 | 124 | 1 | ||||
| Kawasaki | 1 | 0 | 0 | 0 | 1 | 0 | 0 | 0 | 0 | 0 | 0 | 0 | 0 | 0 | 0 | 0 | 1 | 1 | 0 | 0 |
| Hemodialysis | 158 | 2 (1.3) | 0 | 8 (5.1) | 46 | 5 (10.9) | 0 | 5 (10.9) | 3 | 0 | 0 | 1 (33.3) | 3 | 0 | 0 | 0 | 18 | 176 | 16 | 0 |
Values in parenthesis represent mortality %
LMT includes LMT alone or LMT with other branch diseases. CABG coronary artery bypass grafting, 1VD one-vessel disease, 2VD two-vessel disease, 3VD three-vessel disease, LMT left main trunk, SVG saphenous vein graft
(b) Off-pump CABG (total; 9,499)
(The present section also includes cases of planned off-pump CABG in which, during surgery, the change is made to an on-pump CABG or on-pump beating-heart procedure)
| Primary, elective | Primary, emergency | Redo, elective | Redo, emergency | Arterial graft only | Artery graft+SVG | SVG only | Others | |||||||||||||
|---|---|---|---|---|---|---|---|---|---|---|---|---|---|---|---|---|---|---|---|---|
| Cases | 30-day mortality | Hospital mortality | Cases | 30-day mortality | Hospital mortality | Cases | 30-day mortality | Hospital mortality | Cases | 30-day mortality | Hospital mortality | |||||||||
| Hospital | After discharge | Hospital | After discharge | Hospital | After discharge | Hospital | After discharge | |||||||||||||
| 1VD | 582 | 1 (0.2) | 0 | 6 (1.0) | 67 | 2 (3.0) | 0 | 3 (4.5) | 40 | 0 | 1 | 0 | 8 | 0 | 0 | 0 | 590 | 48 | 59 | 0 |
| 2VD | 1,484 | 6 (0.4) | 0 | 12 (0.8) | 135 | 3 (2.2) | 0 | 5 (3.7) | 18 | 2 (11.1) | 0 | 2 (11.1) | 5 | 0 | 0 | 0 | 630 | 961 | 41 | 0 |
| 3VD | 3,645 | 11 (0.3) | 1 (0.03) | 31 (0.9) | 390 | 14 (3.6) | 0 | 21 (5.4) | 22 | 0 | 0 | 0 | 3 | 1 (33.3) | 0 | 1 (33.3) | 772 | 3,221 | 61 | 2 |
| LMT | 2,496 | 14 (0.6) | 0 | 24 (1.0) | 574 | 23 (4.0) | 0 | 31 (5.4) | 24 | 0 | 0 | 0 | 6 | 1 (16.7) | 0 | 1 (16.7) | 855 | 2,161 | 75 | 0 |
| Total | 8,207 | 32 (0.4) | 1 (0.01) | 73 (0.9) | 1,166 | 42 (3.6) | 60 (5.1) | 104 | 2 (1.9) | 2 (1.9) | 22 | 2 (9.1) | 2 (9.1) | 2,847 | 6,391 | 236 | 2 | |||
| Kawasaki | 6 | 0 | 0 | 0 | 1 | 0 | 0 | 0 | 1 | 0 | 0 | 0 | 0 | 0 | 0 | 0 | 7 | 1 | 0 | 0 |
| Hemodialysis | 659 | 7 (1.1) | 0 | 15 (2.3) | 94 | 10 (10.6) | 0 | 17 (18.1) | 10 | 0 | 0 | 0 | 0 | 0 | 0 | 0 | 163 | 581 | 19 | 0 |
Values in parenthesis represent mortality %
LMT includes LMT alone or LMT with other branch diseases. CABG coronary artery bypass grafting, 1VD one-vessel disease, 2VD two-vessel disease, 3VD three-vessel disease, LMT left main trunk, SVG saphenous vein graft
(c) Includes cases of conversion, during surgery, from off-pump CABG to on-pump CABG or on-pump beating-heart CABG (total; 197)
| Primary, elective | Primary, emergency | Redo, elective | Redo, emergency | |||||||||||||
|---|---|---|---|---|---|---|---|---|---|---|---|---|---|---|---|---|
| Cases | 30-day mortality | Hospital mortality | Cases | 30-day mortality | Hospital mortality | Cases | 30-day mortality | Hospital mortality | Cases | 30-day mortality | Hospital mortality | |||||
| Hospital | After discharge | Hospital | After discharge | Hospital | After discharge | Hospital | After discharge | |||||||||
| A conversion to on-pump CABG arrest heart | 33 | 1 (3.0) | 0 | 1 (3.0) | 5 | 0 | 0 | 0 | 0 | 0 | 0 | 0 | 0 | 0 | 0 | |
| A conversion to on-pump beating-heart CABG | 117 | 5 (4.3) | 0 | 6 (5.1) | 41 | 3 (7.3) | 0 | 3 (7.3) | 1 | 0 | 0 | 0 | 0 | 0 | 0 | |
| Total | 150 | 7 (4.7) | 0 | 7 (4.7) | 46 | 3 (6.5) | 3 (6.5) | 1 | 0 | 0 | 0 | 0 | 0 | 0 | 0 | |
| Hemodialysis | 13 | 1 (7.7) | 0 | 1 (7.7) | 6 | 2 (33.3) | 2 (33.3) | 0 | 0 | 0 | 0 | 0 | 0 | 0 | 0 | |
Values in parenthesis represent mortality %
CABG coronary artery bypass grafting
(B) Operation for complications of MI (total; 1,274)
| Chronic | Acute | Concomitant operation | |||||||||
|---|---|---|---|---|---|---|---|---|---|---|---|
| Cases | 30-day mortality | Hospital mortality | Cases | 30-day mortality | Hospital mortality | ||||||
| Hospital | After discharge | Hospital | After discharge | CABG | MVP | MVR | |||||
| Infarctectomy or aneurysmectomy | 350 | 18 (5.1) | 0 | 29 (8.3) | 26 | 2 (7.7) | 0 | 3 (11.5) | 263 | 107 | 15 |
| VSP closure | 49 | 4 (8.2) | 0 | 7 (14.3) | 240 | 53 (22.1) | 1 | 64 (26.7) | 89 | 7 | 10 |
| Cardiac rupture | 14 | 1 (7.1) | 0 | 1 (7.1) | 224 | 75 (33.5) | 0 | 85 (37.9) | 40 | 2 | 4 |
| Mitral regurgitation | |||||||||||
| 1) Papillary muscle rupture | 11 | 0 | 0 | 0 | 35 | 9 (25.7) | 0 | 11 (31.4) | 18 | 10 | 23 |
| 2) Ischemic | 285 | 18 (6.3) | 0 | 30 (10.5) | 28 | 4 (14.3) | 0 | 4 (14.3) | 262 | 225 | 48 |
| Others | 5 | 0 | 0 | 0 | 7 | 1 (14.3) | 0 | 1 (14.3) | 2 | 0 | 0 |
| Total | 714 | 41 (5.7) | 0 | 67 (9.4) | 560 | 144 (25.7) | 1 | 168 (30.0) | 674 | 351 | 100 |
Values in parenthesis represent mortality %
Acute, within 2 weeks from the onset of myocardial infarction
MI myocardial infarction, CABG coronary artery bypass grafting, MVP mitral valve repair, MVR mitral valve replacement, VSP ventricular septal perforation
(C) TMLR (total; 16)
| Cases | 30-day mortality | Hospital mortality | ||
|---|---|---|---|---|
| Hospital | After discharge | |||
| Isolated | 14 | 2 (14.29) | 0 | 2 (14.29) |
| With CABG | 2 | 0 | 0 | 0 |
| Total | 16 | 2 (12.5) | 0 | 2 (12.5) |
Values in parenthesis represent mortality %
TMLR transmyocardial laser revascularization
(3) Operation for arrhythmia (total; 4,183)
| Cases | 30-day mortality | Hospital mortality | Concomitant operation | ||||||||
|---|---|---|---|---|---|---|---|---|---|---|---|
| Isolated | Congenital | Valve | IHD | Others | Multiple combination | ||||||
| Hospital | After discharge | 2 Categories | 3 Categories | ||||||||
| Maze | 3,935 | 42 (1.1) | 0 | 62 (1.6) | 15 | 197 | 3,471 | 493 | 198 | 462 | 24 |
| For WPW | 0 | 0 | 0 | 0 | 0 | 0 | 0 | 0 | 0 | 0 | 0 |
| For ventricular tachyarrhythmia | 44 | 1 (2.3) | 0 | 2 (4.5) | 2 | 3 | 13 | 27 | 7 | 8 | 0 |
| Others | 204 | 10 (4.9) | 0 | 13 (6.4) | 3 | 39 | 141 | 43 | 18 | 38 | 1 |
| Total | 4,183 | 53 (1.3) | 0 | 77 (1.8) | 20 | 239 | 3,625 | 563 | 223 | 508 | 25 |
Values in parenthesis represent mortality %. Except for 20 isolated cases, all remaining 4,163 cases are doubly allocated, one for this subgroup and the other for the subgroup corresponding to the concomitant operations
WPW Wolff–Parkinson–White syndrome, IHD ischemic heart disease
(4) Operation for constrictive pericarditis (total; 195)
| CPB (+) | CPB (−) | |||||||
|---|---|---|---|---|---|---|---|---|
| Cases | 30-day mortality | Hospital mortality | Cases | 30-day mortality | Hospital mortality | |||
| Hospital | After discharge | Hospital | 96 | |||||
| Total | 96 | 9 (9.4) | 0 | 18 (18.8) | 99 | 5 (5.1) | 0 | 9 (9.1) |
Values in parenthesis represent mortality %
CPB cardiopulmonary bypass
(5) Cardiac tumor (total; 628)
| Cases | 30-day mortality | Hospital mortality | Concomitant operation | |||||
|---|---|---|---|---|---|---|---|---|
| Hospital | After discharge | AVR | MVR | CABG | Others | |||
| Benign tumor | 553 | 6 (1.1) | 8 (1.4) | 14 | 7 | 25 | 58 | |
| Cardiac myxoma | 405 | 2 (0.5) | 0 | 3 (0.7) | 4 | 3 | 17 | 41 |
| Papillary fibroelastoma | 47 | 0 | 0 | 0 | 6 | 2 | 0 | 7 |
| Rhabdomyoma | 4 | 0 | 0 | 0 | 0 | 0 | 0 | 1 |
| Others | 97 | 4 (4.1) | 0 | 5 (5.2) | 4 | 2 | 8 | 9 |
| Malignant tumor | 75 | 2 (2.7) | 1 (1.3) | 6 (8.0) | 0 | 0 | 2 | 8 |
| Primary | 43 | 2 (4.7) | 1 (2.3) | 5 (11.6) | 0 | 0 | 2 | 5 |
| Metastatic | 32 | 0 | 0 | 1 (3.1) | 0 | 0 | 0 | 3 |
Values in parenthesis represent mortality %
AVR aortic valve replacement, MVR mitral valve replacement, CABG coronary artery bypass grafting
(6) HOCM and DCM (total; 217)
| Cases | 30-day mortality | Hospital mortality | Concomitant operation | |||||
|---|---|---|---|---|---|---|---|---|
| Hospital | After discharge | AVR | MVR | MVP | CABG | |||
| Myectomy | 133 | 4 (3.0) | 0 | 16 (12.0) | 67 | 21 | 12 | 12 |
| Myotomy | 6 | 0 | 0 | 0 | 1 | 0 | 3 | 0 |
| No-resection | 38 | 1 (2.6) | 0 | 7 (18.4) | 8 | 21 | 13 | 3 |
| Volume reduction surgery of the left ventricle | 40 | 3 (7.5) | 0 | 4 (10.0) | 1 | 8 | 24 | 7 |
| Total | 217 | 8 (3.7) | 0 | 27 (12.4) | 77 | 50 | 52 | 22 |
Values in parenthesis represent mortality %
HOCM hypertrophic obstructive cardiomyopathy, DCM dilated cardiomyopathy, AVR aortic valve replacement, MVR mitral valve replacement, MVP mitral valve repair, CABG coronary artery bypass grafting
(7) Other open-heart operation (total; 452)
| Cases | 30-day mortality | Hospital mortality | ||
|---|---|---|---|---|
| Hospital | After discharge | |||
| Total | 452 | 38 (8.4) | 0 | 53 (11.7) |
Values in parenthesis represent mortality %
Table 3 Thoracic aortic aneurysm (total; 14,944)
(1) Dissection (total; 6,266)
| Replaced site | Stanford type | ||||||||||||||||||||||||
|---|---|---|---|---|---|---|---|---|---|---|---|---|---|---|---|---|---|---|---|---|---|---|---|---|---|
| Acute | Chronic | Concomitant operation | Redo | ||||||||||||||||||||||
| A | B | A | B | ||||||||||||||||||||||
| Cases | 30-day mortality | Hospital mortality | Cases | 30-day mortality | Hospital mortality | Cases | 30-day mortality | Hospital mortality | Cases | 30-day mortality | Hospital mortality | AVP | AVR | MVP | MVR | CABG | Cases | 30-day mortality | Hospital mortality | ||||||
| Hospital | After discharge | Hospital | After discharge | Hospital | After discharge | Hospital | After discharge | Hospital | After discharge | ||||||||||||||||
| 1. Ascending Ao. | 2,447 | 190 (7.8) | 2 (0.1) | 232 (9.5) | 3 | 1 (33.3) | 0 | 1 (33.3) | 222 | 5 (2.3) | 0 | 6 (2.7) | 8 | 1 (12.5) | 0 | 1 (12.5) | 240 | 134 | 17 | 10 | 125 | 49 | 8 (16.3) | 0 | 8 (16.3) |
| 2. Aortic Root | 149 | 28 (18.8) | 0 | 33 (22.1) | 0 | 0 | 0 | 0 | 68 | 7 (10.3) | 0 | 9 (13.2) | 4 | 0 | 0 | 0 | 21 | 118 | 5 | 1 | 42 | 48 | 9 (18.8) | 0 | 11 (22.9) |
| 3. Ascending Ao.+Arch | 1,340 | 116 (8.7) | 2 (0.15) | 150 (11.2) | 16 | 3 (18.8) | 0 | 3 (18.8) | 302 | 8 (2.6) | 1 (0.3) | 18 (6.0) | 107 | 4 (3.7) | 0 | 9 (8.4) | 112 | 61 | 10 | 3 | 87 | 90 | 4 (4.4) | 0 | 5 (5.6) |
| 4. Arch+Descending Ao. | 30 | 4 (13.3) | 0 | 4 (13.3) | 10 | 4 (40.0) | 0 | 5 (50.0) | 21 | 1 (4.8) | 0 | 1 (4.8) | 79 | 6 (7.6) | 0 | 9 (11.4) | 0 | 1 | 0 | 0 | 5 | 9 | 1 (11.1) | 0 | 2 (22.2) |
| 5. Aortic Root+Asc. Ao.+Arch | 96 | 21 (21.9) | 1 (1.0) | 22 (22.9) | 0 | 0 | 0 | 0 | 27 | 0 | 0 | 0 (0.0) | 4 | 0 | 0 | 0 | 18 | 51 | 0 | 1 | 13 | 10 | 0 | 0 | 0 |
| 6. Descending Ao. | 11 | 0 | 0 | 1 (9.1) | 52 | 8 (15.4) | 0 | 11 (21.2) | 77 | 4 (5.2) | 0 | 6 (7.8) | 217 | 8 (3.7) | 0 | 14 (6.5) | 1 | 4 | 0 | 0 | 4 | 38 | 6 (15.8) | 0 | 7 (18.4) |
| 7. Thoracoabdominal Ao. | 5 | 0 | 0 | 0 | 12 | 1 (8.3) | 0 | 2 (16.7) | 49 | 3 (6.1) | 0 | 3 (6.1) | 151 | 13 (8.6) | 0 | 16 (10.6) | 0 | 0 | 0 | 0 | 0 | 43 | 4 (9.3) | 0 | 4 (9.3) |
| 8. Extra-anatomical bypass | 11 | 0 | 0 | 1 (9.1) | 19 | 1 (5.3) | 0 | 2 (10.5) | 4 | 0 | 0 | 0 (0.0) | 1 | 0 | 0 | 0 | 0 | 0 | 0 | 0 | 0 | 0 | 0 | 0 | 0 |
| 9. Stent graft*a | 97 | 1 (1.0) | 0 | 1 (1.0) | 120 | 6 (5.0) | 0 | 8 (6.7) | 100 | 3 (3.0) | 0 | 5 (5.0) | 518 | 8 (1.5) | 0 | 15 (2.9) | 5 | 3 | 0 | 0 | 5 | 99 | 2 (2.0) | 0 | 3 (3.0) |
| 1) TEVARl*b | 35 | 1 (2.9) | 0 | 1 (2.9) | 110 | 6 (5.5) | 0 | 8 (7.3) | 86 | 3 (3.5) | 0 | 5 (5.8) | 492 | 7 (1.4) | 0 | 13 (2.6) | 2 | 0 | 0 | 0 | 0 | 97 | 2 (2.1) | 0 | 3 (3.1) |
| 2) Open stent | 62 | 0 | 0 | 0 | 10 | 0 | 0 | 0 | 14 | 0 | 0 | 0 | 23 | 1 (4.3) | 0 | 2 (8.7) | 3 | 3 | 0 | 0 | 5 | 2 | 0 | 0 | 0 |
| a) With total arch*c | 3 | 0 | 0 | 0 | 4 | 0 | 0 | 0 | 1 | 0 | 0 | 0 | 4 | 0 | 0 | 0 | 1 | 0 | 0 | 0 | 0 | 1 | 0 | 0 | 0 |
| b) Without total arch*d | 59 | 0 | 0 | 0 | 6 | 0 | 0 | 0 | 13 | 0 | 0 | 0 | 19 | 1 (5.3) | 0 | 2 (10.5) | 2 | 3 | 0 | 0 | 5 | 1 | 0 | 0 | 0 |
| 3) Unspecified | 0 | 0 | 0 | 0 | 0 | 0 | 0 | 0 | 0 | 0 | 0 | 0 | 3 | 0 | 0 | 0 | 0 | 0 | 0 | 0 | 0 | 0 | 0 | 0 | 0 |
| Total | 4,186 | 360 | 5 (0.12) | 444 (10.6) | 232 | 24 (10.3) | 0 | 30 (12.9) | 865 | 36 (4.2) | 1 (0.1) | 52 (6.0) | 983 | 34 (3.5) | 0 | 42 (4.3) | 339 | 326 | 32 | 16 | 294 | 335 | 29 (8.7) | 0 | 35 (10.4) |
Values in parenthesis represent mortality %
Ao aorta, AVP aortic valve repair, AVR aortic valve replacement, MVP mitral valve repair, MVR mitral valve replacement, CABG. coronary artery bypass grafting, TEVAR thoracic endovascular aortic(aneurysm) repair
Acute, within 2 weeks from the onset
*a = *b + *c + *d + unspecified
(2) Non-dissection (total; 8,678)
| Replaced site | Unruptured | Ruptured | Concomitant operation | Redo | CPB(−) | ||||||||||||||||
|---|---|---|---|---|---|---|---|---|---|---|---|---|---|---|---|---|---|---|---|---|---|
| Cases | 30-day mortality | Hospital mortality | Cases | 30-day mortality | Hospital mortality | AVP | AVR | MVP | MVR | CABG | Cases | 30-day mortality | Hospital mortality | Cases | 30-day mortality | Hospital mortality | |||||
| Hospital | After discharge | Hospital | After discharge | Hospital | After discharge | Hospital | After discharge | ||||||||||||||
| 1. Ascending Ao. | 1,184 | 19 (1.6) | 1 (0.1) | 38 (3.2) | 50 | 7 (12.9) | 0 | 10 (20.0) | 111 | 755 | 66 | 35 | 159 | 88 | 3 (3.4) | 0 | 11 (12.5) | 5 | 0 | 0 | 1 (20.0) |
| 2. Aortic Root | 824 | 16 (1.9) | 0 | 29 (3.5) | 31 | 4 (30.8) | 0 | 9 (29.0) | 187 | 448 | 47 | 9 | 89 | 109 | 13 (11.9) | 0 | 24 (22.0) | 14 | 0 | 0 | 0 |
| 3. Ascending Ao.+Arch | 2,106 | 47 (2.2) | 3 | 87 (4.1) | 168 | 32 (14.8) | 0 | 44 (26.2) | 26 | 202 | 28 | 2 | 338 | 89 | 8 (9.0) | 0 | 11 (12.4) | 29 | 0 | 0 | 1 (3.4) |
| 4. Arch+Descending Ao. | 111 | 10 (9.0) | 0 | 13 (11.7) | 7 | 2 (34.3) | 0 | 2 (28.6) | 0 | 2 | 0 | 0 | 8 | 9 | 3 (33.3) | 0 | 3 (33.3) | 9 | 0 | 0 | 0 |
| 5. Aortic Root+Asc.Ao.+Arch | 93 | 5 (5.4) | 0 | 9 (9.7) | 2 | 1 (50.0) | 0 | 1 (50.0) | 12 | 47 | 3 | 1 | 9 | 18 | 3 (16.7) | 0 | 4 (22.2) | 3 | 0 | 0 | 0 |
| 6. Descending Ao. | 323 | 15 (4.6) | 0 | 23 (7.1) | 85 | 18 (19.7) | 0 | 21 (24.7) | 4 | 1 | 0 | 0 | 10 | 33 | 13 (39.4) | 0 | 14 (42.4) | 15 | 0 | 0 | 0 |
| 7. Thoracoabdominal Ao. | 368 | 23 (6.3) | 0 | 33 (9.0) | 43 | 8 (24.3) | 0 | 10 (23.3) | 0 | 0 | 0 | 0 | 4 | 40 | 4 (10.0) | 0 | 5 (12.5) | 15 | 0 | 0 | 0 |
| 8. Extra-anatomical bypass | 44 | 2 (4.5) | 0 | 3 (6.8) | 3 | 2 (66.7) | 0 | 2 (66.7) | 0 | 0 | 0 | 0 | 4 | 1 | 0 | 0 | 0 | 9 | 1 (11.1) | 0 | 2 (22.2) |
| 9. Stent graft*a | 2,889 | 56 (1.9) | 1 (0.03) | 80 (2.8) | 347 | 40 (12.9) | 1 (0.3) | 56 (16.1) | 6 | 8 | 0 | 0 | 20 | 193 | 10 (5.2) | 0 | 14 (7.3) | 1,212 | 37 (3.1) | 0 | 50 (4.1) |
| 1) TEVARl*b | 2,671 | 47 (1.8) | 1 (0.04) | 66 (2.5) | 335 | 40 (13.7) | 1 (0.3) | 54 (16.1) | 6 | 2 | 0 | 0 | 8 | 184 | 10 (5.4) | 0 | 14 (7.6) | 1,152 | 37 (3.2) | 0 | 48 (4.2) |
| 2) Open stent | 216 | 9 (4.2) | 0 | 14 (6.5) | 10 | 0 | 0 | 2 (20.0) | 0 | 6 | 0 | 0 | 12 | 9 | 1 (11.1) | 0 | 0 | 56 | 0 | 0 | 2 (3.6) |
| a) With total arch*c | 78 | 5 (6.4) | 0 | 7 (9.0) | 4 | 0 | 0 | 0 | 0 | 0 | 0 | 0 | 3 | 4 | 0 | 0 | 0 | 31 | 0 | 0 | 1 (3.2) |
| b) Without total arch*d | 138 | 4 (2.9) | 0 | 7 (5.1) | 6 | 0 | 0 | 2 (33.3) | 0 | 6 | 0 | 0 | 9 | 5 | 0 | 0 | 0 | 25 | 0 | 0 | 1 (4.0) |
| 3) Unspecified | 2 | 0 | 0 | 2 | 0 | 0 | 0 | 0 | 0 | 0 | 0 | 0 | 0 | 0 | 0 | 0 | 0 | 0 | 0 | 0 | |
| Total | 7,942 | 193 (2.4) | 5 (0.06) | 315 (4.0) | 736 | 114 (15.5) | 1 (0.1) | 155 (22.2) | 346 | 1,463 | 144 | 47 | 641 | 580 | 57 (9.8) | 0 | 86 (14.8) | 1,311 | 38 (3.0) | 0 | 54 (4.1) |
Values in parenthesis represent mortality %
Ao aorta, AVP aortic valve repair, AVR aortic valve replacement, MVP mitral valve repair, MVR mitral valve replacement, CABG coronary artery bypass grafting, TEVAR thoracic endovascular aortic (aneurysm) repair
*a = *b + *c + *d + unspecified
Table 4 Pulmonary thromboembolism (total; 121)
| Cases | 30-day mortality | Hospital mortality | ||
|---|---|---|---|---|
| Hospital | After discharge | |||
| Acute | 65 | 11 (16.9) | 0 | 13 (20.0) |
| Chronic | 56 | 0 | 0 | 1 (1.8) |
| Total | 121 | 11 (9.1) | 0 | 14 (11.6) |
Values in parenthesis represent mortality %
Table 5 Assisted circulation (total; 1,875)
| Sites | VAD | Heart–Lung assist | |||||||||||||
|---|---|---|---|---|---|---|---|---|---|---|---|---|---|---|---|
| Device | Results | Method | Results | ||||||||||||
| Centrifugal | VAS | Others | Not weaned | Weaned | PCPS | Others | Not weaned | Weaned | |||||||
| On going | Death | Transplant | Alive | Deaths | Transplant | Deaths | Transplant | Deaths | Alive | ||||||
| Post-cardiotomy | |||||||||||||||
| Left | 4 | 6 | 3 | 2 | 10 (76.9) | 0 | 0 | 1 (10.0) | 0 | ||||||
| Right | 3 | 0 | 0 | 0 | 1 (33.3) | 0 | 2 | 0 | 0 | ||||||
| Biventricle | |||||||||||||||
| Right | 6 | 1 | 0 | 2 | 5 (71.4) | 0 | 0 | 0 | 0 | 517 | 70 | 268 (51.8) | 0 | 99 (19.1) | 220 |
| Left | 2 | 5 | 0 | ||||||||||||
| Congestive heart failure | |||||||||||||||
| Left | 23 | 38 | 57 | 70 | 32 (27.1) | 0 | 8 | 5 (4.2) | 3 | ||||||
| Right | 0 | 0 | 0 | 0 | 0 | 0 | 0 | 0 | 0 | ||||||
| Biventricle | |||||||||||||||
| Right | 23 | 6 | 0 | 5 | 18 (62.1) | 0 | 5 | 1 (9.1) | 0 | 888 | 68 | 439 (49.4) | 1 | 139 (15.7) | 376 |
| Left | 8 | 19 | 2 | ||||||||||||
| Respiratory failure | 75 | 51 | 40 (53.3) | 0 | 15 (20.0) | 71 | |||||||||
| Total | 69 | 75 | 62 | 79 | 66 (32.0) | 0 | 15 | 7 (3.4) | 3 | 1,480 | 189 | 747 (50.4) | 2 | 253 (17.1) | 667 |
Values in parenthesis represent mortality %
VAD ventricular assist device, VAS ventricular assist system, PCPS percutaneous cardiopulmonary support
Table 6 Heart transplantation (total; 28)
| Cases | 30-day mortality | Hospital mortality | ||
|---|---|---|---|---|
| Hospital | After discharge | |||
| Heart transplantation | 28 | 1 (3.6) | 0 | 2 (7.1) |
| Heart and lung transplantation | 0 | 0 | 0 | 0 |
| Total | 28 | 1 (3.6) | 0 | 2 (7.1) |
Values in parenthesis represent mortality %
Table 7 Pacemaker + ICD (total; 6,971)
| Pacemaker | ICD | ||||
|---|---|---|---|---|---|
| V | A-V | CRT | CRTD | ICD | |
| Initial | 942 | 2,715 | 117 | 299 | 342 |
| Exchange | 727 | 1,439 | 32 | 113 | 197 |
| Unclear | 2 | 46 | 0 | 0 | 0 |
| Total | 1,671 | 4,200 | 149 | 412 | 539 |
ICD implantable cardioverter-defibrillator, CRTD cardiac resynchronization therapy device with incorporated ICD device
(B) General thoracic surgery
The total number of operations reported in 2012 in general thoracic surgery has reached 72,899, which means an increase of 3,676 cases compared with the number of operations in 2011. This is largely owing to the steady increase in lung cancer surgery (31,301; 2009, 32,801; 2010, 33,878:2011, 35,667:2012).
Surgery for lung cancer consists more than 49 % of all the general thoracic surgery. Among lung cancer subtypes, adenocarcinoma comprises an overwhelming percentage of 69.4 % of the total lung cancer surgery, followed by squamous cell carcinoma of 19.0 %. Limited resection by wedge resection or segmentectomy was performed in 6,789 lung cancer patients, which is 19.0 % of the entire cases. Lobectomy was performed 26,079 patients, which is 73.1 % of the entire cases. Sleeve lobectomy was done in 429 patients. Pneumonectomy was done in 571 patients, which is only 1.6 % of the entire cases. VATS (video-assisted thoracic surgery) procedure is performed in 65.6 % among the total lung cancer surgeries in 2012. 123 patients died within 30 days after lung cancer surgery (30-day mortality rate 0.34 %), and 248 patients died without discharge (Hospital mortality rate 0.70 %). 30-day mortality rate in regard to procedures is 0.26 % in segmentectomy, 0.31 % in lobectomy, and 2.45 % in pneumonectomy.
Interstitial pneumonia was the leading cause of death after lung cancer surgery, followed by pneumonia, cardiovascular event, bronchopleural fistula, and respiratory failure.
7,403 patients with metastatic pulmonary tumor were operated in 2012 with steady increase similar to lung cancer surgery (6,248:2009, 6,748:2010, 7,210:2011). VATS was adopted in 5,828 cases, which comprises 78.7 % of the entire cases. Colorectal cancer was by far the leading primary malignancy indicated for resection of metastatic tumors.
73 tracheal tumors were operated in 2012. Adenoid cystic carcinoma and squamous cell carcinoma were frequent primary tracheal tumor.
409 tumors of pleural origin were operated in 2012. Diffuse malignant pleural mesothelioma was the most frequent histology. Extrapleural pneumonectomy was the most frequently chosen operative method (135 cases) with a hospital death of 6.7 %.
752 chest wall tumors were resected in 2012.
4,671 mediastinal tumors were operated in 2012. There were 2,151 thymic epithelial tumors (1,842 thymomas, 271 thymic carcinomas, and 38 thymic carcinoid), followed by 906 congenital cysts, 495 neurogenic tumors, and 231 germ cell tumors. 2,425 cases (51.9 %) were resected by VATS.
Thymectomy for myasthenia gravis was done in 446 patients, and 302 among them were associated with thymoma, indicating that thymectomy for non-thymomatous myasthenia gravis was done only in 144 patients. Advancement in medical control of myasthenia gravis by immunosuppressants might reduce indication of extended thymectomy for non-thymomatous myasthenia gravis. This possibility should be further examined.
2,250 operations for empyema were reported in 2012. There were 1,710 patients (76 %) with acute empyema and 540 patients with chronic empyema. Bronchopleural fistula was associated in 348 patients (20.4 %) with acute empyema and 274 patients (50.7 %) with chronic empyema. It should be noted that hospital mortality was as high as 12.1 % in patients of acute empyema with fistula.
14,410 operations for pneumothorax were reported in 2012. 13,555 operations (94.1 %) were performed by VATS, similarly to cases in 2011.
44 lung transplantations were reported in 2012. The number of the brain-dead donors is slightly increasing after revision of the law on organ transplantation.
The number of lung transplantation operation is still small compared to those in North America and European countries because of shortage of donors, but the number of brain-dead donors is increasing slowly in Japan after revision of the law of organ transplantation in 2010.
Table 1 Total entry cases of general thoracic surgery during 2012
| Cases | % | |
|---|---|---|
| Benign pulmonary tumor | 863 | 1.2 |
| Primary lung cancer | 35,667 | 48.9 |
| Other primary malignant pulmonary tumor | 348 | 0.5 |
| Metastatic pulmonary tumor | 7,403 | 10.2 |
| Tracheal tumor | 73 | 0.1 |
| Mesothelioma | 409 | 0.6 |
| Chest wall tumor | 752 | 1.0 |
| Mediastinal tumor | 4,671 | 6.4 |
| Thymectomy for MG without thymoma | 302 | 0.4 |
| Inflammatory pulmonary disease | 3,405 | 4.7 |
| Empyema | 2,250 | 3.1 |
| Bullous disease excluding pneumothorax | 569 | 0.8 |
| Pneumothorax | 14,410 | 19.8 |
| Chest wall deformity | 415 | 0.6 |
| Diaphragmatic hernia including traumatic | 112 | 0.2 |
| Chest trauma excluding diaphragmatic hernia | 393 | 0.5 |
| Lung transplantation | 44 | 0.1 |
| Others | 813 | 1.1 |
| Total | 72,899 | 100.0 |
Table 2
1. Benign pulmonary tumor
| Cases | 30-day mortality | Hospital mortality | By VATS | ||
|---|---|---|---|---|---|
| Hospital | After discharge | ||||
| Hamartoma | 421 | 0 | 0 | 0 | 371 |
| Sclerosing hemangioma | 104 | 0 | 0 | 0 | 84 |
| Papilloma | 9 | 0 | 0 | 0 | 7 |
| Mucous gland adenoma bronchial | 5 | 0 | 0 | 0 | 5 |
| Fibroma | 34 | 0 | 0 | 0 | 26 |
| Lipoma | 5 | 0 | 0 | 0 | 4 |
| Neurogenic tumor | 13 | 0 | 0 | 0 | 10 |
| Clear cell tumor | 1 | 0 | 0 | 0 | 1 |
| Leiomyoma | 13 | 0 | 0 | 0 | 8 |
| Chondroma | 3 | 0 | 0 | 0 | 3 |
| Inflammatory myofibroblastic tumor | 3 | 0 | 0 | 0 | 2 |
| Pseudolymphoma | 23 | 0 | 0 | 0 | 17 |
| Histiocytosis | 11 | 0 | 0 | 0 | 8 |
| Teratoma | 4 | 0 | 0 | 0 | 2 |
| Others | 214 | 0 | 0 | 0 | 171 |
| Total | 863 | 0 | 0 | 0 | 719 |
Values in parenthesis represent mortality %
Table 3
2. Primary malignant pulmonary tumor
| Cases | 30-day mortality | Hospital mortality | By VATS | |||||||
|---|---|---|---|---|---|---|---|---|---|---|
| Hospital | After discharge | |||||||||
| 2. Primary malignant pulmonary tumor | 36,015 | 103 (0.3) | 15 (0.04) | 243 (0.7) | ||||||
| Lung cancer | 35,667 | 112 (0.3) | 11 (0.03) | 248 (0.7) | 23,411 | |||||
| Adenocarcinoma | 24,749 | 48 (0.2) | 5 (0.02) | 84 (0.3) | ||||||
| Squamous cell carcinoma | 7,114 | 47 (0.7) | 4 (0.06) | 122 (1.7) | ||||||
| Large cell carcinoma | 917 | 3 (0.3) | 0 | 14 (1.5) | ||||||
| (LCNEC) | 471 | 2 (0.4) | 0 | 6 (1.3) | ||||||
| Small cell carcinoma | 591 | 2 (0.3) | 0 | 3 (0.5) | ||||||
| Adenosquamous carcinoma | 612 | 6 (1.0) | 1 | 11 (1.8) | ||||||
| Carcinoma with pleomorphic, sarcomatoid or sarcomatous elements | 473 | 2 (0.4) | 1 | 6 (1.3) | ||||||
| Carcinoid | 195 | 0 | 1 (0.5) | 0 | ||||||
| Carcinomas of salivary gland type | 29 | 0 | 0 | 0 | ||||||
| Unclassified | 73 | 0 | 0 | 0 | ||||||
| Multiple lung cancer | 803 | 1 (0.1) | 0 | 4 (0.5) | ||||||
| Others | 110 | 3 (2.7) | 0 | 4 (3.6) | ||||||
| Unclear | 1 | 0 | ||||||||
| Wedge resection | 4,952 | 11 (0.2) | 0 | 18 (0.4) | 4,135 | |||||
| Segmental excision | 3,780 | 8 (0.2) | 2 (0.1) | 10 (0.3) | 2,654 | |||||
| (Sleeve segmental excision) | 16 | 0 | 0 | 0 | 4 | |||||
| Lobectomy | 26,079 | 72 (0.3) | 9 (0.03) | 178 (0.7) | 16,416 | |||||
| (Sleeve lobectomy) | 429 | 4 (0.9) | 1 (0.2) | 7 (1.6) | 29 | |||||
| Pneumonectomy | 571 | 14 (2.5) | 0 | 30 (5.3) | 75 | |||||
| (Sleeve pneumonectomy) | 16 | 0 | 0 | 0 | 0 | |||||
| Other bronchoplasty | 10 | 0 | 0 | 0 | 3 | |||||
| Pleuropneumonectomy | 4 | 0 | 0 | 0 | 1 | |||||
| Others | 265 | 3 (1.1) | 0 | 5 (1.9) | 127 | |||||
| Unclear | 11 | 4 (36.4) | 7 (63.6) | |||||||
| Sarcoma | 36 | 0 | 0 | 1 (2.8) | ||||||
| AAH | 143 | 0 | 0 | 1 (0.7) | ||||||
| Others | 169 | 0 | 0 | 2 (1.2) | ||||||
Values in parenthesis represent mortality %
Table 4 Details of lung cancer operation
TNM
| Cases | |
|---|---|
| c-Stage | |
| Ia | 20,510 |
| Ib | 7,019 |
| IIa | 2,712 |
| IIb | 1,783 |
| IIIa | 2,493 |
| IIIb | 256 |
| IV | 414 |
| NA | 480 |
| Total | 35,667 |
| Sex | |
| Male | 22,103 |
| Female | 13,426 |
| NA | 138 |
| Total | 35,667 |
| Cause of death | |
| Cardiovascular | 25 |
| Pneumonia | 52 |
| Pyothorax | 8 |
| Bronchopleural fistula | 25 |
| Respiratory failure | 25 |
| Pulmonary embolism | 3 |
| Interstitial pneumonia | 71 |
| Brain infarction or bleeding | 15 |
| Others | 32 |
| Unknown | 3 |
| Total | 259 |
| p-Stage | |
| 0 (pCR) | 157 |
| Ia | 17,804 |
| Ib | 7,264 |
| IIa | 3,011 |
| IIb | 2,093 |
| IIIa | 3,806 |
| IIIb | 306 |
| IV | 943 |
| NA | 283 |
| Total | 35,667 |
| Age | |
| <20 | 4 |
| 20–29 | 22 |
| 30–39 | 223 |
| 40–49 | 1,001 |
| 50–59 | 3,630 |
| 60–69 | 12,336 |
| 70–79 | 14,299 |
| 80–89 | 4,100 |
| ≥90 | 50 |
| NA | 2 |
| Total | 35,667 |
Table 5
3. Metastatic pulmonary tumor
| Cases | 30-day mortality | Hospital mortality | By VATS | |||||
|---|---|---|---|---|---|---|---|---|
| Hospital | After discharge | |||||||
| 3. Metastatic pulmonary tumor | 7,403 | 3 (0.04) | 0 | 9 (0.1) | 5,828 | |||
| Colorectal | 3,639 | 0 | 0 | 3 (0.1) | 2,910 | |||
| Hepatobiliary/Pancreatic | 311 | 0 | 0 | 1 (0.3) | 240 | |||
| Uterine | 380 | 1 (0.26) | 0 | 0 | 302 | |||
| Mammary | 456 | 0 | 0 | 1 (0.2) | 386 | |||
| Ovarian | 68 | 0 | 0 | 0 | 56 | |||
| Testicular | 64 | 0 | 0 | 0 | 49 | |||
| Renal | 600 | 0 | 0 | 0 | 500 | |||
| Skeletal | 160 | 0 | 0 | 0 | 121 | |||
| Soft tissue | 275 | 0 | 0 | 0 | 214 | |||
| Otorhinolaryngological | 446 | 0 | 0 | 0 | 338 | |||
| Pulmonary | 384 | 3 (0.8) | 0 | 3 (0.8) | 238 | |||
| Others | 620 | 1 | 0 | 1 (0.2) | 474 | |||
Values in parenthesis represent mortality %
Table 6
4. Tracheal tumor
| Cases | 30-day mortality | Hospital mortality | ||
|---|---|---|---|---|
| Hospital | After discharge | |||
| 4. Tracheal tumor | 73 | 0 | 0 | 1 (1.4) |
| (A) Primary malignant tumor (histological classification) | ||||
| Squamous cell carcinoma | 4 | 0 | 0 | 0 |
| Adenoid cystic carcinoma | 19 | 0 | 0 | 0 |
| Mucoepidermoid carcinoma | 1 | 0 | 0 | 0 |
| Others | 1 | 0 | 0 | 0 |
| Total | 25 | 0 | 0 | 0 |
| (B) Metastatic/invasive malignant tumor e.g. invasion of thyroid cancer | 23 | 0 | 0 | 1 (4.3) |
| (C) Benign tracheal tumor (histological classification) | ||||
| Papilloma | 1 | 0 | 0 | 0 |
| Adenoma | 2 | 0 | 0 | 0 |
| Neurofibroma | 2 | 0 | 0 | 0 |
| Chondroma | 1 | 0 | 0 | 0 |
| Leiomyoma | 0 | 0 | 0 | 0 |
| Others | 19 | 0 | 0 | 0 |
| Histology unknown | 0 | 0 | 0 | 0 |
| Total | 25 | 0 | 0 | 0 |
| Operation | ||||
| Sleeve resection with reconstruction | 28 | 0 | 0 | 0 |
| Wedge with simple closure | 4 | 0 | 0 | 0 |
| Wedge with patch closure | 0 | 0 | 0 | 0 |
| Total laryngectomy with tracheostomy | 2 | 0 | 0 | 1 (50.0) |
| Others | 38 | 0 | 0 | 0 |
| Unknown | 1 | 0 | 0 | 0 |
| Total | 73 | 0 | 0 | 1 (1.4) |
Values in parenthesis represent mortality %
Table 7
5. Tumor of pleural origin
| Cases | 30-day mortality | Hospital mortality | ||
|---|---|---|---|---|
| Hospital | After discharge | |||
| Histological classification | ||||
| Solitary fibrous tumor | 130 | 0 | 0 | 0 |
| Diffuse malignant pleural mesothelioma | 198 | 5 (2.5) | 0 | 9 (4.5) |
| Localized malignant pleural mesothelioma | 29 | 0 | 0 | 1 |
| Others | 52 | 0 | 0 | 0 |
| Total | 409 | 3 (0.7) | 0 | 10 (2.4) |
| Operative procedure | ||||
| Extrapleural pneumonectomy | 135 | 5 (3.7) | 0 | 9 (6.7) |
| Total pleurectomy | 22 | 0 | 0 | 0 |
| Total parietal pleurectomy | 0 | 0 | 0 | 0 |
| Partial pleurectomy | 0 | 0 | 0 | 0 |
| Exploratory thoracotomy | 0 | 0 | 0 | 0 |
| Others | 41 | 0 (0.0) | 0 | 0 |
| Total | 198 | 5 (2.5) | 0 | 9 (4.5) |
Values in parenthesis represent mortality %
Table 8
6. Chest wall tumor
| Cases | 30-day mortality | Hospital mortality | By VATS | ||
|---|---|---|---|---|---|
| Hospital | After discharge | ||||
| Primary malignant tumor | 147 | 1 (0.68) | 0 | 1 (0.7) | 26 |
| Metastatic malignant tumor | 232 | 0 | 0 | 2 (0.9) | 34 |
| Benign tumor | 373 | 0 | 0 | 0 | 199 |
| Total | 752 | 1 (0.1) | 0 | 3 (0.4) | 259 |
Values in parenthesis represent mortality %
Table 9
7. Mediastinal tumor
| Cases | 30-day mortality | Hospital mortality | By VATS | ||
|---|---|---|---|---|---|
| Hospital | After discharge | ||||
| 7. Mediastinal tumor | 4,671 | 6 (0.13) | 0 | 7 (0.1) | 2,425 |
| Thymoma* | 1,842 | 2 (0.1) | 0 | 2 (0.1) | 659 |
| Thymic cancer | 271 | 2 (0.7) | 0 | 3 (1.1) | 56 |
| Thymus carcinoid | 38 | 0 | 0 | 0 | 15 |
| Germ cell tumor | 231 | 1 (0.4) | 0 | 1 (0.4) | 80 |
| Benign | 159 | 0 | 0 | 0 | 72 |
| Malignant | 72 | 1 (1.4) | 0 | 1 (1.4) | 8 |
| Neurogenic tumor | 495 | 0 | 0 | 0 | 412 |
| Congenital cyst | 906 | 0 | 0 | 0 | 759 |
| Goiter | 115 | 0 | 0 | 0 | 28 |
| Lymphatic tumor | 210 | 1 (0.5) | 0 | 1 (0.5) | 124 |
| Excision of pleural recurrence of thymoma | 93 | 0 | 0 | 0 | 35 |
| Others | 470 | 0 | 0 | 0 | 257 |
* Includes those with myasthenia gravis
Values in parenthesis represent mortality %
Table 10
8. Thymectomy for myasthenia gravis
| Cases | 30-day mortality | Hospital mortality | By VATS | ||
|---|---|---|---|---|---|
| Hospital | After discharge | ||||
| 8. Thymectomy for myasthenia gravis | 446 | 0 | 0 | 0 | 171 |
| With thymoma | 302 | 1 (0.3) | 0 | 2 (0.7) | 81 |
Values in parenthesis represent mortality %
Table 11
9. Operation for non-neoplasmic disease
(A) Inflammatory pulmonary disease
| Cases | 30-day mortality | Hospital mortality | |||
|---|---|---|---|---|---|
| Hospital | After discharge | ||||
| 9. Operation for non-neoplasmic disease | 22,367 | 109 (0.5) | 2 (0.01) | 181 (0.8) | |
| Cases | 30-day mortality | Hospital mortality | By VATS | ||
|---|---|---|---|---|---|
| Hospital | After discharge | ||||
| (A) Inflammatory pulmonary disease | 3,405 | 4 (0.1) | 0 | 7 (0.2) | 2,556 |
| Tuberculous infection | 107 | 0 | 0 | 0 | 70 |
| Mycobacterial infection | 514 | 0 | 0 | 0 | 395 |
| Fungal infection | 439 | 4 (0.9) | 0 | 5 (1.1) | 218 |
| Bronchiectasis | 93 | 0 | 0 | 0 | 60 |
| Tuberculous nodule | 351 | 0 | 0 | 0 | 291 |
| Inflammatory pseudo tumor | 1,007 | 0 | 0 | 0 | 812 |
| Intrapulmonary lymph node | 175 | 0 | 0 | 0 | 161 |
| Others | 719 | 0 | 0 | 2 (0.3) | 549 |
Values in parenthesis represent mortality %
Table 12
9. Operation for non-neoplasmic disease
(B) Empyema
| Cases | 30-day mortality | Hospital mortality | By VATS | ||
|---|---|---|---|---|---|
| Hospital | After discharge | ||||
| Acute empyema | 1,710 | 29 (1.7) | 0 | 61 (3.6) | 1,142 |
| With fistula | 348 | 15 (4.3) | 0 | 42 (12.1) | 97 |
| Without fistula | 1,349 | 13 (1.0) | 0 | 18 (1.3) | 1,037 |
| Unknown | 13 | 1 (7.7) | 0 | 1 (7.7) | 8 |
| Chronic empyema | 540 | 5 (0.9) | 0 | 15 (2.8) | 133 |
| With fistula | 274 | 4 (1.5) | 0 | 10 (3.6) | 44 |
| Without fistula | 263 | 1 (0.4) | 0 | 5 (1.9) | 87 |
| Unknown | 3 | 0 | 0 | 0 | 2 |
| Total | 2,250 | 34 (1.5) | 0 | 76 (3.4) | 1,275 |
Values in parenthesis represent mortality %
Table 13
9. Operation for non-neoplasmic disease
(C) Descending necrotizing mediastinitis
| Cases | 30-day mortality | Hospital mortality | By VATS | ||
|---|---|---|---|---|---|
| Hospital | After discharge | ||||
| (C) Descending necrotizing mediastinitis | 92 | 6 (6.5) | 0 | 7 (7.6) | 50 |
Values in parenthesis represent mortality %
Table 14
9. Operation for non-neoplasmic disease
(D) Bullous disease
| Cases | 30-day mortality | Hospital mortality | By VATS | ||
|---|---|---|---|---|---|
| Hospital | After discharge | ||||
| (D) Bullous disease | 569 | 0 | 0 | 2 (0.4) | 443 |
| Emphysematous bulla | 438 | 0 | 0 | 2 (0.5) | 355 |
| Bronchogenic cyst | 74 | 0 | 0 | 0 | 58 |
| Emphysema with volume reduction surgery | 22 | 0 | 0 | 0 | 16 |
| Others | 35 | 0 | 0 | 0 | 14 |
Values in parenthesis represent mortality %
LVRS lung volume reduction surgery
Table 15
9. Operation for non-neoplasmic disease
(E) Pneumothorax
| Cases | 30-day mortality | Hospital mortality | By VATS | ||
|---|---|---|---|---|---|
| Hospital | After discharge | ||||
| (E) Pneumothorax | 14,410 | 37 (0.3) | 1 (0.01) | 53 (0.4) | 13,555 |
| Spontaneous pneumothorax | |||||
| Operative procedure | |||||
| Bullectomy | 3,588 | 3 (0.08) | 0 | 3 (0.08) | 3,400 |
| Bullectomy with additional procedure | 7,751 | 1 (0.01) | 0 | 1 (0.01) | 7,456 |
| Coverage with artificial material | 7,374 | 1 (0.01) | 0 | 1 (0.01) | 7,088 |
| Parietal pleurectomy | 34 | 0 | 0 | 0 | 33 |
| Coverage and parietal pleurectomy | 85 | 0 | 0 | 0 | 81 |
| Others | 258 | 0 | 0 | 0 | 254 |
| Others | 475 | 3 (0.6) | 0 | 0 | 432 |
| Total | 11,814 | 7 (0.1) | 0 | 4 (0.0) | 11,288 |
| Secondary pneumothorax | |||||
| Associated disease | |||||
| COPD | 1,977 | 19 (1.0) | 1 (0.1) | 25 (1.3) | 1,748 |
| Tumorous disease | 92 | 3 (3.3) | 0 | 6 (6.5) | 75 |
| Catamenial | 153 | 0 | 0 | 0 | 152 |
| LAM | 38 | 2 (5.26) | 0 | 2 | 33 |
| Others (excluding pneumothorax by trauma) | 333 | 9 (2.7) | 0 | 16 (4.8) | 258 |
| Unknown | 3 | 1 | |||
| Operative procedure | |||||
| Bullectomy | 28 | 5 (17.9) | 0 | 8 (28.6) | 344 |
| Bullectomy with additional procedure | 1,881 | 19 (1.0) | 1 | 29 (1.5) | 1,656 |
| Coverage with artificial material | 1,707 | 14 (0.8) | 1 (0.06) | 23 (1.3) | 1,506 |
| Parietal pleurectomy | 21 | 0 | 0 | 0 | 20 |
| Coverage and parietal pleurectomy | 16 | 1 (6.3) | 0 | 1 (6.3) | 13 |
| Others | 137 | 4 (2.9) | 0 | 5 (3.6) | 117 |
| Others | 330 | 9 (2.7) | 0 | 12 (3.6) | 264 |
| Unknown | 4 | 0 | 0 | 0 | 3 |
| Total | 2,243 | 33 (1.5) | 1 (0.04) | 49 (2.2) | 2,267 |
Values in parenthesis represent mortality %
Table 16
9. Operation for non-neoplasmic disease
(F) Chest wall deformity
| Cases | 30-day mortality | Hospital mortality | ||
|---|---|---|---|---|
| Hospital | After discharge | |||
| (F) Chest wall deformity | 415 | 0 | 0 | 0 |
| Funnel chest | 393 | 0 | 0 | 0 |
| Others | 22 | 0 | 0 | 0 |
Values in parenthesis represent mortality %
Table 17
9. Operation for non-neoplasmic disease
(G) Diaphragmatic hernia
| Cases | 30-day mortality | Hospital mortality | By VATS | ||
|---|---|---|---|---|---|
| Hospital | After discharge | ||||
| (G) Diaphragmatic hernia | 112 | 3 (2.7) | 0 | 4 (3.6) | 34 |
| Congenital | 54 | 1 (1.9) | 0 | 2 (3.7) | 11 |
| Traumatic | 38 | 2 (5.3) | 0 | 2 (5.3) | 7 |
| Others | 30 | 0 | 0 | 0 | 16 |
Values in parenthesis represent mortality %
Table 18
9. Operation for non-neoplasmic disease
(H) Chest trauma
| Cases | 30-day mortality | Hospital mortality | By VATS | ||
|---|---|---|---|---|---|
| Hospital | After discharge | ||||
| (H) Chest trauma | 393 | 18 (4.6) | 1 (0.25) | 20 (5.1) | 127 |
Values in parenthesis represent mortality %
Table 19
9. Operation for non-neoplasmic disease
(I) Other respiratory surgery
| Cases | 30-day mortality | Hospital mortality | By VATS | ||
|---|---|---|---|---|---|
| Hospital | After discharge | ||||
| (I) Other respiratory surgery | 727 | 7 (1.0) | 0 | 14 (1.9) | 392 |
| Arteriovenous malformation* | 95 | 1 (1.1) | 0 | 1 (1.1) | 73 |
| Pulmonary sequestration | 126 | 0 | 0 | 0 | 68 |
| Others | 506 | 6 (1.2) | 0 | 13 (2.6) | 251 |
* Includes those with myasthenia gravis
Values in parenthesis represent mortality %
Table 20
10. Lung transplantation
| Cases | 30-day mortality | Hospital mortality | ||
|---|---|---|---|---|
| Hospital | After discharge | |||
| Single lung transplantation from brain-dead donor | 16 | 0 | 0 | 1 (6.3) |
| Bilateral lung transplantation from brain-dead donor | 18 | 0 | 0 | 0 |
| Lung transplantation from living donor | 10 | 0 | 0 | 0 |
| Total of lung transplantation | 44 | 0 | 0 | 1 (2.3) |
| Donor of living donor lung transplantation | 17 | 0 | 0 | 0 |
Values in parenthesis represent mortality %
Table 21
11. Video-assisted thoracic surgery
| Cases | 30-day mortality | Hospital mortality | ||
|---|---|---|---|---|
| Hospital | After discharge | |||
| 11. Video-assisted thoracic surgery | 54,616 | 83 (0.2) | 5 (0.01) | 141 (0.3) |
Values in parenthesis represent mortality %
(Including thoracic sympathectomy 146)
Table 22
12. Tracheobronchoplasty
| Cases | 30-day mortality | Hospital mortality | ||
|---|---|---|---|---|
| Hospital | After discharge | |||
| 12. Tracheobronchoplasty | 554 | 3 (0.5) | 1 (0.2) | 9 (1.6) |
| Trachea | 105 | 0 | 0 | 2 (1.9) |
| Sleeve resection with reconstruction | 58 | 0 | 0 | 0 |
| Wedge with simple closure | 29 | 0 | 0 | 1 |
| Wedge with patch closure | 1 | 0 | 0 | 0 |
| Total laryngectomy with tracheostomy | 2 | 0 | 0 | 1 |
| Others | 15 | 0 | 0 | 0 |
| Cardinal reconstruction | 7 | 0 | 0 | 0 |
| Sleeve pneumonectomy | 16 | 0 | 0 | 1 (6.3) |
| Sleeve lobectomy | 383 | 3 (0.8) | 1 (0.3) | 6 (1.6) |
| Sleeve segmental excision | 12 | 0 | 0 | 0 |
| Bronchoplasty without lung resection | 12 | 0 | 0 | 0 |
| Others | 19 | 0 | 0 | 0 |
Values in parenthesis represent mortality %
Table 23
13. Pediatric surgery
| Cases | 30-day mortality | Hospital mortality | ||
|---|---|---|---|---|
| Hospital | After discharge | |||
| 13. Pediatric surgery | 417 | 1 (0.2) | 0 | 1 (0.2) |
Values in parenthesis represent mortality %
Table 24
14. Combined resection of neighboring organ(s)
| Cases | 30-day mortality | Hospital mortality | ||
|---|---|---|---|---|
| Hospital | After discharge | |||
| 14. Combined resection of neighboring organ(s) | 1,002 | 5 (0.5) | 3 (0.3) | 15 (1.5) |
| (A) Primary lung cancer (organ resected) | ||||
| Aorta | 9 | 1 (11.1) | 0 | 1 (11.1) |
| Superior vena cava | 35 | 0 | 0 | 2 (5.7) |
| Brachycephalic vein | 12 | 1 (8.3) | 0 | 1 (8.3) |
| Pericardium | 171 | 1 (0.6) | 0 | 3 (1.8) |
| Pulmonary artery | 184 | 0 | 0 | 2 (1.1) |
| Left atrium | 33 | 1 (3.0) | 0 | 1 (3.0) |
| Diaphragm | 94 | 0 | 0 | 1 (1.1) |
| Chest wall (including ribs) | 494 | 2 (0.4) | 1 (0.2) | 12 (2.4) |
| Vertebra | 30 | 0 | 0 | 2 (6.7) |
| Esophagus | 7 | 0 | 0 | 0 |
| Total | 1,069 | 6 (0.6) | 1 (0.1) | 25 (2.3) |
| (B) Mediastinal tumor (organ resected) | ||||
| Aorta | 2 | 0 | 0 | 0 |
| Superior vena cava | 55 | 1 (1.8) | 0 | 1 (1.8) |
| Brachycephalic vein | 85 | 0 | 0 | 1 (1.2) |
| Pericardium | 238 | 1 (0.4) | 0 | 1 (0.4) |
| Pulmonary artery | 1 | 0 | 0 | 0 |
| Left atrium | 0 | 0 | 0 | 0 |
| Diaphragm | 24 | 0 | 0 | 0 |
| Chest wall (including ribs) | 16 | 0 | 0 | 0 |
| Vertebra | 6 | 0 | 0 | 0 |
| Esophagus | 3 | 0 | 0 | 0 |
| Lung | 290 | 0 | 0 | 0 |
| Total | 720 | 2 (0.3) | 0 | 3 (0.4) |
Values in parenthesis represent mortality %
Table 25
15. Operation of lung cancer invading the chest wall of the apex
| Cases | 30-day mortality | Hospital mortality | ||
|---|---|---|---|---|
| Hospital | After discharge | |||
| 15. Operation of lung cancer invading the chest wall of the apex | 128 | 0 | 0 | 1 (0.01) |
Values in parenthesis represent mortality %
Includes tumors invading the anterior apical chest wall and posterior apical chest wall (superior sulcus tumor, so-called Pancoast type)
(C) Esophageal surgery
During 2012 alone, a total of 12,315 patients with esophageal diseases were registered from 555 institutions (response rate: 95.4 %), affiliated to the Japanese Association for Thoracic Surgery and/or to the Japan Esophageal Society. Among these institutions, 20 or more patients underwent esophageal surgeries within the year of 2012 in 184 institutions (33.2 %), which shows definite shift of esophageal operations to high volume institutions when compared to the data of 2011 (22.9 %) (Table 1) Of 2,281 patients with a benign esophageal disease, 1,141 (50.0 %) patients underwent surgery, and 30 (1.3 %) patients underwent endoscopic resection, while 1,110 (48.7 %) patients did not undergo any surgical treatment. (Table 2) Of 10,034 patients with a malignant esophageal tumor, 7,859 (78.3 %) patients underwent resection, esophagectomy for 6,055 (60.3 %) and endoscopic mucosal resection (EMR) or endoscopic submucosal dissection (ESD) for 1,804 (18.0 %), while 2,175 (21.6 %) patients did not undergo any resection. (Tables 3, 4) The decrease of registered patients with nonsurgically treated benign esophageal diseases is obvious during 2011 and 2012. The patients registered, particularly those undergoing nonsurgical therapy for a malignant esophageal disease, have been increasing since 1990 (Fig. 1).
Among benign esophageal diseases (Table 2), esophageal varices, hiatal hernia, achalasia and esophagitis (including reflux esophagitis) were the most common conditions in Japan. On the other hand, spontaneous rupture of the esophagus, benign esophageal tumors and congenital esophageal atresia were common diseases which were surgically treated. The thoracoscopic and/or laparoscopic procedures have been widely adopted for benign esophageal diseases, in particular achalasia, hiatal hernia and benign tumors. Open surgery was performed in 828 patients with a benign esophageal disease with 30-day mortality in 5 (0.6 %), while thoracoscopic and/or laparoscopic surgery was performed for 233 patients with 0 (0.0 %) of the 30-day mortality The difference in these death rates between open and scopic surgery seems to be related to the conditions requiring open surgery.
The majority of malignant diseases were carcinomas (Table 3). Among esophageal carcinomas, the incidence of squamous cell carcinoma was 91.8 %, while that of adenocarcinomas including Barrett cancer was 5.7 %. The resection rate for patients with a squamous cell carcinoma was 77.6 %, while that for patients with an adenocarcinoma was 91.5 %.
According to location, cancer in the thoracic esophagus was the most common (Table 4). Of the 3,793 patients (37.8 % of total esophageal malignancies) having superficial esophageal cancers within mucosal and submucosal layers, 1,759 (46.3 %) patients underwent esophagectomy, while 1,802 (47.5 %) patients underwent EMR or ESD. The 30-day mortality rate and hospital mortality rate after esophagectomy for patients with a superficial cancer were 0.6 and 1.5 %, respectively. There was no EMR or ESD-related death. Advanced esophageal cancer invading deeper than the submucosal layer was observed in 6,231 (62.1 %) patients. Of the 6,231 patients with advanced esophageal cancer, 4,288 (68.8 %) underwent esophagectomy, with 0.8 % of the 30-day mortality rate, and with 2.4 % of the hospital mortality rate.
Multiple primary cancers were observed in 1,644 (16.4 %) of all the 10,034 patients with esophageal cancer. Synchronous cancer was found in 868 (52.9 %) patients, while metachronous cancer (found before esophageal cancer) was observed in 772 (47.0 %) patients. The stomach is the commonest site for both synchronous and metachronous malignancy followed by head & neck cancer (Table 4).
Among esophagectomy procedures, transthoracic esophagectomy through right thoracotomy was the most commonly adopted for patients with a superficial cancer as well as for those with an advanced cancer (Table 5). Transhiatal esophagectomy commonly performed in Western countries was adopted in only 4.4 % of patients having a superficial cancer who underwent esophagectomy, and in 2.0 % of those having an advanced cancer in Japan. The thoracoscopic and/or laparoscopic esophagectomy were adopted for 855 patients (48.6 %) with a superficial cancer, and for 1,193 patients (27.8 %) with an advanced cancer. The number of cases of thoracoscopic and/or laparoscopic surgery for superficial or advanced cancer has been increasing for these several years (Fig. 2).
Fig. 2.
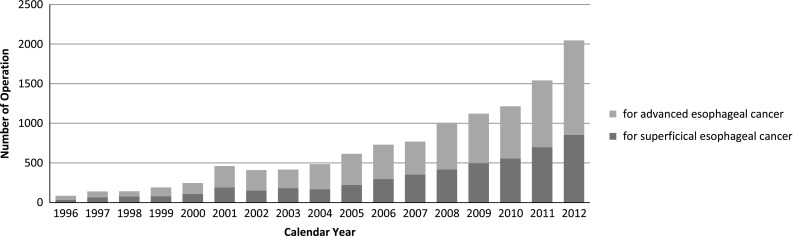
Annual trend of video-assisted esophagectomy for esophageal malignancy
Combined resection of the neighboring organs during resection of an esophageal cancer was performed in 334 patients (Tables 5, 6). Resection of the aorta together with the esophagectomy was performed in 2 cases. Tracheal and/or bronchial resection combined with esophagectomy was performed in 23 patients, with the 30-day mortality rate at 4.3 % and the hospital mortality rate at 13.0 %. Lung resection combined with esophagectomy was performed in 69 patients, with the 30-day mortality rate at 0 % and the hospital mortality rate at 1.4 %.
Salvage surgery after definitive (chemo-)radiotherapy was performed in 256 patients, with the 30-day mortality rate at 2.7 % and with the hospital mortality rate at 6.3 %. (Table 5).
Lastly, in spite of the efforts of the Committee to cover wider patient populations to this annual survey, the majority of the institutions which responded to the questionnaire were the departments of thoracic or esophageal surgery. It should be noted that larger number of patients with esophageal diseases should have been treated medically and endoscopically. We should continue our effort for complete survey through more active collaboration with the Japan Esophageal Society and other related societies.
Table 1 Distribution of number of esophageal operations in 2012 in each institution
| Esophageal surgery | |||
|---|---|---|---|
| Number of operations in 2012 | Benign esophageal diseases | Malignant esophageal disease | Benign + malignant |
| 0 | 262 | 116 | 86 |
| 1–4 | 228 | 99 | 99 |
| 5–9 | 34 | 73 | 81 |
| 10–19 | 22 | 98 | 105 |
| 20–29 | 4 | 45 | 48 |
| 30–39 | 3 | 32 | 35 |
| 40–49 | 0 | 30 | 30 |
| ≧50 | 2 | 62 | 71 |
| Total | 555 | 555 | 555 |
Table 2 Benign esophageal diseases
| Operation (+) | Endoscopic resection | Operation (−) | Total | ||||||||||||
|---|---|---|---|---|---|---|---|---|---|---|---|---|---|---|---|
| Number of patients | 30-day mortality | Hospital mortality | |||||||||||||
| Total | Open | T/L*3 | Open surgery | T/L*3 | Total | Open surgery | T/L*3 | ||||||||
| Total | Hospital | After discharge | Total | Hospital | After discharge | ||||||||||
| 1. Achalasia | 190 | 129 | 61 | 0 | 0 | 0 | 0 | 0 | 0 | 0 | 0 | 0 | 40 | 230 | |
| 2. Benign tumor | 74 | 37 | 37 | 0 | 0 | 0 | 0 | 0 | 0 | 0 | 0 | 0 | 30 | 13 | 117 |
| (1) Leiomyoma | 46 | 21 | 22 | 0 | 0 | 0 | 0 | 0 | 0 | 0 | 0 | 0 | 12 | 9 | 67 |
| (2) Cyst | 7 | 3 | 4 | 0 | 0 | 0 | 0 | 0 | 0 | 0 | 0 | 0 | 0 | 1 | 8 |
| (3) Others | 21 | 10 | 11 | 0 | 0 | 0 | 0 | 0 | 0 | 0 | 0 | 0 | 18 | 3 | 42 |
| (4) Not specified | 0 | 0 | 0 | 0 | 0 | 0 | 0 | 0 | 0 | 0 | 0 | 0 | 0 | 0 | |
| 3. Diverticulum | 28 | 22 | 6 | 0 | 0 | 0 | 0 | 0 | 0 | 0 | 0 | 0 | 14 | 42 | |
| 4. Hiatal hernia | 382 | 284 | 98 | 0 | 0 | 0 | 0 | 0 | 0 | 0 | 0 | 0 | 136 | 518 | |
| 5. Spontaneous rupture of the esophagus | 86 | 79 | 7 | 1 (1.3) | 1 (1.3) | 0 | 0 | 0 | 0 | 1 | 1 (1.3) | 0 | 9 | 95 | |
| 6. Esophago-tracheal fistula | 14 | 13 | 1 | 0 | 0 | 0 | 0 | 0 | 0 | 1 | 1 (7.7) | 0 | 11 | 25 | |
| 7. Congenital esophageal atresia | 35 | 14 | 1 | 0 | 0 | 0 | 0 | 0 | 0 | 0 (0.0) | 0 | 0 | 0 | 35 | |
| 8. Congenital esophageal stenosis | 12 | 11 | 1 | 0 | 0 | 0 | 0 | 0 | 0 | 0 | 0 | 0 | 9 | 21 | |
| 9. Corrosive stricture of the esophagus | 11 | 10 | 1 | 0 | 0 | 0 | 0 | 0 | 0 | 0 | 0 | 0 | 18 | 29 | |
| 10. Esophagitis, Esophageal ulcer | 34 | 32 | 2 | 0 | 0 | 0 | 0 | 0 | 0 | 2 (5.9) | 2 (6.3) | 0 | 197 | 231 | |
| 11. Esophageal varices | 235 | 167 | 8 | 1 (0.6) | 1 (0.6) | 0 | 0 | 0 | 0 | 1 (0.4) | 1 (0.6) | 0 | 608 | 843 | |
| (1) Laparotomy | 31 | 23 | 8 | 0 | 0 | 0 | 0 | 0 | 0 | 0 (0.0) | 0 | 0 | 31 | ||
| (2) Others | 0 | 0 | 0 | 0 | 0 | 0 | 0 | ||||||||
| (3) Sclerotherapy | 0 | 0 | 0 | 0 | 0 | 0 | 497 | 497 | |||||||
| 12. Others | 40 | 30 | 10 | 3 (10.0) | 3 (10.0) | 0 | 0 | 0 | 0 | 3 (7.5) | 3 (10.0) | 0 | 55 | 95 | |
| Total | 1,141 | 828 | 233 | 5 (0.6) | 5 (0.6) | 0 | 0 | 0 | 0 | 8 (0.7) | 8 (1.0) | 0 | 30 | 1,110 | 2,281 |
Values in parenthesis represent mortality %
T/L thoracoscopic and/or laparoscopic
Table 3 Malignant esophageal diseases (histologic classification)
| Resection (+) | Resection (−) | Total | |
|---|---|---|---|
| Carcinomas | 7,823 | 2,133 | 9,956 |
| 1. Squamous cell carcinoma | 7,097 | 2,044 | 9,141 |
| 2. Basaloid(-squamous) carcinoma | 86 | 11 | 97 |
| 3. Carcinosarcoma | 36 | 2 | 38 |
| 4. Adenocarcinoma in the Barrett’s esophagus | 315 | 26 | 341 |
| 5. Other adenocarcinoma | 200 | 22 | 222 |
| 6. Adenosquamous carcinoma | 32 | 2 | 34 |
| 7. Mucoepidermoid carcinoma | 4 | 0 | 4 |
| 8. Adenoid cystic carcinoma | 4 | 0 | 4 |
| 9. Endocrine cell carcinoma | 35 | 13 | 48 |
| 10. Undifferentiated carcinoma | 8 | 9 | 17 |
| 11. Others | 6 | 4 | 10 |
| Other malignancies | 22 | 7 | 29 |
| 1. Malignant non-epithelial tumors | 7 | 1 | 8 |
| 2. Malignant melanoma | 14 | 5 | 19 |
| 3. Other malignant tumors | 1 | 1 | 2 |
| Not specified | 14 | 35 | 49 |
| Total | 7,859 | 2,175 | 10,034 |
Resection: including endoscopic resection
Table 4 Malignant esophageal disease (clinical characteristics)
| Operation (+) | EMR or ESD | Operation (−) | Total | |||||
|---|---|---|---|---|---|---|---|---|
| Cases | 30-day mortality | Hospital mortality | ||||||
| Total | Hospital | After discharge | ||||||
| 1. Esophageal cancer | 6,055 | 47 (0.8) | 45 (0.7) | 2 (0.0) | 131 (2.2) | 1,804 | 2,175 | 10,034 |
| Location | 0 | |||||||
| (1) Cervical esophagus | 215 | 2 (0.9) | 2 (0.9) | 0 | 8 (3.7) | 78 | 164 | 457 |
| (2) Thoracic esophagus | 5,022 | 43 (0.9) | 42 (0.8) | 1 (0.0) | 114 (2.3) | 1,506 | 1,845 | 8,373 |
| (3) Abdominal esophagus | 552 | 2 (0.4) | 1 (0.2) | 1 (0.2) | 8 (1.4) | 78 | 78 | 708 |
| (4) Multiple cancers | 261 | 0 | 0 | 0 | 1 (0.4) | 118 | 70 | 449 |
| (5) Others/not described | 5 | 0 | 0 | 0 | 0 | 24 | 18 | 47 |
| Tumor depth | ||||||||
| (A) Superficial cancer | 1,759 | 11 (0.6) | 10 (0.6) | 1 (0.1) | 26 (1.5) | 1,802 | 232 | 3,793 |
| (B) Advanced cancer | 4,288 | 36 (0.8) | 35 (0.8) | 1 (0.0) | 104 (2.4) | 0 | 1,943 | 6,231 |
| (C) Not specified | 8 | 2 | 0 | 10 | ||||
| 2. Multiple primary cancers | 967 | 8 (0.8) | 7 (0.7) | 1 (0.1) | 20 (2.1) | 364 | 313 | 1,644 |
| 1) Synchronous | 558 | 3 (0.5) | 2 (0.4) | 1 (0.2) | 9 (1.6) | 138 | 172 | 868 |
| (1) Head and neck | 177 | 1 (0.6) | 1 (0.6) | 0 | 2 (1.1) | 60 | 45 | 282 |
| (2) Stomach | 221 | 0 (0.0) | 0 | 0 | 4 (1.8) | 35 | 55 | 311 |
| (3) Others | 137 | 2 (1.5) | 0 | 1 (0.7) | 1 (0.7) | 27 | 54 | 218 |
| (4) Triple cancers | 23 | 1 | 1 (4.3) | 0 | 2 (8.7) | 16 | 18 | 57 |
| 2) Metachronous | 409 | 5 (1.2) | 5 (1.2) | 0 | 11 (2.7) | 225 | 138 | 772 |
| (1) Head and neck | 82 | 2 (2.4) | 2 (2.4) | 0 | 2 (2.4) | 93 | 30 | 205 |
| (2) Stomach | 132 | 2 (1.5) | 2 (1.5) | 0 | 6 (4.5) | 51 | 45 | 228 |
| (3) Others | 171 | 1 (0.6) | 1 (0.6) | 0 | 2 (1.2) | 48 | 43 | 262 |
| (4) Triple cancers | 24 | 0 | 0 | 0 | 1 (4.2) | 32 | 17 | 73 |
Values in parenthesis represent mortality %
EMR endoscopic mucosal resection (including endoscopic submucosal dissection)
Table 5 Malignant esophageal disease (surgical procedures)
| Cases | Operation (+) | EMR or ESD | |||||||
|---|---|---|---|---|---|---|---|---|---|
| 30-day mortality | Hospital mortality | Thoracoscopic and/or laparoscopic procedure | |||||||
| Hospital | After discharge | Cases | 30-day mortality | Hospital mortality | |||||
| Hospital | After discharge | ||||||||
| Superficial cancer | |||||||||
| Esophagectomy | 1,759 | 10 (0.6) | 1 (0.1) | 26 (1.5) | 855 | 6 (0.7) | 0 | 13 (1.5) | 1,802 |
| (1) Transhiatal esophagectomy | 76 | 1 (1.3) | 0 | 2 (2.6) | 6 | 0 | 0 | 0 | |
| (2) Transthoracic (rt.) esophagectomy and reconstruction | 1,387 | 9 (0.6) | 1 (0.1) | 21 (1.5) | 735 | 6 (0.8) | 0 | 12 (1.6) | |
| (3) Transthoracic (lt.) esophagectomy and reconstruction | 54 | 0 | 0 | 1 (1.9) | 4 | 0 | 0 | 0 | |
| (4) Cervical esophageal resection and reconstruction | 18 | 0 | 0 | 0 | 3 | 0 | 0 | 0 | |
| (5) Two-stage operation | 27 | 0 | 0 | 0 | 7 | 0 | 0 | 0 | |
| (6) Others | 184 | 0 | 0 | 1 (0.5) | 76 | 0 | 0 | 0 | |
| (7) Not specified | 13 | 0 | 0 | 1 | 24 | 0 | 0 | 1 (4.2) | |
| Advanced cancer | |||||||||
| Esophagectomy | 4,288 | 35 (0.8) | 1 (0.0) | 104 (2.4) | 1,193 | 8 (0.7) | 0 | 21 (1.8) | 0 |
| (1) Transhiatal esophagectomy | 84 | 1 (1.2) | 0 | 6 (7.1) | 8 | 0 | 0 | 0 | |
| (2) Transthoracic (rt.) esophagectomy and reconstruction | 3,479 | 22 (0.6) | 0 | 79 (2.3) | 1,004 | 5 (0.5) | 0 | 18 (1.8) | |
| (3) Transthoracic (lt.) esophagectomy and reconstruction | 227 | 2 (0.9) | 1 (0.4) | 3 (1.3) | 32 | 0 | 0 | 0 | |
| (4) Cervical esophageal resection and reconstruction | 120 | 2 (1.7) | 0 | 4 (3.3) | 6 | 0 | 0 | 0 | |
| (5) Two-stage operation | 96 | 2 (2.1) | 0 | 5 (5.2) | 18 | 1 (5.6) | 0 | 1 (5.6) | |
| (6) Others/not specified | 268 | 5 (1.9) | 0 | 6 (2.2) | 116 | 2 (1.7) | 0 | 2 (1.7) | |
| (7) Not specified | 14 | 1 (7.1) | 0 | 1 (7.1) | 9 | 0 (0.0) | 0 | 0 | |
| (Depth not specified) | 8 | 0 | 0 | 1 (12.5) | |||||
| Combined resection of other organs | 334 | 2 (0.6) | 0 | 9 (2.7) | |||||
| (1) Aorta | 2 | 0 | 0 | 0 | |||||
| (2) Trachea, bronchus | 23 | 1 (4.3) | 0 | 3 (13.0) | |||||
| (3) Lung | 69 | 0 | 0 | 1 (1.4) | |||||
| (4) Others | 240 | 1 (0.4) | 0 | 5 (2.1) | |||||
| Salvage surgery | 256 | 7 (2.7) | 0 | 16 (6.3) | 31 | 1 (3.2) | 0 | 4 (12.9) | 35 |
Values in parenthesis represent mortality %
Table 6 Mortality after combined resection of the neighboring organs
| Year | Esophagectomy | Combined resection | |||||||||||||
|---|---|---|---|---|---|---|---|---|---|---|---|---|---|---|---|
| Aorta | Tracheobronchus | Lung | Others | ||||||||||||
| a | b | c (%) | a | b | c (%) | a | b | c (%) | a | b | c (%) | a | b | c (%) | |
| 1996 | 4,194 | 120 | 2.86 | 7 | 3 | 42.86 | 24 | 0 | 0.00 | 50 | 2 | 4.00 | 78 | 4 | 5.13 |
| 1997 | 4,441 | 127 | 2.86 | 1 | 0 | 0.00 | 34 | 5 | 14.71 | 56 | 1 | 1.79 | 94 | 3 | 3.19 |
| 1998 | 4,878 | 136 | 2.79 | 4 | 0 | 0.00 | 29 | 0 | 0.00 | 74 | 1 | 1.35 | 128 | 2 | 1.56 |
| 1999 | 5,015 | 116 | 2.31 | 5 | 0 | 0.00 | 23 | 2 | 8.70 | 68 | 0 | 0.00 | 122 | 1 | 0.82 |
| 2000 | 5,350 | 81 | 1.51 | 2 | 0 | 0.00 | 23 | 2 | 8.70 | 69 | 0 | 0.00 | 96 | 1 | 1.04 |
| 2001 | 5,521 | 110 | 1.99 | 1 | 0 | 0.00 | 26 | 1 | 3.85 | 83 | 3 | 3.61 | 99 | 2 | 2.02 |
| 2002 | 4,904 | 66 | 1.35 | 3 | 1 | 33.33 | 20 | 2 | 10.00 | 63 | 0 | 0.00 | 63 | 1 | 1.59 |
| 2003 | 4,639 | 45 | 0.97 | 0 | 0 | 0.00 | 24 | 2 | 8.33 | 58 | 0 | 0.00 | 88 | 1 | 1.14 |
| 2004 | 4,739 | 64 | 1.35 | 2 | 0 | 0.00 | 17 | 0 | 0.00 | 59 | 5 | 8.47 | 119 | 2 | 1.68 |
| 2005 | 5,163 | 52 | 1.01 | 1 | 0 | 0.00 | 11 | 1 | 9.09 | 67 | 1 | 1.49 | 73 | 1 | 1.37 |
| 2006 | 5,236 | 63 | 1.20 | 0 | 0 | 0.00 | 17 | 0 | 0.00 | 62 | 2 | 3.23 | 122 | 3 | 2.46 |
| 2007 | 4,990 | 60 | 1.20 | 0 | 0 | 0.00 | 25 | 1 | 4.00 | 44 | 1 | 2.27 | 138 | 2 | 1.45 |
| 2008 | 5,124 | 63 | 1.23 | 0 | 0 | 0.00 | 17 | 1 | 5.88 | 48 | 1 | 2.08 | 185 | 0 | 0.00 |
| 2009 | 5,260 | 63 | 1.20 | 0 | 0 | 0.00 | 19 | 2 | 10.53 | 58 | 2 | 3.45 | 211 | 3 | 1.42 |
| 2010 | 5,180 | 45 | 0.87 | 2 | 0 | 0.00 | 33 | 0 | 0.00 | 58 | 0 | 0.00 | 245 | 5 | 2.04 |
| 2011 | 5,430 | 38 | 0.70 | 4 | 0 | 0.00 | 26 | 0 | 0.00 | 41 | 0 | 0.00 | 179 | 5 | 2.79 |
| 2012 | 6,055 | 47 | 0.78 | 2 | 0 | 0.00 | 23 | 1 | 4.35 | 69 | 0 | 0.00 | 240 | 1 | 0.42 |
| Total | 86,119 | 1,040 | 1.21 | 26 | 4 | 15.38 | 273 | 16 | 5.86 | 753 | 16 | 2.12 | 1,220 | 23 | 1.89 |
a number of patients who underwent the operation, b number of patients died within 30 days after operation, c % ratio of b/a, i.e., direct operative mortality
Fig. 1.
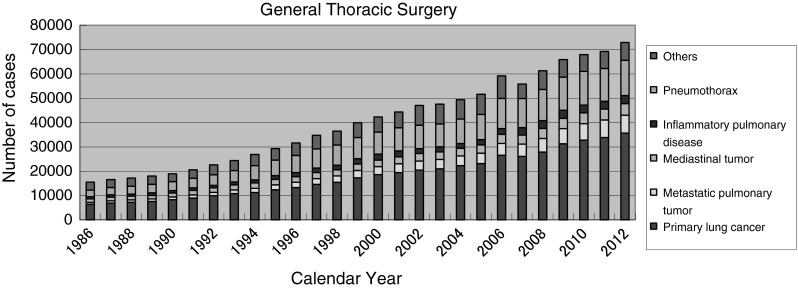
General thoracic surgery
Acknowledgments
On behalf of The Japanese Association for Thoracic Surgery, the authors thank the Heads of the Affiliate and Satellite Institutes of Thoracic Surgery for their cooperation, and the Councilors of the Japan Esophageal Society.
Footnotes
Annual report by The Japanese Association for Thoracic Surgery: Committee for Scientific Affair
Munetaka Masuda, Hiroyuki Kuwano and Meinoshin Okumura have contributed equally.
An erratum to this article is available at http://dx.doi.org/10.1007/s11748-016-0622-7.