

Abstract
Background
Prior studies have implicated baseline positive and negative symptoms as predictors of psychosis onset among individuals at clinical high risk (CHR), but none have evaluated latent trajectories of symptoms over time. This study evaluated the dynamic evolution of symptoms leading to psychosis onset in a CHR cohort.
Method
100 CHR participants were assessed quarterly for up to 2.5 years. Latent trajectory analysis was used to identify patterns of symptom change. Logistic and proportional hazards models were employed to evaluate the predictive value for psychosis onset of baseline symptoms and symptom trajectories.
Results
Transition rate to psychosis was 26%. Disorganized communication (i.e., subthreshold thought disorder) presented an increased hazard for psychosis onset, both at baseline (Hazard Ratio (95% CI) = 1.4 (1.1–1.9)) and as a trajectory of high persistent disorganized communication (Hazard Ratio (95% CI) = 2.2 (1.0–4.9)). Interval clinical data did not improve the predictive value of baseline symptoms for psychosis onset.
Conclusions
High baseline disorganized communication evident at ascertainment tended to persist and lead to psychosis onset, consistent with prior behavioral and speech analysis studies in similar cohorts. Remediation of language dysfunction therefore may be a candidate strategy for preventive intervention.
Keywords: schizophrenia, disorganized communication, longitudinal, latent trajectory analysis, clinical high risk, ultra high risk
1. Introduction
The clinical high-risk (CHR) state for psychosis is characterized by attenuated psychotic symptoms, i.e. subthreshold delusions (unusual thought content, suspiciousness, grandiosity), subthreshold hallucinations (perceptual disturbances) and subthreshold thought disorder (disorganized communication) (Miller et al., 2003). Individuals who meet CHR criteria also have profound negative symptoms, related to their poor function (Corcoran et al., 2011). Prior large (N > 100) CHR cohort studies have examined the predictive value of positive symptoms obtained at ascertainment for psychosis onset within 1–2 years (~15–25%), finding baseline severity of subthreshold thought disorder and subthreshold delusions, and variably negative symptoms, to be associated with later psychosis onset (Cannon et al., 2008; Demjaha et al., 2012; Lemos-Giraldez et al., 2009; Nelson et al., 2013; Ruhrmann et al., 2010).
The clinical high-risk state, however, is likely dynamic over time, and interval data may be informative in quantifying risk for psychosis outcome. As yet, two research groups have examined interval clinical data, finding correlations of symptoms with contemporaneous transition to psychotic disorder. One study (N = 138) assessed symptoms and potential psychosis onset at baseline, six months, and one year in CHR participants, finding that persistent negative symptoms were associated with the development of psychosis (15%) (Piskulic et al., 2012). Another study (N = 61) assessed symptoms and potential psychosis onset at baseline, one year and three years, finding that consistently elevated positive and negative symptoms were present at all three time points among CHR participants who developed psychosis (Lemos-Giraldez et al., 2009). We build on these prior studies, which had three assessment points, by increasing the number of assessments (quarterly for up to 2.5 years) in order to assess if there are heterogeneous trajectories of different “prodromal” symptoms (Fusar-Poli et al., 2014) associated with psychosis outcome.
For data analyses, we used latent trajectory analysis, which offers the opportunity to use interval clinical data between baseline characterization and psychosis onset (or censoring) to examine symptom trajectories as potential predictors of psychosis onset, i.e. latent groups that vary qualitatively by pattern of symptom change (Jones et al., 2001). For more trait-like symptoms of schizophrenia, such as thought disorder, latent trajectory analysis can determine whether there is any added predictive value of trajectories beyond that of baseline severity. In psychiatry, latent trajectory analyses have been used to evaluate the patterns of symptoms in autism onset (N = 52) (Ozonoff et al., 2011), in disparate types of mood episodes in bipolar disorder (N= 118) (M’Bailara et al., 2013), and in response to antipsychotic medications in first-episode psychosis patients (N = 161) (Pelayo-Teran et al., 2014).
Latent class cluster analysis has been used to identify baseline negative symptoms and baseline functional impairment as predictive of psychosis onset (N = 318) (Valmaggia et al., 2013). Latent trajectory analysis, however, has not yet been utilized previously in CHR cohorts. Herein, we evaluated prodromal symptom trajectories in CHR participants assessed on a quarterly basis for up to 30 months until psychosis onset or censoring, to assess the predictive value of clinical trajectories for psychosis. It was hypothesized that latent symptom trajectories exist that have predictive value for psychosis outcome, including time to onset.
2. Experimental/Materials and methods
2.1 Participants
This prospective CHR cohort study was ascertained from 2004 through 2012 at the New York State Psychiatric Institute at Columbia University Medical Center. Participants were 100 English-speaking, help-seeking youths between the ages of 12 and 30 years (at study entry) who were referred from schools and clinicians, or self-referred through the research program website, and who were ascertained as at clinical high-risk for using the Structured Interview for Prodromal Syndromes/Scale of Prodromal Symptoms (SIPS/SOPS; (Miller et al., 2003)). Exclusion criteria included history of threshold psychosis or Axis I psychotic disorder, risk of harm to self or others incommensurate with outpatient care, any major medical or neurological disorder, and IQ < 70. Additionally, attenuated positive symptoms could not have occurred solely in the context of substance use or withdrawal, or have been better accounted for by another Axis I disorder (i.e. a mood disorder). All adult participants provided written informed consent; participants under the age of 18 provided written assent, with written informed consent provided by a parent. This study was approved by the Institutional Review Board at the New York State Psychiatric Institute at Columbia University.
Of note, participants were assessed quarterly in person for up to 2½ years (defined specifically as fewer than or equal to 958 days, or 30 months + 1.5 month acceptable window for the final assessment), or until time of transition to psychosis. For those participants who did not develop psychosis or complete the full 2½ years of assessments, their longitudinal symptom data were considered censored for survival analyses with their last in-person interview, but their outcome with respect to transition by 2½ years was assessed through telephone interview, for the purposes of logistic regression analyses.
2.2 Measures
Demographic information (self-reported age, gender, ethnicity, and education/employment status) was recorded at time of enrollment in the study, as was the use of medications (separate dichotomous variables indicating yes/no for use of antidepressants, yes/no for use of antipsychotics) and cannabis use (yes/no, determined using timeline follow-back procedures for the prior month). The use of other medications and other substances was reported too infrequently for consideration in data analyses.
The SIPS/SOPS was used for ascertainment, and for ratings of prodromal symptoms at baseline and then quarterly for up to 2.5 years, with transition to psychosis determined using its “presence of psychosis” criteria (at least one positive symptom at threshold level (i.e. rating = 6) present several times per week for one month, or for a full day if disorganizing or dangerous). The research design of quarterly clinical ratings was established to characterize symptom trajectories toward psychosis onset. The SIPS/SOPS was administered by trained masters-level clinicians, and ratings were achieved by consensus with the senior author (CMC), who was certified multiple times in its administration by investigators at Yale University, and who has maintained excellent inter-rater reliability with other clinical high-risk programs (intraclass correlation coefficients (ICCs) >0.70 for individual scale items and 1.00 for syndrome ratings).
2.3 Data analyses
Demographics and baseline use of medications/cannabis were evaluated for association with transition to psychosis, using Student t-tests, χ2 analyses and proportional hazards models; any identified as such were included as covariates in further analyses. Stepwise logistic regression and Cox proportional hazards models, with forward selection based on likelihood-ratio estimates, were then used to evaluate the association of any baseline positive symptoms with psychosis transition (yes/no and time to onset, respectively), as well as the predictive value of the sums of both positive and negative symptom scores. Odds ratios (OR) and hazard ratios (HR), with 95% confidence intervals (CI), were calculated using logistic regression and Cox regression analyses, respectively. Alpha (two-tailed) was set at 0.05 for all analyses.
Positive predictive value (PPV), negative predictive value (NPV), sensitivity, and specificity were calculated for each of the baseline variables that were significantly associated with psychosis onset. Baseline symptom measures which presented a statistically significant hazard for psychosis onset were evaluated serially as dichotomous variables (i.e. low/high) divided at each possible score (from 1 through 5) in order to determine the optimal cutpoint to maximize the area under curve (AUC) for receiver operator characteristic (ROC) curves. The Youden index was calculated as the maximal value for sensitivity + specificity −1 (Ruopp et al., 2008) at this optimal cutpoint.
Trajectory analyses were used to identify clusters of participants following similar trajectories in symptoms over time using the “TRAJ” module of STATA (Jones et al., 2001). First, trajectory analyses were conducted for each symptom item that at baseline presented a statistically significant hazard for psychosis onset, with resulting trajectories evaluated for their own predictive power. Trajectories were fit using unadjusted censored normal models to account for clustering of scores at the scales’ minima and maxima. The optimal number of trajectory groups and shape of each trajectory was selected using the Bayesian Information Criterion (BIC) (Schwarz, 1978), which penalizes complex models and thus attains a balance between model parsimony and fit to the data. Allowing for more than five trajectory groups did not improve any of the models and thus only models with five or fewer trajectory groups were considered. Additionally, the highest order polynomial considered for each trajectory was the cubic polynomial since higher order polynomials did not significantly improve model fit. All terms were significant with alpha set at 0.05 in the BIC-selected models. For exploratory analyses, STATA TRAJ was also used to examine trajectories for sum scores for positive and negative symptoms (Hawkins et al., 2004), and also for each SIPS/SOPS item.
Symptom trajectories evaluated for prediction of psychosis were also compared in terms of demographics and baseline use of medication/substances, which if significantly different, were included in tests of association with psychosis onset and time to onset. Symptom trajectories were tested for association with psychosis onset using χ2-square tests, with alpha set at 0.05, with identified trajectories then evaluated in terms of sensitivity, specificity, and positive and negative predictive value, with the Youden Index reported for the optimal trajectory (Ruopp et al., 2008). Survival analyses were done for these same symptom trajectories using Kaplan-Meier analysis, with differential survival determined using the log-rank test, whereas hazard ratios, with 95% confidence intervals, were calculated using Cox proportional hazards models.
3. Results
3.1 Baseline predictors
The cohort was predominantly male (76%) and ethnically diverse, with low levels of baseline medication and substance use (Table 1). Twenty-six of the 100 participants transitioned to psychosis, primarily schizophrenia or schizoaffective disorder (> 90%), during the 30-month follow-up period, with mean (standard error) survival = 729.8 (39.0) days. In forward stepwise regression with all demographic and baseline clinical variables (individual positive and negative symptoms) entered as predictors, only disorganized communication (i.e., subthreshold thought disorder) was related to increased risk for psychosis, Wald χ21df = 4.83, p = 0.03, Odds Ratio (95% CI) = 1.43 (1.04–1.97), and to shorter time to psychosis onset, Wald χ21df = 6.80, p = 0.009, Hazard Ratio (95% CI) = 1.43 (1.09–1.87) (Table 1). Baseline disorganized communication was significantly predictive of transition when dichotomized using either 2, 3 or 4 as the cut-off scores, with increasing PPV and specificity for higher cut-off scores and greater NPV and sensitivity for lower cut-off scores (Table 2). Visual inspection of the ROC curve (AUC = 0.64, SE = 0.06), which bows towards optimal sensitivity and specificity in the 2 through 4 range, supports the use of these cutoff values in order to maximize the utility of this item in predicting psychosis onset (Figure 1). The Youden Index (maximal value for sensitivity + specificity − 1) (Ruopp et al., 2008) was .24 with the optimal cutpoint of a score of 3 for baseline disorganized communication.
Table 1.
Demographics and baseline clinical characteristics
| Total CHR N =100 |
CHR+ N = 26 |
CHR− N = 74 |
|
|---|---|---|---|
| Demographics | Mean (SD) | Mean (SD) | Mean (SD) |
| Age (mean (SD)) | 20.1 (3.8) | 20.0 (3.9) | 20.1 (3.8) |
| N/% | N (%) | N (%) | |
| Male | 76 (76) | 21 (81) | 55 (74) |
| Ethnicity (self-reported)1 | |||
| Caucasian | 43 (43) | 8 (31) | 35 (47) |
| Latino | 32 (32) | 9 (35) | 23 (31) |
| African-American | 13 (13) | 4 (15) | 9 (12) |
| Asian-American | 9 (9) | 4 (15) | 5 (7) |
| More than one | 3 (3) | 1 (4) | 2 (3) |
| Full time employment/education | 63 (63) | 13 (50) | 50 (68) |
| Antipsychotic use at baseline | 14 (14) | 4 (15) | 10 (14) |
| Antidepressant use at baseline | 22 (22) | 4 (15) | 18 (24) |
| Cannabis use | 23 (23) | 6 (23) | 17 (23) |
| Symptoms | Mean (SD) | Mean (SD) | Mean (SD) |
| Positive symptoms (SIPS/SOPS) | |||
| Total | 13.0 (4.5) | 13.5 (4.9) | 12.8 (4.4) |
| Unusual thought content | 3.5 (1.3) | 3.7 (1.4) | 3.4 (1.2) |
| Suspiciousness | 3.0 (1.4) | 3.0 (1.5) | 3.0 (1.5) |
| Grandiosity | 1.7 (1.6) | 1.3 (1.7) | 1.9 (1.5) |
| Perceptual abnormalities | 2.6 (1.6) | 2.7 (1.9) | 2.6 (1.5) |
| Disorganized communication * | 2.2 (1.5) | 2.8 (1.5) | 2.0 (1.5) |
| Negative symptoms (SIPS/SOPS) | |||
| Total | 13.8 (6.6) | 15.4 (7.4) | 13.3 (6.3) |
| Social isolation and withdrawal | 3.2 (1.8) | 3.7 (1.8) | 3.0 (1.8) |
| Avolition | 2.7 (1.7) | 2.8 (1.6) | 2.7 (1.8) |
| Decreased expression of emotion | 1.5 (1.6) | 1.8 (1.8) | 1.4 (1.6) |
| Decreased experience of emotion | 1.6 (1.5) | 1.8 (1.6) | 1.5 (1.5) |
| Decreased ideational richness | 1.2 (1.4) | 1.4 (1.5) | 1.1 (1.4) |
| Deterioration in role function | 3.6 (1.8) | 3.9 (1.7) | 3.5 (1.9) |
Note: CHR+ are clinical high-risk patients who developed psychosis and CHR− are clinical high-risk patients who did not develop psychosis, within 2.5 years following baseline assessment.
indicates significant in stepwise logistic and Cox regression tests, p < 0.05, two-tailed.
Ethnic differences in risk for psychosis were tested by comparing ethnic minority to Caucasian respondents, due to limited statistical power when considering each ethnic group separately.
Table 2.
Disorganized communication as a predictor of psychosis onset
| n | Survival | Binomial classification | ||||
|---|---|---|---|---|---|---|
| HR (95% CI) | PPV | NPV | Sensitivity | Specificity | ||
| Baseline | ||||||
| Disorganized communication, 1+ | 83 | 2.15 (0.51–9.09) | .29 | .88 | .92 | .19 |
| Disorganized communication, 2+ | 66 | 2.73 (1.03–7.27) | .33 | .85 | .81 | .38 |
| Disorganized communication, 3+ | 44 | 2.63 (1.18–5.85) | .36 | .82 | .62 | .62 |
| Disorganized communication, 4+ | 22 | 2.43 (1.04–5.69) | .36 | .77 | .31 | .81 |
| Disorganized communication, 5+ | 7 | 2.47 (0.84–7.27) | .57 | .76 | .15 | .96 |
| Trajectories | ||||||
| Disorganized communication, elevated | 44 | 2.23 (1.01–4.93) | .34 | .80 | .58 | .61 |
Note: Bold indicates significant hazard ratio by Cox regression, p<0.05.
PPV = positive predictive value
NPV = negative predictive value
Figure 1.
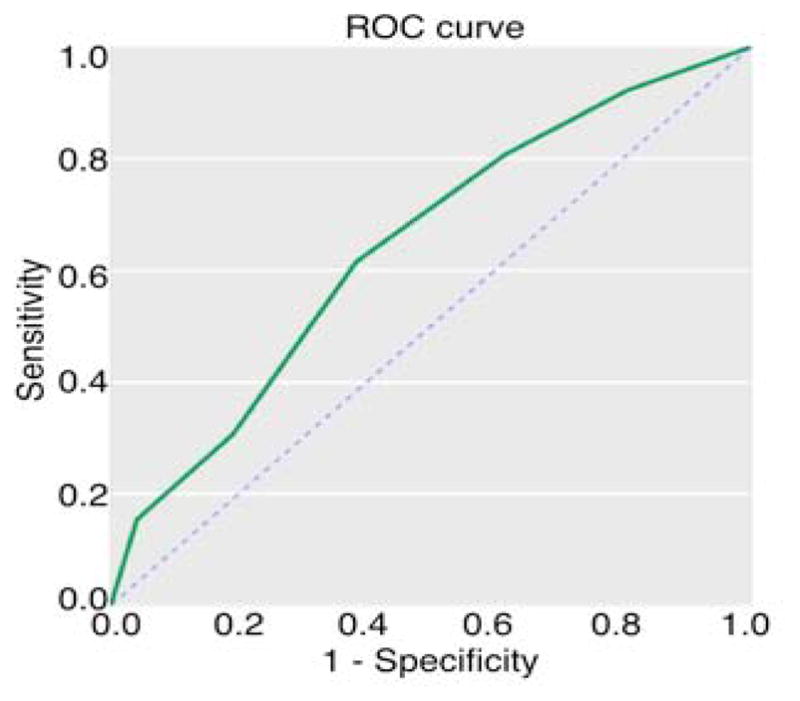
Baseline disorganized communication and psychosis onset. Receiver operator characteristic (ROC) is indicated by the solid black line, plotted as sensitivity (y-axis) versus 1-specificity (x-axis). The dashed line indicates the line of no-discrimination.
3.2 Trajectory analyses
Given the predictive value for psychosis onset of baseline disorganized communication, we next conducted trajectory analyses to determine if the pattern of expression over time for disorganized communication added to its predictive value beyond baseline severity. We identified four trajectory groups for disorganized communication (Figure 2); these four trajectories did not vary on demographic features, education, employment, substance use, or medications. The trajectory describing high persistent disorganized communication had a transition rate to psychosis of 34.1%, compared with 28.6%, 20.0%, and 15.8% for the other trajectories (in descending order of baseline severity of disorganized communication).
Figure 2.

Latent trajectories of disorganized communication (SOPS) over the course of follow-up. Time (years) is presented on the x-axis and symptom severity (Scale of Prodromal Symptoms disorganized communication score) on the y-axis. Curves were derived from fitting cubic splines to trajectory model estimates.
The sensitivity and specificity for this trajectory of high persistent disorganized communication in terms of psychosis risk was comparable to that determined by a cutoff of 3 for the baseline value of high disorganized communication (Table 2), with a slightly lower Youden Index = .19 (vs. .24). Notably, the group with baseline disorganized communication scores of 3 or greater (i.e. 3+) largely overlapped with the persistently elevated trajectory group for disorganized communication (37/44 of members (84.1%) of each group overlapped, χ21df = 53.3, p < 0.001). Further, this trajectory of high persistent disorganized communication was associated with a shorter time to onset of psychosis (Figure 3), mean survival (standard error) = 652.4 (63.8) days vs. 788.7 (46.9) for the combined group of the other three trajectories, and Hazard Ratio (95% CI) = 2.23 (1.01–4.93), log-rank χ21df = 4.2, p=0.04, with a trend for prediction of psychosis in bivariate analysis χ21df = 2.67, p = 0.10. Of note, the mean(se) change in disorganized communication from baseline to last evaluation was small at −0.33 (0.11) for the full cohort, and was independent of psychosis outcome.
Figure 3.
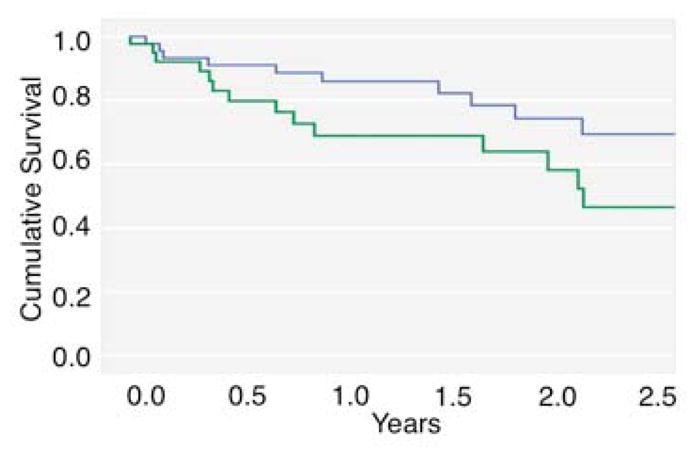
Survival (in years) plotted as a function of disorganized communication trajectory group. The thick black line indicates the persistently elevated symptom group and the thin gray line indicates the remaining three groups.
Exploratory trajectory analyses of sums for positive and negative symptom scores yielded two and four trajectories, respectively (supplementary figure, online), none of which were associated with risk for psychosis onset or time to psychosis onset, using χ2 analyses (total positive symptom score: χ21df = 0.3, p = 0.58; total negative symptom score: χ23df = 3.6, p = 0.31) or Kaplan-Meier analyses (total positive symptom score: log rank χ21df = 0.0, p = 0.93; total negative symptom score: log-rank χ23df = 1.5, p = 0.69). Exploratory trajectory analyses for all SIPS/SOPS items also did not yield any trajectories associated with risk for psychosis or time to psychosis onset (data not shown).
4. Discussion
In the present study, baseline severity of subthreshold thought disorder, indicated by the SIPS/SOPS symptom of “disorganized communication,” was associated with transition to psychosis, primarily in the schizophrenia spectrum, consistent with prior studies in CHR cohorts (Bearden et al., 2011; Cannon et al., 2008; Demjaha et al., 2012; Haroun et al., 2006; Klosterkotter et al., 2001; Nelson et al., 2013; Ruhrmann et al., 2010). No other positive or negative symptom or subscale scores were predictive of psychosis onset in this cohort. Further, latent trajectory analysis demonstrated that sustained elevated disorganized communication also predicted psychosis outcome, primarily in the schizophrenia spectrum, as well as time to onset. However, there was significant overlap between this trajectory group and the subcohort who had elevated scores for disorganized communication at baseline. In fact, the predictive power (i.e. Youden Index = maximal sensitivity + specificity −1) for the trajectory of persistent disorganized communication (Youden Index = .19) was slightly less than that of baseline symptoms, in both this cohort (Youden Index = .24) and in similar risk cohorts (i.e. Youden Index = .25) in North America (Cannon et al., 2008). Thus, there does not seem to be added benefit or utility in conducting frequent (i.e. quarterly) comprehensive assessments in a clinical high-risk cohort for predicting eventual psychosis outcome.
Overall, clinically relevant subthreshold thought disorder evident at ascertainment in high-risk participants tended to persist and eventually lead to psychosis onset, primarily schizophrenia. These data support the concept of disorganized communication as a potential endophenotype or stable trait marker for schizophrenia risk, consistent with the finding that disorganized communication aggregates in family members of individuals with schizophrenia (Levy et al., 2010) and predicts psychosis onset also in genetic high-risk individuals(Ott et al., 2002). Of note, the relevance of subthreshold thought disorder for emergent schizophrenia and related psychotic disorders is evident also from studies of 1) speech analysis, using audio recordings and transcripts, in both clinical high risk (Bearden et al., 2011) and genetic high risk (Gooding et al., 2012; Gooding et al., 2013) cohorts; and 2) studies of speech illusion (the tendency to find spurious meaning in the noise of overlapping speech), which is increased in those CHR participants who go on to develop psychosis (Hoffman et al., 2007).
The specific neural correlates of disorganized communication have not yet been identified among at-risk participants, though as a forme fruste of thought disorder, it would be expected to be related to pathology in the left superior temporal gyrus, including reduction in its gray matter volume (Barta et al., 1997; Menon et al., 1995; Sans-Sansa et al., 2013; Shenton et al., 1992; Weinstein et al., 2007) and in its functional activity (Kircher et al., 2001; Sans-Sansa et al., 2013; Weinstein et al., 2007). The left superior temporal gyrus is a biologically plausible neural substrate for disorganized communication as it is critical for language comprehension and production. As dopamine antagonists reverse volume loss in the superior temporal gyrus in first-episode schizophrenia (Keshavan et al., 1998), they might have efficacy in treating disorganized communication and preventing psychosis onset in CHR participants; however, their utility in at-risk cohorts has been limited by side effects and subsequent noncompliance and dropout (McGorry et al., 2009). Remediation strategies to improve communication in CHR participants have not yet been evaluated.
Neither baseline negative symptoms nor a trajectory of negative symptoms was associated with hazard or risk for psychosis onset in the current study. Disparate results across studies may be related to differences in methodology. Prior studies which found baseline negative symptoms to be predictive of psychosis onset (Demjaha et al., 2012; Nelson et al., 2013; Riecher-Rossler et al., 2009; Valmaggia et al., 2013; Velthorst et al., 2009; Yung et al., 2005) generally used alternative scales, specifically the Comprehensive Assessment of At-Risk Mental States (Yung et al., 2005) and the Scale for the Assessment of Negative Symptoms (Andreasen, 1982). Prior studies that used the SIPS/SOPS, as we did, have generally not found negative symptoms to be significantly predictive of psychosis onset (Cannon et al., 2008; Haroun et al., 2006; Lemos-Giraldez et al., 2009; Riecher-Rossler et al., 2009; Ruhrmann et al., 2010; Walder et al., 2013) (but see (Piskulic et al., 2012)). Disparate results from prior studies may also be related to differences in ascertainment, and resultant cohort differences, as our sample had prevalent schizophrenia outcome, and greater severity of negative symptoms (Corcoran et al., 2011) than the prior study that found SIPS negative symptoms to be predictive of psychosis onset (Piskulic et al., 2012).
Limitations of the current study include a reliance solely on behavioral measures, specifically clinician ratings of subjective symptoms and observable behavioral signs, with only one measure of negative symptoms used. Nonetheless, symptom ratings were conducted on a longitudinal basis, with frequent assessments in a cohort enriched with cases of emergent schizophrenia and related psychotic disorders. Also, the cohort size was modest (i.e. N = 100), which may increase risk for Type 2 error, though it falls within the range (i.e. N = 52–161) of cohort sizes in prior studies that evaluated trajectories of symptoms in autism, bipolar disorder and psychosis (M’Bailara et al., 2013; Ozonoff et al., 2011; Pelayo-Teran et al., 2014). Future studies including longitudinal assay of structural and functional integrity of the left superior temporal gyrus and its connectivity with other nodes relevant to language, as well as analysis of speech transcripts (Bearden et al., 2011; Gooding et al., 2012; Gooding et al., 2013) and speech interpretation (Hoffman et al., 2007), may carry added benefit. In addition, therapeutics beyond dopamine antagonists, that similarly target the superior temporal gyrus and related neuroanatomic regions (such as noninvasive brain stimulation and/or language-based remediation strategies) may also be considered in conjunction with putative neuroimaging and/or speech analysis biomarkers.
Supplementary Material
Latent trajectories of the total positive symptom subscale. Time (years) is presented on the x-axis and symptom severity (Scale of Prodromal Symptoms scores) on the y-axis. Lines were derived from fitting cubic splines to trajectory model estimates.
Latent trajectories of the total negative symptom subscale. Time (years) is presented on the x-axis and symptom severity (Scale of Prodromal Symptoms scores) on the y-axis. Lines were derived from fitting cubic splines to trajectory model estimates.
Acknowledgments
None.
Role of the Funding Source
This work was supported by the National Institute of Mental Health (K23MH066279, R21MH086125, R01P50MH086385); The National Center for Advancing Translational Sciences (NIH UL1 TR000040, UL1 RR024156); the Brain and Behavior Research Foundation; and the New York State Office of Mental Hygiene.
Footnotes
Contributors
Jordan DeVylder developed the hypotheses and analyses to evaluate trajectories of symptoms in the CHR cohort, conducted the literature review, and wrote a series of drafts, which were reviewed and edited by the other authors. Felix Muchomba conducted the trajectory analyses, provided general statistical consultation, and reviewed and edited drafts. Kelly Gill and Shelly Ben-David collected and cleaned the data and managed the dataset. Deborah Walder and Dolores Malaspina contributed to drafts in terms of expertise on psychosis risk. Cheryl Corcoran was the director of the cohort study and designed the research methods; she oversaw the ascertainment and characterization of CHR patients, leading consensus on SIPS/SOPS ratings, and did primary editing of successive drafts.
Conflict of Interest
None.
Publisher's Disclaimer: This is a PDF file of an unedited manuscript that has been accepted for publication. As a service to our customers we are providing this early version of the manuscript. The manuscript will undergo copyediting, typesetting, and review of the resulting proof before it is published in its final citable form. Please note that during the production process errors may be discovered which could affect the content, and all legal disclaimers that apply to the journal pertain.
Contributor Information
Jordan E. DeVylder, Email: Jordan.Devylder@gmail.com.
Felix M. Muchomba, Email: Fmm2116@columbia.edu.
Kelly E. Gill, Email: Kegill13@gmail.com.
Shelly Ben-David, Email: shellybendavid@gmail.com.
Deborah J. Walder, Email: DWalder@brooklyn.cuny.edu.
Dolores Malaspina, Email: Dolores.malaspina@nyumc.org.
References
- Andreasen NC. Negative symptoms in schizophrenia. Definition and reliability. Arch Gen Psychiatry. 1982;39(7):784–788. doi: 10.1001/archpsyc.1982.04290070020005. [DOI] [PubMed] [Google Scholar]
- Barta PE, Pearlson GD, Brill LB, 2nd, Royall R, McGilchrist IK, Pulver AE, Powers RE, Casanova MF, Tien AY, Frangou S, Petty RG. Planum temporale asymmetry reversal in schizophrenia: replication and relationship to gray matter abnormalities. Am J Psychiatry. 1997;154(5):661–667. doi: 10.1176/ajp.154.5.661. [DOI] [PubMed] [Google Scholar]
- Bearden CE, Wu KN, Caplan R, Cannon TD. Thought disorder and communication deviance as predictors of outcome in youth at clinical high risk for psychosis. J Am Acad Child Adolesc Psychiatry. 2011;50(7):669–680. doi: 10.1016/j.jaac.2011.03.021. [DOI] [PMC free article] [PubMed] [Google Scholar]
- Cannon TD, Cadenhead K, Cornblatt B, Woods SW, Addington J, Walker E, Seidman LJ, Perkins D, Tsuang M, McGlashan T, Heinssen R. Prediction of psychosis in youth at high clinical risk: a multisite longitudinal study in North America. Arch Gen Psychiatry. 2008;65(1):28–37. doi: 10.1001/archgenpsychiatry.2007.3. [DOI] [PMC free article] [PubMed] [Google Scholar]
- Cannon TD, Rosso IM, Hollister JM, Bearden CE, Sanchez LE, Hadley T. A prospective cohort study of genetic and perinatal influences in the etiology of schizophrenia. Schizophr Bull. 2000;26(2):351–366. doi: 10.1093/oxfordjournals.schbul.a033458. [DOI] [PubMed] [Google Scholar]
- Corcoran CM, Kimhy D, Parrilla-Escobar MA, Cressman VL, Stanford AD, Thompson J, David SB, Crumbley A, Schobel S, Moore H, Malaspina D. The relationship of social function to depressive and negative symptoms in individuals at clinical high risk for psychosis. Psychol Med. 2011;41(2):251–261. doi: 10.1017/S0033291710000802. [DOI] [PMC free article] [PubMed] [Google Scholar]
- Demjaha A, Valmaggia L, Stahl D, Byrne M, McGuire P. Disorganization/cognitive and negative symptom dimensions in the at-risk mental state predict subsequent transition to psychosis. Schizophr Bull. 2012;38(2):351–359. doi: 10.1093/schbul/sbq088. [DOI] [PMC free article] [PubMed] [Google Scholar]
- Fusar-Poli P, Yung AR, McGorry P, van Os J. Lessons learned from the psychosis high-risk state: towards a general staging model of prodromal intervention. Psychol Med. 2014;44(1):17–24. doi: 10.1017/S0033291713000184. [DOI] [PubMed] [Google Scholar]
- Gooding DC, Coleman MJ, Roberts SA, Shenton ME, Levy DL, Erlenmeyer-Kimling L. Thought disorder in offspring of schizophrenic parents: findings from the New York High-Risk Project. Schizophr Bull. 2012;38(2):263–271. doi: 10.1093/schbul/sbq061. [DOI] [PMC free article] [PubMed] [Google Scholar]
- Gooding DC, Ott SL, Roberts SA, Erlenmeyer-Kimling L. Thought disorder in mid-childhood as a predictor of adulthood diagnostic outcome: findings from the New York High-Risk Project. Psychol Med. 2013;43(5):1003–1012. doi: 10.1017/S0033291712001791. [DOI] [PubMed] [Google Scholar]
- Haroun N, Dunn L, Haroun A, Cadenhead KS. Risk and protection in prodromal schizophrenia: ethical implications for clinical practice and future research. Schizophr Bull. 2006;32(1):166–178. doi: 10.1093/schbul/sbj007. [DOI] [PMC free article] [PubMed] [Google Scholar]
- Hawkins KA, McGlashan TH, Quinlan D, Miller TJ, Perkins DO, Zipursky RB, Addington J, Woods SW. Factorial structure of the Scale of Prodromal Symptoms. Schizophr Res. 2004;68(2–3):339–347. doi: 10.1016/S0920-9964(03)00053-7. [DOI] [PubMed] [Google Scholar]
- Hoffman RE, Woods SW, Hawkins KA, Pittman B, Tohen M, Preda A, Breier A, Glist J, Addington J, Perkins DO, McGlashan TH. Extracting spurious messages from noise and risk of schizophrenia-spectrum disorders in a prodromal population. Br J Psychiatry. 2007;191:355–356. doi: 10.1192/bjp.bp.106.031195. [DOI] [PubMed] [Google Scholar]
- Jones BL, Nagin DS, Roeder K. A SAS procedure based on mixture models for estimating developmental trajectories. Sociol Method Res. 2001;29(3):374–393. [Google Scholar]
- Keshavan MS, Haas GL, Kahn CE, Aguilar E, Dick EL, Schooler NR, Sweeney JA, Pettegrew JW. Superior temporal gyrus and the course of early schizophrenia: progressive, static, or reversible? J Psychiatr Res. 1998;32(3–4):161–167. doi: 10.1016/s0022-3956(97)00038-1. [DOI] [PubMed] [Google Scholar]
- Kircher TT, Liddle PF, Brammer MJ, Williams SC, Murray RM, McGuire PK. Neural correlates of formal thought disorder in schizophrenia: preliminary findings from a functional magnetic resonance imaging study. Arch Gen Psychiatry. 2001;58(8):769–774. doi: 10.1001/archpsyc.58.8.769. [DOI] [PubMed] [Google Scholar]
- Klosterkotter J, Hellmich M, Steinmeyer EM, Schultze-Lutter F. Diagnosing schizophrenia in the initial prodromal phase. Arch Gen Psychiatry. 2001;58(2):158–164. doi: 10.1001/archpsyc.58.2.158. [DOI] [PubMed] [Google Scholar]
- Lemos-Giraldez S, Vallina-Fernandez O, Fernandez-Iglesias P, Vallejo-Seco G, Fonseca-Pedrero E, Paino-Pineiro M, Sierra-Baigrie S, Garcia-Pelayo P, Pedrejon-Molino C, Alonso-Bada S, Gutierrez-Perez A, Ortega-Ferrandez JA. Symptomatic and functional outcome in youth at ultra-high risk for psychosis: a longitudinal study. Schizophr Res. 2009;115(2–3):121–129. doi: 10.1016/j.schres.2009.09.011. [DOI] [PubMed] [Google Scholar]
- Levy DL, Coleman MJ, Sung H, Ji F, Matthysse S, Mendell NR, Titone D. The Genetic Basis of Thought Disorder and Language and Communication Disturbances in Schizophrenia. J Neurolinguistics. 2010;23(3):176. doi: 10.1016/j.jneuroling.2009.08.003. [DOI] [PMC free article] [PubMed] [Google Scholar]
- M’Bailara K, Cosnefroy O, Vieta E, Scott J, Henry C. Group-based trajectory modeling: a novel approach to examining symptom trajectories in acute bipolar episodes. J Affect Disord. 2013;145(1):36–41. doi: 10.1016/j.jad.2012.07.007. [DOI] [PubMed] [Google Scholar]
- McGorry PD, Nelson B, Amminger GP, Bechdolf A, Francey SM, Berger G, Riecher-Rossler A, Klosterkotter J, Ruhrmann S, Schultze-Lutter F, Nordentoft M, Hickie I, McGuire P, Berk M, Chen EY, Keshavan MS, Yung AR. Intervention in individuals at ultra-high risk for psychosis: a review and future directions. J Clin Psychiatry. 2009;70(9):1206–1212. doi: 10.4088/JCP.08r04472. [DOI] [PubMed] [Google Scholar]
- Menon RR, Barta PE, Aylward EH, Richards SS, Vaughn DD, Tien AY, Harris GJ, Pearlson GD. Posterior superior temporal gyrus in schizophrenia: grey matter changes and clinical correlates. Schizophr Res. 1995;16(2):127–135. doi: 10.1016/0920-9964(94)00067-i. [DOI] [PubMed] [Google Scholar]
- Miller TJ, McGlashan TH, Rosen JL, Cadenhead K, Cannon T, Ventura J, McFarlane W, Perkins DO, Pearlson GD, Woods SW. Prodromal assessment with the structured interview for prodromal syndromes and the scale of prodromal symptoms: predictive validity, interrater reliability, and training to reliability. Schizophr Bull. 2003;29(4):703–715. doi: 10.1093/oxfordjournals.schbul.a007040. [DOI] [PubMed] [Google Scholar]
- Nelson B, Yuen HP, Wood SJ, Lin A, Spiliotacopoulos D, Bruxner A, Broussard C, Simmons M, Foley DL, Brewer WJ, Francey SM, Amminger GP, Thompson A, McGorry PD, Yung AR. Long-term follow-up of a group at ultra high risk (“prodromal”) for psychosis: the PACE 400 study. JAMA Psychiatry. 2013;70(8):793–802. doi: 10.1001/jamapsychiatry.2013.1270. [DOI] [PubMed] [Google Scholar]
- Ott SL, Roberts S, Rock D, Allen J, Erlenmeyer-Kimling L. Positive and negative thought disorder and psychopathology in childhood among subjects with adulthood schizophrenia. Schizophr Res. 2002;58(2–3):231–239. doi: 10.1016/s0920-9964(01)00339-5. [DOI] [PubMed] [Google Scholar]
- Ozonoff S, Iosif AM, Young GS, Hepburn S, Thompson M, Colombi C, Cook IC, Werner E, Goldring S, Baguio F, Rogers SJ. Onset patterns in autism: correspondence between home video and parent report. J Am Acad Child Adolesc Psychiatry. 2011;50(8):796–806. e791. doi: 10.1016/j.jaac.2011.03.012. [DOI] [PMC free article] [PubMed] [Google Scholar]
- Pelayo-Teran JM, Diaz FJ, Perez-Iglesias R, Suarez-Pinilla P, Tabares-Seisdedos R, de Leon J, Crespo-Facorro B. Trajectories of symptom dimensions in short-term response to antipsychotic treatment in patients with a first episode of non-affective psychosis. Psychol Med. 2014;44(1):37–50. doi: 10.1017/S0033291713000330. [DOI] [PubMed] [Google Scholar]
- Piskulic D, Addington J, Cadenhead KS, Cannon TD, Cornblatt BA, Heinssen R, Perkins DO, Seidman LJ, Tsuang MT, Walker EF, Woods SW, McGlashan TH. Negative symptoms in individuals at clinical high risk of psychosis. Psychiatry Res. 2012;196(2–3):220–224. doi: 10.1016/j.psychres.2012.02.018. [DOI] [PMC free article] [PubMed] [Google Scholar]
- Riecher-Rossler A, Pflueger MO, Aston J, Borgwardt SJ, Brewer WJ, Gschwandtner U, Stieglitz RD. Efficacy of using cognitive status in predicting psychosis: a 7-year follow-up. Biol Psychiatry. 2009;66(11):1023–1030. doi: 10.1016/j.biopsych.2009.07.020. [DOI] [PubMed] [Google Scholar]
- Ruhrmann S, Schultze-Lutter F, Salokangas RK, Heinimaa M, Linszen D, Dingemans P, Birchwood M, Patterson P, Juckel G, Heinz A, Morrison A, Lewis S, von Reventlow HG, Klosterkotter J. Prediction of psychosis in adolescents and young adults at high risk: results from the prospective European prediction of psychosis study. Arch Gen Psychiatry. 2010;67(3):241–251. doi: 10.1001/archgenpsychiatry.2009.206. [DOI] [PubMed] [Google Scholar]
- Ruopp MD, Perkins NJ, Whitcomb BW, Schisterman EF. Youden Index and optimal cut-point estimated from observations affected by a lower limit of detection. Biometrical journal Biometrische Zeitschrift. 2008;50(3):419–430. doi: 10.1002/bimj.200710415. [DOI] [PMC free article] [PubMed] [Google Scholar]
- Sans-Sansa B, McKenna PJ, Canales-Rodriguez EJ, Ortiz-Gil J, Lopez-Araquistain L, Sarro S, Duenas RM, Blanch J, Salvador R, Pomarol-Clotet E. Association of formal thought disorder in schizophrenia with structural brain abnormalities in language-related cortical regions. Schizophr Res. 2013;146(1–3):308–313. doi: 10.1016/j.schres.2013.02.032. [DOI] [PubMed] [Google Scholar]
- Schwarz G. Estimating Dimension of a Model. Ann Stat. 1978;6(2):461–464. [Google Scholar]
- Shenton ME, Kikinis R, Jolesz FA, Pollak SD, LeMay M, Wible CG, Hokama H, Martin J, Metcalf D, Coleman M, et al. Abnormalities of the left temporal lobe and thought disorder in schizophrenia. A quantitative magnetic resonance imaging study. N Engl J Med. 1992;327(9):604–612. doi: 10.1056/NEJM199208273270905. [DOI] [PubMed] [Google Scholar]
- Valmaggia LR, Stahl D, Yung AR, Nelson B, Fusar-Poli P, McGorry PD, McGuire PK. Negative psychotic symptoms and impaired role functioning predict transition outcomes in the at-risk mental state: a latent class cluster analysis study. Psychol Med. 2013;43(11):2311–2325. doi: 10.1017/S0033291713000251. [DOI] [PubMed] [Google Scholar]
- Velthorst E, Nieman DH, Becker HE, van de Fliert R, Dingemans PM, Klaassen R, de Haan L, van Amelsvoort T, Linszen DH. Baseline differences in clinical symptomatology between ultra high risk subjects with and without a transition to psychosis. Schizophr Res. 2009;109(1–3):60–65. doi: 10.1016/j.schres.2009.02.002. [DOI] [PubMed] [Google Scholar]
- Walder DJ, Holtzman CW, Addington J, Cadenhead K, Tsuang M, Cornblatt B, Cannon TD, McGlashan TH, Woods SW, Perkins DO, Seidman LJ, Heinssen R, Walker EF. Sexual dimorphisms and prediction of conversion in the NAPLS psychosis prodrome. Schizophr Res. 2013;144(1–3):43–50. doi: 10.1016/j.schres.2012.11.039. [DOI] [PMC free article] [PubMed] [Google Scholar]
- Weinstein S, Woodward TS, Ngan ET. Brain activation mediates the association between structural abnormality and symptom severity in schizophrenia. Neuroimage. 2007;36(1):188–193. doi: 10.1016/j.neuroimage.2007.02.030. [DOI] [PubMed] [Google Scholar]
- Yung AR, Yuen HP, McGorry PD, Phillips LJ, Kelly D, Dell’Olio M, Francey SM, Cosgrave EM, Killackey E, Stanford C, Godfrey K, Buckby J. Mapping the onset of psychosis: the Comprehensive Assessment of At-Risk Mental States. Aust N Z J Psychiatry. 2005;39(11–12):964–971. doi: 10.1080/j.1440-1614.2005.01714.x. [DOI] [PubMed] [Google Scholar]
Associated Data
This section collects any data citations, data availability statements, or supplementary materials included in this article.
Supplementary Materials
Latent trajectories of the total positive symptom subscale. Time (years) is presented on the x-axis and symptom severity (Scale of Prodromal Symptoms scores) on the y-axis. Lines were derived from fitting cubic splines to trajectory model estimates.
Latent trajectories of the total negative symptom subscale. Time (years) is presented on the x-axis and symptom severity (Scale of Prodromal Symptoms scores) on the y-axis. Lines were derived from fitting cubic splines to trajectory model estimates.