

Abstract
Objective
This study aimed to quantify functional status (FS) trajectories pre- and post-diagnosis of cancer, FS trajectories among cancer-free individuals, and factors affecting FS.
Materials and Methods
Self-reported FS, scored from 0 (worst) to 100 (best), of Atherosclerosis Risk in Communities (ARIC) Study cohort participants diagnosed with incident cancer (lung (N=303), breast (N=374), prostate (N=529), colorectal (N=228)), and cancer-free participants (N=11,155) over 15 years was examined. FS was evaluated in two ways: 1) until death or follow-up year 15 (Model 1) and 2) same as survivorship model except that a FS value of zero was used for assessments after death to follow-up year 15 (Model 2). Mean FS at discrete time points were used to generate FS trajectories. Differences in repeated measures of FS were assessed using linear growth models.
Results
Within one year after diagnosis, FS scores declined compared to the cancer-free group, except for prostate cancer. FS continued to decline beyond one year after lung or colorectal cancer diagnosis. FS was lower in all cancer groups, except prostate, compared to the cancer-free group (Model 1: lung -4.76, breast -2.28, colorectal -2.55; Model 2: lung -2.36, breast -2.46, colorectal -2.31). Predictors of decreased FS score independent of cancer diagnosis included low education, comorbidities, obesity, smoking, lack of health insurance, and age.
Conclusion
FS in all incident cancer groups declined during the first year post-diagnosis, which could be due to intensive treatments. Targeting factors related to FS declines could improve health outcomes for patients with cancer.
Keywords: cancer survivorship, functional status, health-related quality of life, longitudinal studies
Introduction
The long-term impact of cancer on patients' lives is often assessed utilizing clinical endpoints such as remission and survival. However, these measures do not capture the impact of cancer on an individual's health-related quality of life (HRQoL). Studies have shown that the majority of patients value quality of life at least as much as they value length of life [1, 2]. Functional status (FS) is a component of overall HRQoL and is defined as the ability to perform self-care, self-maintenance and physical activities [3]. FS has been shown to predict survival in patients with lung cancer [4, 5]. Assessment of a person's FS can identify risk of frailty and mobility impairment that is independent of disease status, as well as the impact that a disease may have on a person's lifestyle, and provides a measure for a person's need for care [6-9]. Various instruments measure FS, either through self-report questionnaires or direct patient observation [6]. While a few recent studies measure HRQOL across the cancer continuum [10-12], most studies are limited to highly selected patient populations, have relatively short follow-up time, or assess measurements only after the diagnosis has occurred [13-15]. Little information is available about FS across the cancer continuum, especially the time leading up to a cancer diagnosis. To our knowledge, no studies are published that examine long-term follow-up of FS trajectories among multiple incident cancer types, pre- and post-cancer event.
In the present study, we used data from a large community-based cohort study, to quantify trajectories of self-reported FS pre- and post-diagnosis of incident cancer, trajectories of FS among cancer-free individuals, and factors affecting change in FS.
Materials and Methods
Participants
The Atherosclerosis Risk in Communities (ARIC) study was established through probability sampling of four communities: Forsyth County, North Carolina; Jackson, Mississippi; suburbs of Minneapolis, Minnesota; and Washington County, Maryland [16]. This prospective cohort of 15,792 men and women, aged 45-64 years at initial exam (1987-1989) has been followed through ongoing event surveillance, annual follow-up telephone interviews and in-person examinations. Efforts were made in ARIC study recruitment to ensure cohort representativeness [17], and annual follow-up response rates were at least 90% [18].
FS was measured during annual telephone interviews conducted during the years 1992-2005. Due to staggered enrollment over a three year period, the initiation of the FS measure was also completed over a three year period from 1992-1995. Therefore, we created a three-year, 1992-1995, baseline for this specific analysis.
From the group of 14,809 ARIC study members with known FS measures at baseline, we excluded those with self-reported race other than white or black (n=47), blacks residing in the Minnesota or Maryland study communities (n=46), participants with prevalent cancer (reported by self, cancer registry, or medical records as being diagnosed with cancer prior to the 1992-1995 FS baseline, n=1,232), participants with incident cancer other than lung, female breast, prostate, or colorectal cancer (n=891), individuals with an unclear date of cancer diagnosis (n=3), and one individual with a diagnosis of two incident cancers on the same date (n=1). The final cohort for this analysis included 12,589 participants with a mean follow-up time of 12.9 (range 1-15) years. This study was approved by the Institutional Review Boards of the participating institutions.
FS Measurement
Self-reported FS was assessed using a modified Rosow-Breslau questionnaire[19], which has been shown to have concurrent validity with Katz Activity of Daily Living Scale [20] (Pearson r=0.47) and Spector hierarchical scale of instrumental and basic activities of daily living scale [21] (Pearson r=0.73) [22]. Test-retest reliability was assessed using a Pearson correlation coefficient (Pearson r=0.81) [23]. The modified Rosow-Breslau questionnaire consisted of five questions, two of which had two-parts (Table 1). Scores were summed, ranging from 0-5. Then the mean score was calculated by dividing by 5. Finally, the mean score was multiplied by 100, giving a range from 0 (worst) -100 (best). Factor analysis results confirmed that these items measured one underlying factor of FS, which accounted for approximately 77% of the covariance observed among the data.
Table 1.
Functional status questions, response options, and scoring: The ARIC Study, 1992-2005.
| Response and Score | ||
|---|---|---|
|
| ||
| Yes | No | |
|
|
|
|
| 1. Are you able to do heavy work around the house, like shoveling snow or washing windows, walls or floors without help? | 1 | 0 |
|
| ||
| 2. Are you able to walk up and down stairs to the second floor without help? | 1 | 0 |
|
| ||
| 3. Are you able to walk half a mile without help? That's about 8 ordinary blocks. | 1 | 0 |
|
| ||
| 4. Are you able to go to work? (If no, skip question 4a) | 0.5 | 0 |
|
| ||
| 4a. During the past 4 weeks have you missed work for at least half a day because of your health?a | 0 | 0.5 |
|
| ||
| 5. Are you able to do your usual activities, such as work around the house or recreation? (If no, skip question 5a) | 0.5 | 0 |
|
| ||
| 5a. During the past 4 weeks have you had to cut down on your usual activities (such as work around the house or recreation) for half a day or more because of health?a | 0 | 0.5 |
If a participant skips this question due to responding “No” to question 4 or 5, they receive a score of 0 for question 4a or 5a.
In-person interviews and annual telephone follow-ups provided 162,564 potential FS observations. There were 39,912 FS measurements missing (26.4%). For the calendar years 1992-1998, the FS questions were not administered annually. We imputed the values for missing FS scores for up to three consecutive years using the average of the individual participant's previous and subsequent year of known FS scores. After 1998, FS was ascertained annually through 2005, with imputation conducted only when an observation was missing for one year and complete FS scores were available for both the previous and subsequent year of follow-up [12]. As a result, approximately eighty-seven percent (N=34,643) of the missing observations were imputed, for a total of 157,295 FS observations. If FS was missing and unable to be imputed, the observation remained missing in the analysis. We assigned a zero for the missing FS value occurring during the year in which the cohort member died. All analyses were run with and without imputation; no differences in estimates were noted between the two methods and only the imputed data results are presented.
Cancer Ascertainment
Incident cancer among ARIC cohort members occurring between January 1, 1987, and December 31, 2005, was ascertained by two methods: linkage to state cancer registries and/or medical record review [16, 24]. For this analysis, a diagnosis of incident cancer was a cancer diagnosis between FS baseline (1992-1995) and the end of study follow-up (2005). Only the first cancer diagnosis was included in this analysis for individuals with multiple cancer diagnoses. We analyzed FS among participants who were cancer-free throughout the study period (N=11,155), and who developed lung (N=303), female breast (N=374), prostate (N=529), and colorectal cancer (N=228). A sensitivity analysis, whereby individuals with a secondary cancer diagnosis were excluded, did not substantially alter our results. As we could not determine if the secondary cancer diagnosis was a recurrence, metastasis, or new primary cancer, we did not exclude individuals with a secondary diagnosis from our analyses.
An “event” was defined as the date of cancer diagnosis for the cases. Members of the cancer-free group were assigned an “event” date using a random number generator [12, 25]. The first allowed event date was the baseline interview date, and the last allowed event date was the date of death or December 31, 2005, whichever came first. The distribution of cancer diagnoses and cancer-free “events” were similar during follow-up (data not shown). FS trajectories (pre- and post-event) for the patients with cancer were compared to the cancer-free group to determine if these trajectories differed from what is expected due to cancer-free aging. In an attempt to define clinically relevant time intervals, we examined the following event time periods: pre-event, within one year post-event, within five years post-event, and more than five years post-event.
Covariate Measurement and Categorization
Factors influencing pre- and post-event FS trajectories were of interest. Age at the time of the annual follow-up was centered at 65 years (average age of cancer diagnosis in the cohort), and gender and race/community were included in the analyses. Annual follow-up visits were categorized as pre-event (referent), within one year post-event, greater than one and less than five years post-event, or five years or more post-event. Variables assessed during the initial clinical examination included body mass index (BMI, kg/m2), classified into underweight (<18.5), normal (referent, 18.5-<25), overweight (25-<30) or obese (≥30); hypertension, present if systolic blood pressure ≥140 mmHg, diastolic blood pressure ≥90 mmHg, or if taking hypertensive medication within the previous two weeks; cardiovascular disease (CVD) including coronary heart disease, heart failure, or stroke determined through a combination of self-report at initial interview, medical record abstraction, and clinical diagnosis; self-reported chronic lung disease (chronic bronchitis, emphysema or asthma); self-reported diabetes; self-reported high cholesterol; any health insurance versus none; current, former, or never (referent) drinker; current, former, or never (referent) smoker; physical activity score, ranging from 1 (low) to 5 (high) for physical activity during leisure time [26]; educational attainment categorized as less than high school, high school graduate, and greater than high school (referent); and frequency of routine physical examination categorized as at least once a year (referent), at least once every five years, or less often than once every five years/no routine physicals. Period effects [1992-1999 and 2000-2005 (referent)] captured secular trends [27] that may influence the cancer-FS relationship, such as changes in health behaviors and disease treatments.
Statistical Analysis
FS trajectories were evaluated in two ways. First, we captured the FS of individuals surviving post-event by including observations through the year of a cohort member's death or year 2005, whichever came first (Model 1). Thus, individuals did not contribute information after death. Secondly, the FS of the entire cohort, not just the survivors, was captured through year 2005, by assigning a zero for each follow-up year occurring after the cohort members' death (Model 2). Model 2 resulted in an additional 9,033 observations being assigned a score of zero. Model 1 evaluates the impact of factors on FS among survivors, and Model 2 examines the factors associated with the FS among the entire cohort.
Cancer-specific FS, assessed three years pre-event through ten years post-event, was regressed at each year interval on study covariates to generate estimates of adjusted FS and standard errors (PROC GLM, SAS 9.2, Cary, NC) [28]. For FS changes occurring during the three years prior to event, one year post-event, and five years post-event, linear regression models were used to evaluate differences in FS and report 95% confidence intervals (95% CI) between the incident cancer groups and the cancer-free group adjusting for age. The change in age-adjusted FS between the year of the event and one year later was used to calculate how much of the one year post-event FS decline in the cohort was attributable to death.
We also fit individual unconditional linear growth models, accounting for repeated measures of FS (PROC MIXED, SAS 9.2, Cary, NC), to examine the associations between covariates and FS and to capture differences in FS changes among the four cancer groups and the referent cancer-free group adjusting for initial exam covariates. This model allows examination of longitudinal data on individuals over time, where the individual growth parameters are examined as random effects and covariates are entered as fixed effects to determine their impact on the dependent variable [29]. The variance-covariance matrix is unstructured.
To determine the fit of a linear model for the data, we examined plots of mean FS across age; the plots were linear. Therefore, the linear models were utilized for analysis. Tests of significance were two-sided, and a p-value of 0.05 was considered statistically significant. All analyses were conducted using SAS version 9.2 (SAS Institute, Cary, NC).
Results
As shown in Table 2, the cancer groups were older than the cancer-free group. Not accounting for age, the mean baseline FS score for the cancer-free group was 83.3, whereas lung cancer cases had the lowest average baseline FS score of 77.4. The proportion of current smokers and individuals with low educational attainment was similar between the cancer-free and cancer groups, with the exception of lung cancer. Not undergoing routine physical exams was more common in the lung cancer (37.7%) and prostate cancer (34.8%) groups than in the cancer-free group (32.8%). Colorectal cancer cases had the highest percentage of uninsured (13.2%).
Table 2.
Characteristics of participants (assessed at ARIC initial exam, 1987-1989): The ARIC Study.
| Cancer-free Group N=11,155 |
Incident Cancer | ||||
|---|---|---|---|---|---|
|
| |||||
| Lung Cancer N=303 |
Female Breast Cancer N=374 |
Prostate Cancer N=529 |
Colorectal Cancer N=228 |
||
|
|
|
|
|
|
|
| Agea | 53.6 (5.7) | 56.5 (5.6) | 54.4 (5.7) | 55.7 (5.6) | 55.3 (5.4) |
| Genderb | |||||
| Male | 4,765 (42.7) | 198 (65.3) | -- | 529 (100.0) | 118 (51.8) |
| Female | 6,390 (57.3) | 105 (34.7) | 374 (100.0) | -- | 110 (48.2) |
| Race/Communityb | |||||
| Black/NC | 335 (3.0) | 9 (3.0) | 12 (3.2) | 16 (3.0) | 4 (1.8) |
| Black/MS | 2,721 (24.4) | 54 (17.8) | 87 (23.3) | 155 (29.3) | 64 (28.1) |
| White/NC | 2,509 (22.5) | 82 (27.1) | 84 (22.5) | 109 (20.6) | 45 (19.7) |
| White/MN | 2,786 (25.0) | 68 (22.4) | 102 (27.3) | 130 (24.6) | 49 (21.5) |
| White/MD | 2,804 (25.1) | 90 (29.7) | 89 (23.8) | 119 (22.5) | 66 (28.9) |
| Body Mass Indexb | |||||
| Underweight | 91 (0.8) | 3 (1.0) | 2 (0.5) | 0 (0.0) | 2 (0.9) |
| Normal | 3,584 (32.2) | 126 (41.6) | 130 (34.9) | 139 (26.3) | 62 (27.2) |
| Overweight | 4,380 (39.3) | 111 (36.6) | 122 (32.8) | 250 (47.3) | 85 (37.3) |
| Obese | 3,083 (27.7) | 63 (20.8) | 118 (31.7) | 140 (26.5) | 79 (34.6) |
| Smokerb | |||||
| Current | 2,687 (24.1) | 202 (66.6) | 86 (23.0) | 105 (19.9) | 59 (25.9) |
| Former | 3,591 (32.2) | 85 (28.1) | 85 (22.7) | 244 (46.1) | 67 (29.4) |
| Never | 4,867 (43.7) | 16 (5.3) | 203 (54.3) | 180 (34.0) | 102 (44.7) |
| Drinkerb | |||||
| Current | 6,129 (55.2) | 194 (64.0) | 190 (51.1) | 318 (60.5) | 120 (52.9) |
| Former | 2,024 (18.2) | 69 (22.8) | 53 (14.2) | 122 (23.2) | 45 (19.8) |
| Never | 2,945 (26.5) | 40 (13.2) | 129 (34.7) | 86 (16.3) | 62 (27.3) |
| Educationb | |||||
| Less than HS | 2,549 (22.9) | 100 (33.0) | 87 (23.3) | 120 (22.7) | 61 (26.8) |
| HS or equivalent | 3,616 (32.5) | 110 (36.3) | 129 (34.5) | 140 (26.5) | 73 (32.0) |
| Greater than HS | 4,966 (44.6) | 93 (30.7) | 158 (42.2) | 269 (50.9) | 94 (41.2) |
| Baseline (1992-1995) functional statusa | 83.3 (22.8) | 77.4 (24.7) | 81.8 (21.7) | 85.4 (20.0) | 82.9 (22.8) |
| Comorbiditiesb | |||||
| CVD | 947 (8.5) | 36 (11.9) | 30 (8.0) | 41 (7.8) | 22 (9.6) |
| Chronic Lung Disease | 930 (8.4) | 50 (16.5) | 32 (8.6) | 36 (6.8) | 19 (8.4) |
| Hypertension | 3,745 (33.7) | 113 (37.5) | 139 (37.3) | 214 (40.7) | 88 (38.6) |
| Diabetes | 782 (7.1) | 16 (5.3) | 23 (6.2) | 29 (5.5) | 26 (11.4) |
| High Cholesterol | 2,294 (21.1) | 68 (23.4) | 78 (21.5) | 99 (19.1) | 50 (22.3) |
| Access to Careb | |||||
| No Health Insurance | 1,051 (9.4) | 29 (9.6) | 38 (10.2) | 48 (9.1) | 30 (13.2) |
| Physical Activity Scorea | 2.43 (0.80) | 2.37 (0.73) | 2.29 (0.77) | 2.57 (0.80) | 2.50 (0.81) |
| Freq. of Routine Examsb | |||||
| >Yearly | 4,815 (43.3) | 112 (3 7.1) | 175 (46.9) | 188 (35.5) | 90 (39.6) |
| >Every 5 year and <Yearly | 2,662 (23.9) | 76 (25.2) | 81 (21.7) | 157 (29.7) | 67 (29.5) |
| <Every 5 years/No routine exams | 3,650 (32.8) | 114 (37.7) | 117 (31.4) | 184 (34.8) | 70 (30.8) |
mean (sd)
n (%)
Figure 1 shows the mean age-adjusted FS scores among the four cancer groups and the cancer-free group pre- and post-event. The average FS scores three years prior to the event were highest in the prostate cancer group and lowest in the lung cancer group. In Model 1 (Figure 1A), mean FS for the prostate and breast cancer groups returned to roughly pre-event levels 4-7 years after diagnosis, but not for the lung and colorectal cancer groups. In Model 2 (Figure 1B), one year post-event FS remains stable (between follow-up years 1 and 2) among the prostate, breast, and colorectal groups followed by subsequent declines.
Figure 1.
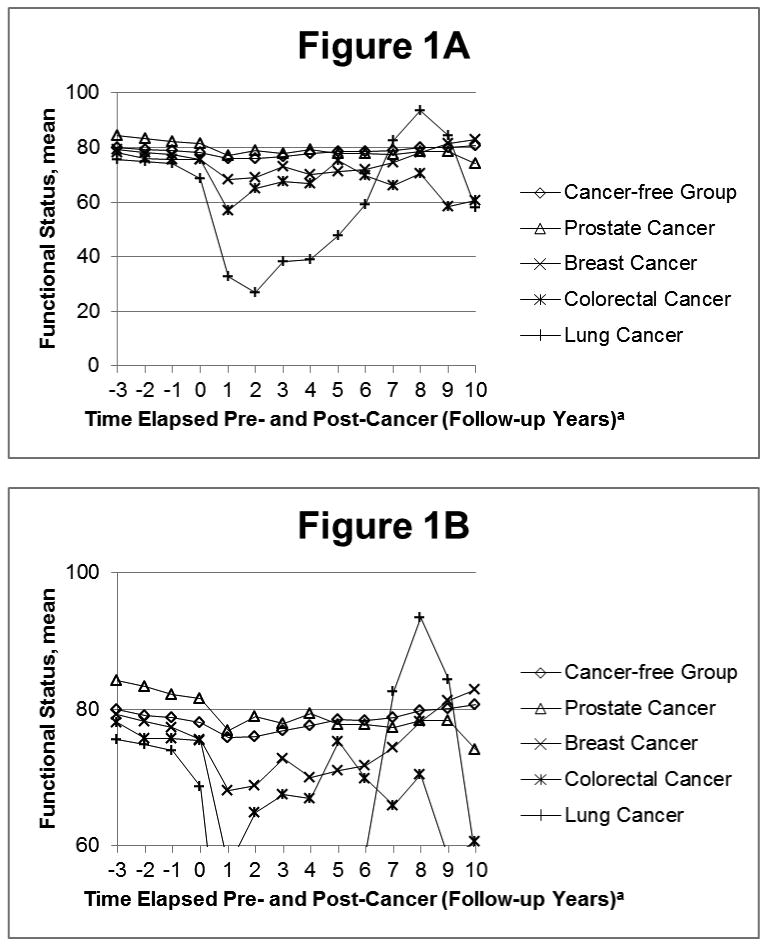
Trajectory of function status pre- and post-event in the Model 1, adjusted for age: The ARIC Study, 1992-2005.
aContact year 1 is considered the event follow-up. Event date occurs between contact years 0 and 1.
Table 3 examines FS declines among the cancer groups and the cancer-free group in Model 1. The largest average FS decline in the three years pre-event compared to the cancer-free group occurred in the lung cancer group (β=-3.64, p=0.002). For example, the average FS slope from three years before event up until event is 3.64 FS points less among the lung cancer group compared to the cancer-free group. Therefore, the FS is significantly lower in the lung cancer group than the cancer-free group leading up to event. Large, statistically significant (p<0.001) declines in FS score were noted among all cancer groups in the year following the cancer event. Within the first post-event year, the smallest average decline in FS score occurred among the prostate cancer group (β=-2.66), while the largest average decline occurred among the lung cancer group (β=-33.16). The percent decline in FS due to death within one year after event was 50.0% for lung, 24.5% for colorectal, 17.7% for breast, and 14.7% for prostate cancer. In the five-year post-event period, the largest average decline occurred among lung cancer cases (β=-19.86, P<0.0001) compared to the cancer-free group.
Table 3.
Difference between the slope of the cancer-free group and the incident cancer groups for pre- and post-cancer contact years, adjusted for age: The ARIC Study, 1992-2005.
| Within 3 years pre-event | Within 1 year post-event | Within 5 years post-event | ||||
|---|---|---|---|---|---|---|
|
| ||||||
| Estimate | 95% CI | Estimate | 95% CI | Estimate | 95% CI | |
|
|
|
|
||||
| Lung Cancer | -3.64* | -5.89, -1.39 | -33.16* | -35.22, -31.09 | -19.86* | -25.90, -13.82 |
| Female Breast | -1.79 | -3.78, 0.21 | -5.46* | -7.21, -3.70 | -3.17* | -6.01, -0.34 |
| Prostate Cancer | -0.18 | -1.84, 1.47 | -2.66* | -4.14, -1.18 | -3.60* | -6.04, -1.16 |
| Colorectal Cancer | -1.44 | -3.93, 1.05 | -16.12* | -18.39, -13.86 | -4.49 | -9.10, 0.12 |
Significant predictors (p<0.05).
Fitting an individual unconditional linear growth model to the data (Table 4), lung cancer (versus the cancer-free group) predicted a decrease of -4.76 and -2.36 points in FS score for Models 1 and 2, respectively, controlling for covariates. For example in Model 1, the average FS is 4.76 FS points less among the lung cancer group compared to the cancer-free group. Breast and colorectal cancer were also associated with FS decline, while prostate cancer was associated with an increased FS score for both Models 1 (1.88) and 2 (3.33). Both diabetes and CVD at initial exam were associated with a significantly decreased FS score, independent of the FS declines due to cancer diagnosis and aging. Other predictors of decreased FS score included other comorbidities, low educational attainment, obesity, smoking, lack of health insurance, and age.
Table 4.
Predictors of functional status: The ARIC Study, 1992-2005.
| Model 1 | Model 2 | |||
|---|---|---|---|---|
|
|
|
|||
| Estimate | 95% CI | Estimate | 95% CI | |
| Intercept | 82.72* | 81.08, 84.37 | 82.75* | 80.72, 84.78 |
| Cancer (vs. cancer-free) | ||||
| Lung | -4.76* | -7.04, -2.47 | -2.36 | -5.16, 0.45 |
| Female Breast | -2.28* | -4.25, -0.31 | -2.46* | -4.88, -0.03 |
| Prostate | 1.88* | 0.19, 3.57 | 3.33* | 1.24, 5.42 |
| Colorectal | -2.55* | -5.02, -0.08 | -2.31 | -5.36, 0.73 |
| Post-event (vs. pre-event)a | ||||
| 5+ years post-event | -5.24* | -5.68, -4.80 | -8.69* | -9.17, -8.20 |
| 1-5 years post-event | -3.16* | -3.43, -2.90 | -5.17* | -5.45, -4.88 |
| Diagnosis-1 year post-event | -3.69* | -3.97, -3.41 | -5.49* | -5.78, -5.20 |
| No Health Insurance (vs. Health Insurance) | -3.58* | -4.80, -2.37 | -4.17* | -5.67, -2.67 |
| Body Mass Index (vs. Normal) | ||||
| Obese | -4.76* | -5.67, -3.84 | -4.88* | -6.01, -3.76 |
| Overweight | -0.47 | -1.27, 0.34 | -0.89 | -1.88, 0.10 |
| Underweight | -4.73* | -8.59, -0.86 | -3.84 | -8.60, 0.92 |
| Smoker (vs. Never) | ||||
| Current | -5.26* | -6.16, -4.37 | -5.37* | -6.48, -4.27 |
| Former | -0.65 | -1.47, 0.17 | -0.30 | -1.31, 0.71 |
| Drinker (vs. Never) | ||||
| Current | -0.64 | -1.56, 0.27 | -1.20* | -2.33, -0.07 |
| Former | -1.30 | -2.37, -0.22 | -1.67* | -3.00, -0.35 |
| Educational Attainment (vs. Vocational, College, Grad school) | ||||
| High School or Less, no degree | -5.57* | -6.52, -4.62 | -5.12* | -6.29, -3.95 |
| High School Graduate | -2.30* | -3.08, -1.52 | -2.53* | -3.49, -1.57 |
| Physical Activity Score | 1.31* | 0.87, 1.74 | 1.25* | 0.71, 1.79 |
| Male (vs. Female) | 3.61* | 2.85, 4.37 | 3.83* | 2.88, 4.77 |
| Race/Community (vs. White/NC) | ||||
| Black/Mississippi | -3.48* | -4.56, -2.39 | -3.71* | -5.05, -2.38 |
| Black/North Carolina | -2.29* | -4.37, -0.21 | -2.53 | -5.09, 0.04 |
| White/Maryland | 1.89* | 0.90, 2.88 | 1.84* | 0.63, 3.06 |
| White/Minnesota | 2.60* | 1.61, 3.59 | 2.73* | 1.51, 3.95 |
| Period, 1992-1999 (vs. 2000-2005) | -0.55* | -0.79, -0.30 | -0.17 | -0.42, 0.09 |
| Cardiovascular Disease | -9.95* | -11.21, -8.68 | -9.51* | -11.07, -7.95 |
| Chronic lung disease | -4.67* | -5.88, -3.47 | -4.65* | -6.13, -3.17 |
| Hypertension | -3.31* | -4.08, -2.55 | -2.93* | -3.87, -1.99 |
| Diabetes | -11.00* | -12.37, -9.62 | -10.81* | -12.49, -9.12 |
| High Cholesterol | -1.26* | -2.09, -0.42 | -1.44* | -2.47, -0.41 |
| Physical Exam (vs. routine physical at least once a year) | ||||
| No routine physical exams | 1.49* | 0.68, 2.31 | 1.59* | 0.59, 2.59 |
| Physical exam at least every 5 years | 1.18* | 0.31, 2.05 | 0.85 | -0.22, 1.92 |
| Age, centered at 65 | -1.15* | -1.20, -1.10 | -1.32* | -1.39, -1.25 |
Significant predictors (p<0.05).
Each member of the cancer-free group was assigned a random “event” date [25].
Discussion
To date most HRQoL studies have data on individuals with cancer cross-sectionally or post-diagnosis only [13-15]. The novel contribution of this study is utilization of long-term data on both pre- and post-diagnosis FS trajectories for four cancer types and a cancer-free group of individuals from the same US-based cohort. These findings illustrate that the overall impact of cancer in the population is underestimated if only examined among survivors, although the extent of underestimation varies by cancer type. Overall, FS trajectories decline dramatically within one year after cancer diagnosis. Other predictors of decreased FS score included low educational attainment, comorbidities, obesity, smoking, lack of health insurance, and age. The current study also analyzed data separately for survivors (Model 1) and contrasted results to a model in which we attempted to capture FS of the entire cohort overall by including observations for members who were deceased (assigning a FS score of 0; Model 2). We observed a lower impact of cancer on FS in Model 1 as compared to Model 2. To our knowledge, this is the first report that examines FS among patients with lung, breast, prostate, and colorectal cancer utilizing both analysis strategies.
Our study is in accord with two other longitudinal studies which examined self-rated health [25, 30]. We believe the FS decline in the cancer-free group is representative of usual health declines associated with aging. All cancer groups showed greater pre-event decline in FS score than the cancer-free group. This highlights a need for routine assessment of functional status by primary care physicians, which would allow declines in functional status to be addressed earlier to help preserve function. As patients with lung cancer had significant declines in functional status in the three years pre-event, compared to the cancer-free participants, monitoring of functional status could be particularly important for individuals at high-risk for lung cancer (e.g., current and former smokers). The post-event decline in the cancer-free group may be explained by post-event deaths and decline due to aging and comorbidities. We observed the largest decreases in FS occur within the first year of cancer diagnosis, when most patients with cancer are undergoing treatment that can be invasive (e.g., surgery) or have severe side effects (e.g., associated with chemotherapy or radiation). As individuals complete treatment during the first year post-diagnosis, the side effects of treatment begin to resolve. We could not directly test this hypothesis, however, as information on courses of treatment are not available. The steep post-event decline is also partially attributable to deaths within one year after the event; the percentage drop from death within one year after event ranged from 14.7% for prostate cancer to 50.0% for lung cancer. The higher percentage drop due to death among those with lung cancer is expected, as the overall five-year survival is much lower for lung than for prostate cancer [31]. Participants with lung and colorectal cancer did not return to their pre-event levels of FS after cancer diagnosis in Model 1. This is likely due to mortality or decreased physical health status due to disease.
In Model 1, study participants who survived five or more years post-event began to return to levels of FS similar to their pre-event FS levels. As long-term cancer survivors' FS begins to increase, interventions to help them return to their pre-cancer FS more quickly could be advantageous. Model 2 shows continual declines in FS for ARIC cancer participants and poorer long-term FS for participants with cancer than the cancer-free group due to all-cause mortality. Specifically, this model shows which cancers have the worst overall post-diagnosis FS (i.e., lung and colorectal) when accounting for mortality. Clinically meaningful decline for the FS scale that we utilized have not been formally assessed. However, a recent study reported clinically meaningful differences of 2-3 points for another FS scale [32]. A diagnosis of lung, breast, or colorectal cancer was associated with a FS score that was lower than the FS score in the cancer-free group. Prostate cancer was not associated with a lower FS score. This may be due to the fact that a majority of prostate cancers are diagnosed via prostate-specific antigen screening (PSA), which leads to earlier diagnosis and possibly overdiagnosis [33]. Many of these patients exhibit no symptoms at the time of diagnosis; therefore prostate cancer diagnosis would have less impact on FS. Breast and colorectal cancer also have wide-spread screening programs, but overdiagnosis is thought to be most prevalent in prostate cancer [34]. Additionally, unlike many other cancer types, prostate cancer is frequently treated with watchful waiting or active surveillance [35]. Thus, participants with prostate cancer are less likely than the other cancer types to receive surgery, chemotherapy, or radiation, which were hypothesized to account for much of the decline in functional status, particularly in the first year post-diagnosis.
Other comorbidity predictors of decreased FS that are independent of cancer diagnosis included diabetes, CVD, and chronic lung disease. Diabetes has been associated with impaired FS [36]. This could be in part due to higher CVD among patients with diabetes [37]. Both CVD and chronic lung disease have been shown to impact FS by reducing patients' ability to perform activities that require a high aerobic capacity [38, 39]. Targeting these comorbidities, which are related to declines in FS both pre- and post-event, could improve health outcomes, specifically HRQoL, for patients with cancer.
These results are limited by lack of cancer stage and grade, time-varying covariates, and lagged baseline. FS trajectories may differ by stage and grade, with later stage and higher grade tumors potentially having greater initial post-diagnosis declines partially due to higher mortality rates and more aggressive treatments. However, a study of patients with lung cancer failed to find an association between initial tumor stage and self-reported HRQoL [40]. Additionally, we utilized covariates assessed at ARIC study initial exam, and we did not account for time-varying covariates. Future studies should examine the effects of cancer on FS accounting for tumor stage and grade and time-varying covariates. Finally, FS was not assessed until 1992, and the ARIC study began in 1987. Therefore, the participants in this analysis might be healthier, as they had to survive at least five years to be included in this analysis. In another analysis of the ARIC cancer cohort examining the impact of self-rated health, which was measured from initial exam in 1987, results were similar [30]. Thus, we think it is unlikely that the lagged baseline biased our results.
While FS is a good indicator of ability to perform self-care, self-maintenance and physical activities, the ARIC study did not collect annual measurements of other HRQOL domains. Therefore, the extent to which FS is associated with physical or mental health cannot be ascertained. Additionally, the measure of FS utilized in the ARIC cohort was focused on physical functioning and does not encompass all activities of daily living, such as bathing, dressing, toileting, transferring, continence, and feeding [3, 20]. Other FS measures are often more narrow in scope, focusing on one particular aspect of functional disability, or are so comprehensive that they are prohibitive to use due to time constraints in a large study, such as ARIC [41].
This study uses the ARIC cohort data, which is a large, observational, community-based study with information on long-term follow-up with information on covariates and comorbidities. Using data from this cohort for our analysis allows us to examine the changes and trajectories of FS for participants living with cancer compared to the cancer-free group. Additionally, the health history in the ARIC cohort identified important conditions (e.g., CVD and diabetes) that showed comparable or more severe effects on FS than a cancer diagnosis. By imputing missing FS values, overestimation of the association may be avoided and provide a more complete picture of FS [25]. Lastly, longitudinal data on health history allowed us to exclude prevalent cancer at baseline that could downwardly bias FS trajectories for incident cancer.
In conclusion, most patients diagnosed with cancer can expect declines in FS in the year after their diagnosis, but among long-term cancer survivors, FS begins to return to pre-cancer levels. The degree of decline varies by cancer type and could be affected by comorbidities. Addressing comorbidities that have significant impact on FS should be examined as factors potentially influencing treatment decisions. Targeting factors related to declines in FS both pre- and post-event could improve health outcomes, specifically HRQoL, for patients with cancer.
Figure 2.
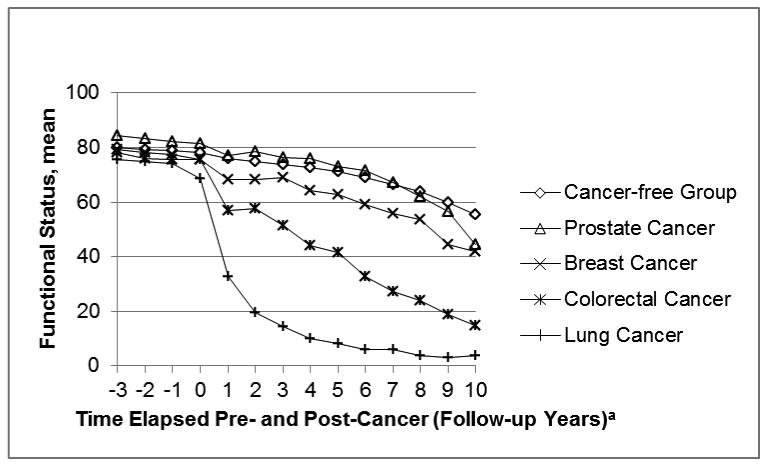
Trajectory of function status pre- and post-event in the Model 2, adjusted for age: The ARIC Study, 1992-2005.
aContact year 1 is considered the event follow-up. Event date occurs between contact years 0 and 1.
Acknowledgments
The Atherosclerosis Risk in Communities Study is carried out as a collaborative study supported by National Heart, Lung, and Blood Institute contracts (HHSN268201100005C, HHSN268201100006C, HHSN268201100007C, HHSN268201100008C, HHSN268201100009C, HHSN268201100010C, HHSN268201100011C, and HHSN268201100012C). Studies on cancer in ARIC are also supported by the National Cancer Institute (U01 CA164975-01). The content of this work is solely the responsibility of the authors and does not necessarily represent the official views of the National Institutes of Health.
The authors thank the staff and participants of the ARIC study for their important contributions. Cancer incidence data have been provided by the Maryland Cancer Registry, Center for Cancer Surveillance and Control, Department of Mental Health and Hygiene, 201 W. Preston Street, Room 400, Baltimore, MD 21201. We acknowledge the State of Maryland, the Maryland Cigarette Restitution Fund, and the National Program of Cancer Registries (NPCR) of the Centers for Disease Control and Prevention (CDC) for the funds that helped support the availability of the cancer registry data.
Abbreviations
- FS
functional status
- HRQoL
health-related quality of life
- ARIC
Atherosclerosis Risk in Communities
- BMI
body mass index
- CVD
cardiovascular disease
Footnotes
Disclosures and Conflict of Interest Statements: None of the authors have a conflict of interest to report.
Author Contributions: Study Concept and Design: J. Petrick, B. Reeve, A. Kucharska-Newton, R. Foraker, E. Platz, S. Stearns, X. Han, B. Windham, D. Irwin
Data Acquisition: A. Kucharska-Newton
Quality Control of Data: J. Petrick, B. Reeve
Data Analysis and Interpretation: J. Petrick, B. Reeve, A. Kucharska-Newton, R. Foraker, D. Irwin
Manuscript Preparation, Editing, and Review: J. Petrick, B. Reeve, A. Kucharska-Newton, R. Foraker, E. Platz, S. Stearns, X. Han, B. Windham, D. Irwin.
Publisher's Disclaimer: This is a PDF file of an unedited manuscript that has been accepted for publication. As a service to our customers we are providing this early version of the manuscript. The manuscript will undergo copyediting, typesetting, and review of the resulting proof before it is published in its final citable form. Please note that during the production process errors may be discovered which could affect the content, and all legal disclaimers that apply to the journal pertain.
References
- 1.Meropol NJ, Egleston BL, Buzaglo JS, Benson AB, 3rd, Cegala DJ, Diefenbach MA, et al. Cancer patient preferences for quality and length of life. Cancer. 2008 Dec 15;113(12):3459–66. doi: 10.1002/cncr.23968. Randomized Controlled Trial Research Support, N.I.H., Extramural. [DOI] [PMC free article] [PubMed] [Google Scholar]
- 2.Silvestri G, Pritchard R, Welch HG. Preferences for chemotherapy in patients with advanced non-small cell lung cancer: descriptive study based on scripted interviews. Bmj. 1998 Sep 19;317(7161):771–5. doi: 10.1136/bmj.317.7161.771. [DOI] [PMC free article] [PubMed] [Google Scholar]
- 3.Newcomer RJ, Wilkinson AM, Lawton MP, editors. Focus on Managed Care and Quality Assurance: Integrating Acute and Chronic Care. New York: Springer; 1996. [Google Scholar]
- 4.Buccheri G, Ferrigno D, Tamburini M. Karnofsky and ECOG performance status scoring in lung cancer: a prospective, longitudinal study of 536 patients from a single institution. Eur J Cancer. 1996 Jun;32A(7):1135–41. doi: 10.1016/0959-8049(95)00664-8. Comparative Study. [DOI] [PubMed] [Google Scholar]
- 5.Maione P, Perrone F, Gallo C, Manzione L, Piantedosi F, Barbera S, et al. Pretreatment quality of life and functional status assessment significantly predict survival of elderly patients with advanced non-small-cell lung cancer receiving chemotherapy: a prognostic analysis of the multicenter Italian lung cancer in the elderly study. J Clin Oncol. 2005 Oct 1;23(28):6865–72. doi: 10.1200/JCO.2005.02.527. Multicenter Study Research Support, Non-U.S. Gov't. [DOI] [PubMed] [Google Scholar]
- 6.Garman KS, Cohen HJ. Functional status and the elderly cancer patient. Crit Rev Oncol Hematol. 2002 Sep;43(3):191–208. doi: 10.1016/s1040-8428(02)00062-8. Review. [DOI] [PubMed] [Google Scholar]
- 7.Lunney JR, Lynn J, Foley DJ, Lipson S, Guralnik JM. Patterns of functional decline at the end of life. Jama. 2003 May 14;289(18):2387–92. doi: 10.1001/jama.289.18.2387. Research Support, U.S. Gov't, P.H.S. [DOI] [PubMed] [Google Scholar]
- 8.Haas S. Trajectories of functional health: the ‘long arm’ of childhood health and socioeconomic factors. Soc Sci Med. 2008 Feb;66(4):849–61. doi: 10.1016/j.socscimed.2007.11.004. Research Support, Non-U.S. Gov't. [DOI] [PubMed] [Google Scholar]
- 9.Saltzman S. Geriatrics Resource Guide. Galter Health Sciences Library; 1999. Functional Status Assessment. [Google Scholar]
- 10.Reeve BB, Potosky AL, Smith AW, Han PK, Hays RD, Davis WW, et al. Impact of cancer on health-related quality of life of older Americans. J Natl Cancer Inst. 2009 Jun 16;101(12):860–8. doi: 10.1093/jnci/djp123. Comparative Study Multicenter Study Research Support, N.I.H., Extramural Research Support, U.S. Gov't, P.H.S. [DOI] [PMC free article] [PubMed] [Google Scholar]
- 11.Reeve BB, Stover AM, Jensen RE, Chen RC, Taylor KL, Clauser SB, et al. Impact of diagnosis and treatment of clinically localized prostate cancer on health-related quality of life for older Americans: A population-based study. Cancer. 2012 Apr 27; doi: 10.1002/cncr.27578. [DOI] [PMC free article] [PubMed] [Google Scholar]
- 12.Foraker RE, Rose KM, Chang PP, McNeill AM, Suchindran CM, Selvin E, et al. Socioeconomic status and the trajectory of self-rated health. Age Ageing. 2011 Nov;40(6):706–11. doi: 10.1093/ageing/afr069. Research Support, N.I.H., Extramural. [DOI] [PMC free article] [PubMed] [Google Scholar]
- 13.Staren ED, Gupta D, Braun DP. The prognostic role of quality of life assessment in breast cancer. Breast J. 2011 Nov-Dec;17(6):571–8. doi: 10.1111/j.1524-4741.2011.01151.x. Research Support, Non-U.S. Gov't. [DOI] [PubMed] [Google Scholar]
- 14.Osthus AA, Aarstad AK, Olofsson J, Aarstad HJ. Health-related quality of life scores in long-term head and neck cancer survivors predict subsequent survival: a prospective cohort study. Clin Otolaryngol. 2011 Aug;36(4):361–8. doi: 10.1111/j.1749-4486.2011.02342.x. Comparative Study Research Support, Non-U.S. Gov't. [DOI] [PubMed] [Google Scholar]
- 15.Gray NM, Hall SJ, Browne S, Macleod U, Mitchell E, Lee AJ, et al. Modifiable and fixed factors predicting quality of life in people with colorectal cancer. Br J Cancer. 2011 May 24;104(11):1697–703. doi: 10.1038/bjc.2011.155. [DOI] [PMC free article] [PubMed] [Google Scholar]
- 16.The Atherosclerosis Risk in Communities (ARIC) Study: design and objectives. The ARIC investigators. Am J Epidemiol. 1989 Apr;129(4):687–702. Research Support, U.S. Gov't, P.H.S. [PubMed] [Google Scholar]
- 17.Shimakawa T, Sorlie P, Carpenter MA, Dennis B, Tell GS, Watson R, et al. Dietary intake patterns and sociodemographic factors in the atherosclerosis risk in communities study. ARIC Study Investigators. Prev Med. 1994 Nov;23(6):769–80. doi: 10.1006/pmed.1994.1133. Research Support, U.S. Gov't, P.H.S. [DOI] [PubMed] [Google Scholar]
- 18.Atherosclerosis Risk in Communities Study: Follow Up Response Rates. 2013 [2/1/2014]; Available from: http://www2.cscc.unc.edu/aric/system/files/UC641701.pdf.
- 19.Rosow I, Breslau NA. Guttman health scale for the aged. J Gerontol. 1966 Oct;21(4):556–9. doi: 10.1093/geronj/21.4.556. [DOI] [PubMed] [Google Scholar]
- 20.Katz S, Downs TD, Cash HR, Grotz RC. Progress in development of the index of ADL. Gerontologist. 1970 Spring;10(1):20–30. doi: 10.1093/geront/10.1_part_1.20. [DOI] [PubMed] [Google Scholar]
- 21.Spector WD, Katz S, Murphy JB, Fulton JP. The hierarchical relationship between activities of daily living and instrumental activities of daily living. J Chronic Dis. 1987;40(6):481–9. doi: 10.1016/0021-9681(87)90004-x. Research Support, Non-U.S. Gov't Research Support, U.S. Gov't, P.H.S. [DOI] [PubMed] [Google Scholar]
- 22.Reuben DB, Siu AL. An objective measure of physical function of elderly outpatients. The Physical Performance Test. J Am Geriatr Soc. 1990 Oct;38(10):1105–12. doi: 10.1111/j.1532-5415.1990.tb01373.x. Research Support, Non-U.S. Gov't Research Support, U.S. Gov't, P.H.S. [DOI] [PubMed] [Google Scholar]
- 23.Smith LA, Branch LG, Scherr PA, Wetle T, Evans DA, Hebert L, et al. Short-term variability of measures of physical function in older people. J Am Geriatr Soc. 1990 Sep;38(9):993–8. doi: 10.1111/j.1532-5415.1990.tb04422.x. Research Support, U.S. Gov't, P.H.S. [DOI] [PubMed] [Google Scholar]
- 24.Kucharska-Newton AM, Rosamond WD, Mink PJ, Alberg AJ, Shahar E, Folsom AR. HDL-cholesterol and incidence of breast cancer in the ARIC cohort study. Ann Epidemiol. 2008 Sep;18(9):671–7. doi: 10.1016/j.annepidem.2008.06.006. Multicenter Study Research Support, N.I.H., Extramural. [DOI] [PMC free article] [PubMed] [Google Scholar]
- 25.Diehr P, Williamson J, Patrick DL, Bild DE, Burke GL. Patterns of Self-Rated Health in Older Adults Before and After Sentinel Health Events. Journal of the American Geriatrics Society. 2001;49(1):36–44. doi: 10.1046/j.1532-5415.2001.49007.x. [DOI] [PubMed] [Google Scholar]
- 26.Baecke JA, Burema J, Frijters JE. A short questionnaire for the measurement of habitual physical activity in epidemiological studies. Am J Clin Nutr. 1982 Nov;36(5):936–42. doi: 10.1093/ajcn/36.5.936. Research Support, Non-U.S. Gov't. [DOI] [PubMed] [Google Scholar]
- 27.Rice NE, Lang IA, Henley W, Melzer D. Baby boomers nearing retirement: the healthiest generation? Rejuvenation Res. 2010 Feb;13(1):105–14. doi: 10.1089/rej.2009.0896. Research Support, Non-U.S. Gov't. [DOI] [PubMed] [Google Scholar]
- 28.Littell RC, Stroup WW, Freund RJ. SAS for linear models. 4th. Cary, NC, USA: SAS Institute; 2002. [Google Scholar]
- 29.Johnson M. Individual Growth Analysis Using PROC MIXED. Vol. 27 SAS User Group International; 2002. [Google Scholar]
- 30.Petrick JL, Foraker RE, Kucharska-Newton AM, Reeve BB, Platz EA, Stearns SC, et al. Trajectory of Self-Rated Health and Factors Contributing to Self-Rated Health Declines among Cancer Survivors. 2013 Unpublished Results. [Google Scholar]
- 31.Howlader N, N A, Krapcho M, Neyman N, Aminou R, Altekruse SF, Kosary CL, Ruhl J, Tatalovich Z, Cho H, Mariotto A, Eisner MP, Lewis DR, Chen HS, Feuer EJ, Cronin KA, editors. SEER Cancer Statistics Review, 1975-2009 (Vintage 2009 Populations) National Cancer Institute; Bethesda, MD: [Google Scholar]
- 32.King MB, Judge JO, Whipple R, Wolfson L. Reliability and responsiveness of two physical performance measures examined in the context of a functional training intervention. Phys Ther. 2000 Jan;80(1):8–16. Clinical Trial Controlled Clinical Trial Research Support, Non-U.S. Gov't Research Support, U.S. Gov't, P.H.S. [PubMed] [Google Scholar]
- 33.Brawley OW. Prostate cancer epidemiology in the United States. World J Urol. 2012 Apr;30(2):195–200. doi: 10.1007/s00345-012-0824-2. Review. [DOI] [PubMed] [Google Scholar]
- 34.Welch HG, Black WC. Overdiagnosis in cancer. J Natl Cancer Inst. 2010 May 5;102(9):605–13. doi: 10.1093/jnci/djq099. Research Support, U.S. Gov't, Non-P.H.S. Review. [DOI] [PubMed] [Google Scholar]
- 35.Holmberg L, Van Hemelrijck M. The biology and natural history of prostate cancer: a short introduction. Recent Results Cancer Res. 2014;202:1–7. doi: 10.1007/978-3-642-45195-9_1. [DOI] [PubMed] [Google Scholar]
- 36.de Grauw WJ, van de Lisdonk EH, Behr RR, van Gerwen WH, van den Hoogen HJ, van Weel C. The impact of type 2 diabetes mellitus on daily functioning. Fam Pract. 1999 Apr;16(2):133–9. doi: 10.1093/fampra/16.2.133. Multicenter Study Research Support, Non-U.S. Gov't. [DOI] [PubMed] [Google Scholar]
- 37.de Grauw WJ, van de Lisdonk EH, van den Hoogen HJ, van Weel C. Cardiovascular morbidity and mortality in type 2 diabetic patients: a 22-year historical cohort study in Dutch general practice. Diabet Med. 1995 Feb;12(2):117–22. doi: 10.1111/j.1464-5491.1995.tb00441.x. Comparative Study Research Support, Non-U.S. Gov't. [DOI] [PubMed] [Google Scholar]
- 38.Ettinger WH, Jr, Fried LP, Harris T, Shemanski L, Schulz R, Robbins J. Self-reported causes of physical disability in older people: the Cardiovascular Health Study. CHS Collaborative Research Group. J Am Geriatr Soc. 1994 Oct;42(10):1035–44. doi: 10.1111/j.1532-5415.1994.tb06206.x. Comparative Study. [DOI] [PubMed] [Google Scholar]
- 39.Peruzza S, Sergi G, Vianello A, Pisent C, Tiozzo F, Manzan A, et al. Chronic obstructive pulmonary disease (COPD) in elderly subjects: impact on functional status and quality of life. Respir Med. 2003 Jun;97(6):612–7. doi: 10.1053/rmed.2003.1488. [DOI] [PubMed] [Google Scholar]
- 40.Grutters JP, Joore MA, Wiegman EM, Langendijk JA, de Ruysscher D, Hochstenbag M, et al. Health-related quality of life in patients surviving non-small cell lung cancer. Thorax. 2010 Oct;65(10):903–7. doi: 10.1136/thx.2010.136390. Multicenter Study. [DOI] [PubMed] [Google Scholar]
- 41.Jette AM, Davies AR, Cleary PD, Calkins DR, Rubenstein LV, Fink A, et al. The Functional Status Questionnaire: reliability and validity when used in primary care. J Gen Intern Med. 1986 May-Jun;1(3):143–9. doi: 10.1007/BF02602324. Research Support, Non-U.S. Gov't. [DOI] [PubMed] [Google Scholar]