Abstract
Blast overpressure (OB) injury in rodents has been employed for modeling the traumatic brain injury (TBI) induced by an improvised explosive device (IED) in military service personnel. IED’s can cause respiratory arrest if directed at the thorax due to the fluid-tissue interface of the lungs but it is unclear what respiratory changes occur in a head-directed OB injury. The diaphragm is the primary muscle of inspiration and electromyographic (EMG) recordings from this muscle are used for recording breathing in anesthetized and conscious rats. The breathing pattern of the rodents will be recorded during the OB injury. Our results indicate that a dorsal directed closed head OB injury results in a neurally mediated apnea followed by respiratory timing changes.
Keywords: Overpressurization blast, traumatic brain injury, respiration, electromyographic recording
Introduction
Traumatic brain injury (TBI) affects 1.7 million people annually in the United States (Faul M, 2010). The CDC reports that TBI rates are higher for males than females in every age group. Soldiers in combat are most susceptible to sustain a TBI as a result of an overpressure blast (OB) wave from an improvised explosive device (IED). Overpressure wave causes damage to air-filled organs and air-fluid interfaces due to the interaction between the stress wave and shear wave (Guy et al., 1998a). Blast directed and localized to the dorsal surface of the head between bregma and lambda induces closed-head TBI if the pressure force is of sufficient magnitude. Closed-head OB injuries send shearing and stressing forces throughout the brain including the brainstem resulting in observational disruptions in breathing. TBI with body protection is known to result in observational apneic periods in rodent models (Cheng et al., 2010; Dixon et al., 1987; Guy et al., 1998b; Kuehn et al., 2011). These apneas may result from neuronal disruption in the brainstem respiratory control center, transmission of the pressure force vector throughout the body via the cerebrospinal fluid and circulatory system or other unknown reasons. The OB TBI disruption of breathing is, however, not well understood, especially during OBI exposure, hence our primary goal is to determine the respiratory rhythm pattern during an OB TBI isolated to the head.
OB TBI
The OB wave is experimentally produced by a shock tube driven by compressed air. An OB wave directed at the skull of a rodent results in an OB TBI if the pressure is of sufficient magnitude. OB waves directed at the dorsal skull of a rat between bregma and lambda may cause apnea based on anecdotal evidence. The OB shock tube can generate a controlled pressure wave which can be replicated under experimental conditions. A shock tube was designed, constructed and tested by the Florida Institute of Technology at Banyan Biomarkers (see their Fig 1, A) (Svetlov et al., 2010). There are two sections of the shock tube separated by a metal diaphragm. The two sections include the gas at high pressure (driver) and the gas at low pressure (driven) separated by a diaphragm. At a predetermined threshold level, the diaphragm ruptures which generates a shock wave propagating through the low pressure section (driven) to the end of the shock tube. The peak and duration of the overpressure blast is determined by the driver/driven ratio, thickness and type of diaphragm material. Stainless steel diaphragms 0.05-mm thick with driver/driven ratio of 15 to 1 was used to produce the shock wave. An internal cutter was used to initialize the rupture of the diaphragm so the low pressure air mixes with the high-pressure gas resulting in a shock wave. The blast pressure waveform (Svetlov et al., 2010) has a peak overpressure and gas venting phase, believed to cause the most damage due to the prolonged time spent in this phase. The blast wave is 10 msec at variable Psi levels measured at the shock tube. The blast pressure data was acquired from piezoelectric blast pressure transducers.
Figure 1.
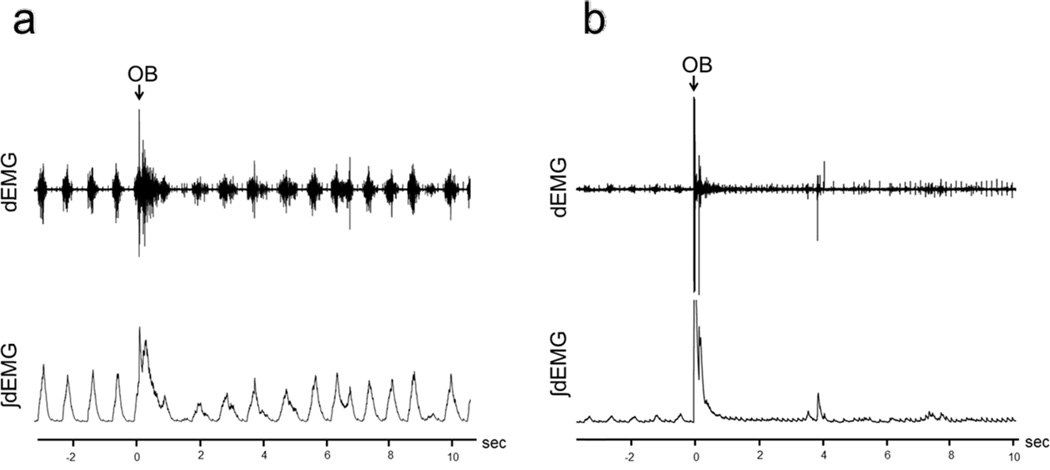
Recordings of raw (top trace) and ∫dEMG (bottom) for OB-1 animals.
a. dEMG in an OB-1, Group 1 animal, Psi=69.9.
b. dEMG in an OB-1, Group 2 animal, Psi=90.3.
When the animal is positioned directly under the shock tube nozzle, it is known as a composite blast. Composite blast exposure (directed at the skull) can result in diffuse brain injury and neurodegeneration in the rostral and caudal diencaphalon and mesencephalon (Svetlov et al., 2010). OB injury can also result in intracranial hematomas as well as brain swelling (Svetlov et al., 2010). Upon autopsy of the animals (5/27) that succumbed to blast injury, hematomas were found on the dorsal aspect of the brain between bregma and lambda along with evidence of a disruption of vascular supply within the circle of Willis. The kinectic force of the OB on the superficial and interior portion of the brain is evident when mortality occurred (Svetlov et al., 2010).
The OB blast injury is reproducible and causes significant damage throughout the brain as evidenced by gross inspection and histology (Svetlov et al., 2010). Observational disruptions in breathing have been seen in multiple rodent models during both closed and open head injuries (Cheng et al., 2010; Dixon et al., 1987; Guy et al., 1998b; Kuehn et al., 2011). However, breathing pattern immediately before, during and immediately after OB TBI remains unknown. Specifically, it is unknown if inspiratory motor drive ceases (apnea) during and after OB exposure. It is also unknown if there is a relationship between the magnitude of the OB and apnea. Further, the effect of repeated OB on apnea is unknown.
TBI and Respiration
Respiration is controlled both consciously and autonomically via the brainstem respiratory network. The respiratory control network receives afferent and efferent input and this information is processed to maintain homeostasis. Autonomic brainstem respiratory function is controlled by the pons and medulla. The pons and medulla have a network of respiratory neurons that generate the respiratory motor pattern. Inspiratory and expiratory neurons send axons to the inspiratory and expiratory motor units to provide the neuromuscular drive and breathing pattern. A disruption in this region can result in an absence of breathing (apnea) or an altered breathing pattern evidenced by gasping, sighs or irregularities in the breathing pattern. Apnea is defined as an absence in diaphragmatic muscle activity for a minimum of two respiratory cycles. Observational apneic periods have been seen in humans and animals during TBI. Changes in breathing patterns including apnea, partial recovery of respiration, followed by slow and deep respiration were observed in rodents during a skull-directed detonator blast (Cheng et al., 2010).
Apnea followed by a period of irregular breathing is believed to result from OB injury of sufficient magnitude but specific respiratory motor activity has not been recorded during OB exposure. It is likely that the respiratory control network is disrupted at the medullary level by the intracranial high pressure wave. Disruption within the respiratory network is hypothesized to result in an apneic period and the apneic duration may be a function of the magnitude of the pressure wave. It is also likely that the initial OB injury would cause this respiratory neural network to become hypersensitive to a second smaller magnitude OB, resulting in a longer apneic period. The present study will directly record diaphragm EMG (dEMG) during an OB to determine duration of the apneic period and subsequent irregular breathing pattern following the OB.
We hypothesized that blast-induced TBI: (1) will induce an apneic period during and immediately following blast exposure induced acute TBI directly related to the magnitude of the OB pressure wave; (2) will induce post-apnea irregular breathing pattern that is directly related to the magnitude of the OB pressure wave; (3) will induce apnea at lower pressures and longer durations with repeated OB injury (2 weeks after the first OB); and (4) will induce irregular breathing pattern directly related to magnitude of the second OB pressure wave with repeated OB injury (2 weeks after the first OB). To test these hypotheses, dEMG recordings were obtained in chronically instrumented rats immediately before, during and immediately after the dorsal head OB exposure.
Materials and Methods
Animals
These experiments were performed on male Sprague-Dawley rats weighing 250-300 grams. The animals were housed in the University of Florida animal care facility. They were exposed to a 12-hour light/12-hour dark cycle with food and water ad libitum. The experimental protocol was reviewed and approved by the Institutional Animal Care and Use Committee of the University of Florida.
Surgical Procedure
Animals were anesthetized using isoflurane. The abdominal wall was incised and costal borders retracted to expose the diaphragm muscle. dEMG electrodes (stainless steel, Teflon-coated wire AS631, Cooner Wire, Chatsworth, CA, USA) were introduced into the diaphragm at the intercostal border on the right side and advanced through the diaphragm muscle and glued securely into place with sterile VetBond. The wires were connected to a multi-wire harness and the connector was externalized at the dorsal surface between the scapulae. The abdominal cavity was sutured and animals recovered 5-7 days.
Chronic EMG Recording Methods
The dEMG signals were recorded from the diaphragm by attaching the external harness connector to a pre-amplifier which was led into an amplifier (gain: 100x) and band-pass filtered (100-1000 Hz). The signal was digitized using PowerLab and LabChart 7 Pro (ADInstruments).
The instrumented (dEMG electrodes) animals were randomized after the surgical recovery period into two experimental groups for the first OB exposure (OB-1); (Group 1) 68.6-73.1 Psi (n=7) and (Group 2) 82.9-102.6 Psi (n=15). On the day of the OB-1 procedure, the animals were anesthetized with isoflurane. The externalized electrode harness was connected to the pre-amplifier to record dEMG activity. The anesthetized animals were placed onto a flexible mesh surface with the dorsal surface of head positioned underneath the air nozzle. Body was protected with a plexiglass shield placed over the entire body leaving only the head exposed (Svetlov et al., 2010). dEMG activity was recorded for 5 minutes prior to OB exposure. Then a 10-msec duration OB (onset marked on the recording) was performed while dEMG was recorded continuously. The Psi was measured using piezoelectric blast pressure transducers. Post-OB-1, the dEMG activity was recorded for 3-5 minutes. The animals were then removed from anesthesia and returned to their cages. The second OB (OB-2) was presented 14 days post-OB-1. Instrumented (dEMG electrodes) animals were randomized into two OB-2 experimental groups; (Group 3) 66.5-71.5 Psi (n=6) and (Group 4) 86.7-94.0 (n=5). The OB-2 procedure was performed the same as the OB-1 procedure (see above).
Data Analysis
LabChart 7 Pro (ADInstruments) was used for analysis of the digitized dEMG activity. All data were analyzed off-line. The raw dEMG signal was integrated (∫dEMG) with a 50 msec time constant, moving time average. The OB zero time point was defined as the onset time of delivery of the over-pressurization blast identified from the dEMG (Figure 1). The apnea period was the time from OB delivery with breathing cessation (no diaphragm EMG activity) until dEMG inspiratory efforts returned. Apnea was defined as cessation of dEMG activity for a time greater than a minimum of two pre-OB respiratory cycles. The irregular breathing period was the time from initial return of inspiratory efforts until the frequency returned to less than ±1 SD of the pre-OB respiratory cycle timing pattern. The inspiratory time (Ti) was determined from the onset of dEMG activity to the peak of the ∫dEMG activity, expiratory time (Te) from the ∫dEMG activity peak to the onset of the subsequent dEMG, total breath time (Ttot) was the sum of Ti and Te.
Statistical Analysis
All respiratory parameters were represented as mean ±SD. Comparisons of apnea and respiratory modulations in Ti, Te, and Ttot between experimental groups were analyzed with one-way ANOVA and Tukey’s post-hoc analysis. Linear regression analysis of Psi and apnea duration (sec) with Shapiro-Wilk normality test was performed. Statistical significance was p ≤ 0.05.
Results
A total of 27 animals were tested in this study. The OB-1 caused a 19% death rate (5/27) resulting in 22 animals analyzed after the initial OB injury: Group 1, n=7; Group 2, n=15. Of the OB-1 surviving animals, 12 were exposed to OB-2 with one animal death (1/12) resulting in 11 animals analyzed after the second OB injury: Group 3, n=6; Group 4, n=5. There were no differences in Psi for the animals that did not survive OB-1 (mean Psi=83.2±10.2) and OB-2 (Psi=78.5).
Diaphragmatic EMG Recordings
OB-1 Group Comparisons
Figure 1a illustrates the raw and ∫dEMG breathing pattern obtained from the diaphragm EMG (dEMG) recording for a Group 1 (69.9 Psi) animal. Figure 1b illustrates the raw and ∫dEMG breathing pattern obtained from the diaphragm EMG (dEMG) recording for a Group 2 (90.3 Psi) animal.
Figure 2a illustrates the group mean ∫dEMG Ti breath phase times were: Pre-OB-1 Group 1 0.23±0.03 and Group 2 0.24±0.03; Post-OB-1 Group 1 0.20±0.03 and Group 2 0.25±0.06. There were no significance differences seen between either Pre-OB-1 Group 1 and Group 2 Ti (p=0.450) and Post-OB-1 Group 1 and Group 2 Ti (p=0.053).
Figure 2.
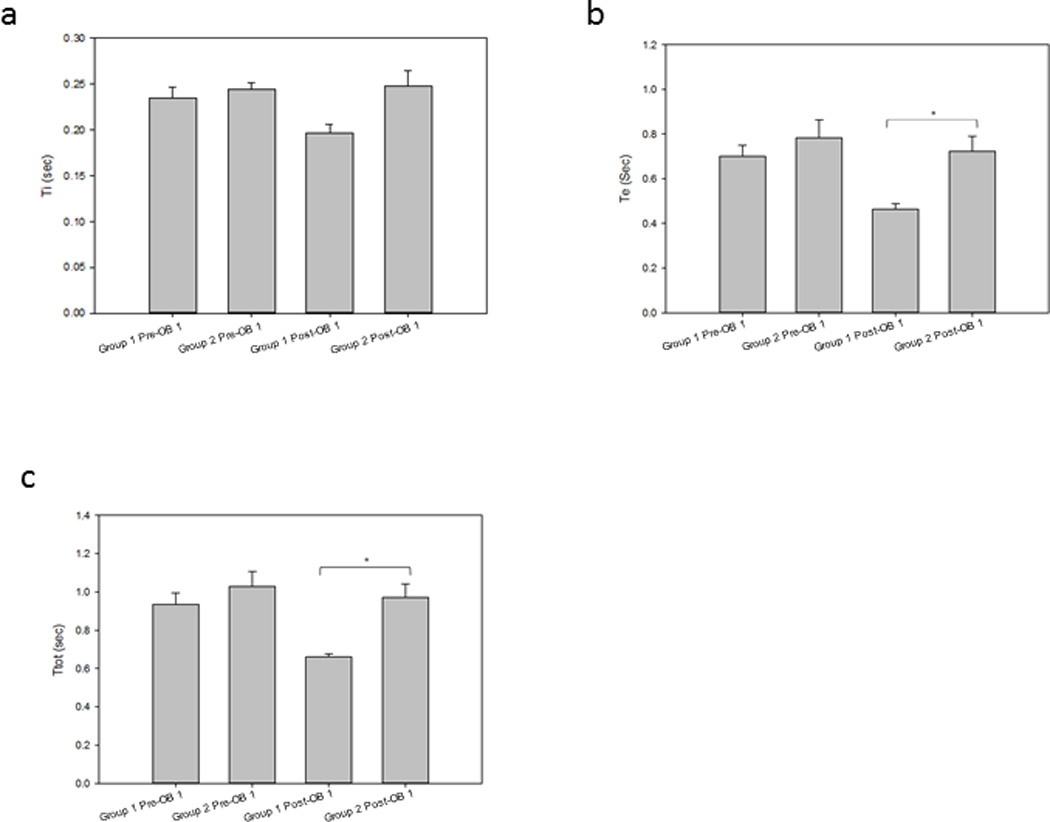
Group mean respiratory phase timing in OB-1 animals.
a. Ti: Group 1 Ti 0.23±0.03 was not significantly different than Group 2 Ti 0.24±0.03 Pre-OB-1 breath times (p=0.450). Group 1 Ti 0.20±0.03 was not significantly different than Group 2 Ti 0.25±0.06 Post-OB-1 breath times (p=0.053).
b. Te: Group 1 Te 0.70±0.13 was not significantly different than Group 2 Te 0.78±0.31 Pre-OB-1 breath times (p=0.751). Group 1 Te 0.46±0.06 was significantly different than Group 2 Te 0.72±0.24 Post-OB-1 breath times (p=0.012).
c. Ttot: Group 1 Ttot 0.94±0.16 was not significantly different than Group 2 Ttot 1.03±0.30 Pre-OB-1 breath times (p=0.698). Group 1 Ttot 0.66±0.05 was significantly different than Group 2 Ttot 0.97±0.26 Post-OB-1 breath times (p=0.005).
Figure 2b illustrates the group mean ∫dEMG Te breath phase times were: Pre-OB-1 Group 1 0.70±0.13 and Group 2 0.78±0.31; Post-OB-1 Group 1 0.46±0.06 and Group 2 0.72±0.24. There was no significance difference between Group 1 and Group 2 Te Pre-OB-1 (p=0.751). There was a significance difference between Group 1 and Group 2 Te Post-OB-1 (p=0.012).
Figure 2c illustrates the group mean ∫dEMG Ttot breath phase times were: Pre-OB-1 Group 1 0.94±0.16 and Group 2 1.03±0.30; Post OB-1 Group 1 0.66±0.05 and Group 2 0.97±0.26. There was no significance difference between Pre-OB-1 Group 1 and Group 2 Ttot (p=0.698). There was a significance difference between Post-OB-1 Group 1 and Group 2 Ttot (p=0.005).
OB-2 Group Comparisons
Figure 3a illustrates the group mean ∫dEMG Ti breath phase times were: Pre-OB-2 Group 3 0.24±0.05 and Group 4 0.22±0.06; Post-OB-2 Group 3 (66.5-71.5 Psi) 0.19±0.05 and Group 4 (86.7-94.0 Psi) 0.22±0.08. There were no significance differences seen between either Pre-OB-2 Group 3 and Group 4 Ti (p=0.591) and Post-OB-2 Group 3 and Group 4 Ti (p=0.544).
Figure 3.
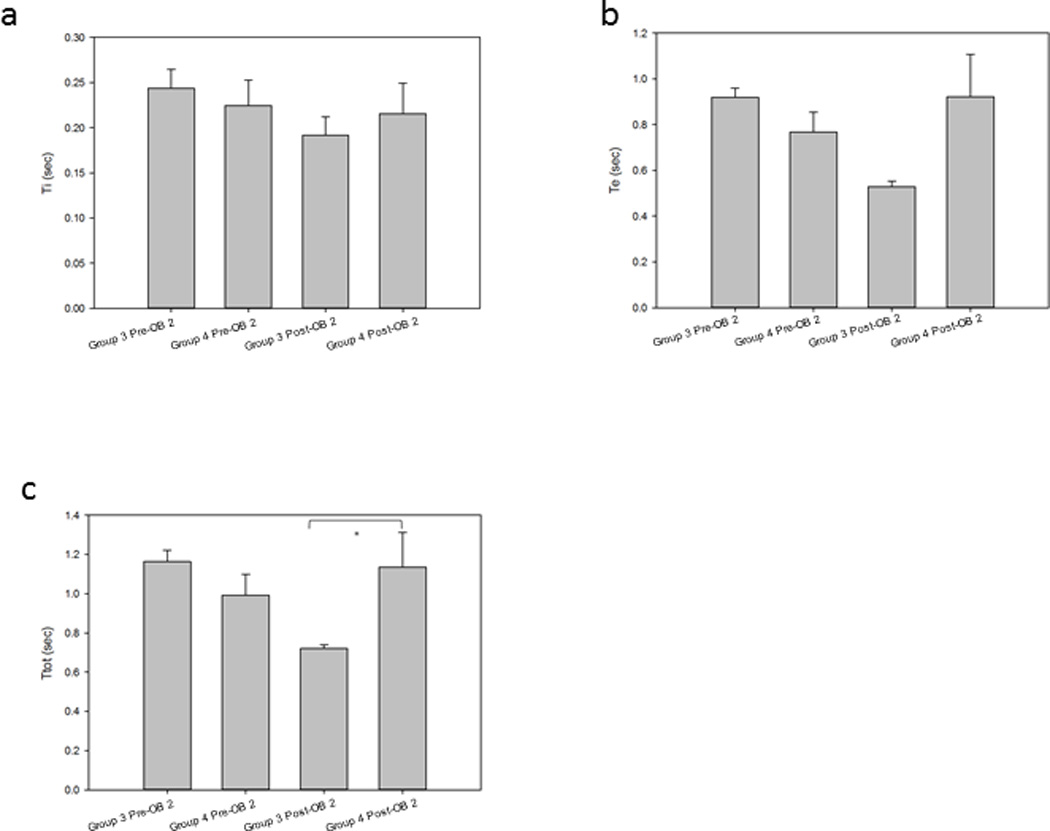
Group mean respiratory phase timing in OB-2 animals.
a. Ti: Group 3 Ti 0.24±0.05 was not significantly different than Group 4 Ti 0.22±0.06 Pre-OB-2 breath times (p=0.591). Group 3 Ti 0.19±0.05 was not significantly different than Group 4 Ti 0.22±0.08 Post-OB-2 breath times (p=0.544).
b. Te: Group 3 Te 0.92±0.10 was not significantly different than Group 4 Te 0.77±0.19 Pre-OB-2 breath times (p=0.124). Group 3 Te 0.53±0.06 was not significantly different than Group 4 Te 0.92±0.42 Post-OB-2 breath times (p=0.126).
c. Ttot: Group 3 Ttot 1.16±0.14 was not significantly different than Group 4 Ttot 0.99±0.24 Pre-OB-2 breath times (p=0.175). Group 3 Ttot 0.72±0.05 was significantly different than Group 4 Ttot 1.14±0.39 Post-OB-2 breath times (p=0.030).
Figure 3b illustrates the group mean ∫dEMG Te breath phase times were: Pre-OB-2 Group 3 0.92±0.10 and Group 4 0.77±0.19; Post-OB-2 Group 3 0.53±0.06 and Group 4 0.92±0.42. There were no significance differences between Group 3 and Group 4 Te Pre-OB-2 (p=0.124) and Post-OB-2 (p=0.126).
Figure 3c illustrates the group mean ∫dEMG Ttot breath phase times were: Pre-OB-2 Group 3 1.16±0.14 and Group 4 0.99±0.24; Post-OB-2 Group 3 0.72±0.05 and Group 4 1.14±0.39. There was no significance difference between Pre-OB-2 Group 3 and Group 4 Ttot (p=0.175). There was a significance difference between Post-OB-2 Group 3 and Group 4 Ttot (p=0.030).
OB-1 and OB-2 Comparisons
Figure 4a illustrates the group mean ∫dEMG Ti breath phase times for Group 1 (OB-1) and Group 3 (OB-2) were: Pre-OB-1 0.23±0.03; Post-OB-1 0.20±0.03, Pre-OB-2 0.24±0.05 and Post-OB-2 0.19±0.05. There were significance differences between treatment groups (p<0.001). Figure 4b illustrates Te breath phase times for Group 1 (OB-1) and Group 3 (OB-2) were: Pre-OB-1 0.70±0.13, Post-OB-1 0.46±0.06, Pre-OB-2 0.92±0.10 and Post-OB-2 0.53±0.06. There were significance differences between treatment groups (p<0.001). Figure 4c illustrates the group mean Ttot breath phase for Group 1 (OB-1) and Group 3 (OB-2) were: Pre-OB-1 0.94±0.16, Post-OB-1 0.66±0.05, Pre-OB-2 1.16±0.14 and Post-OB-2 0.72±0.05. There were significance difference between treatment groups (p<0.001).
Figure 4.
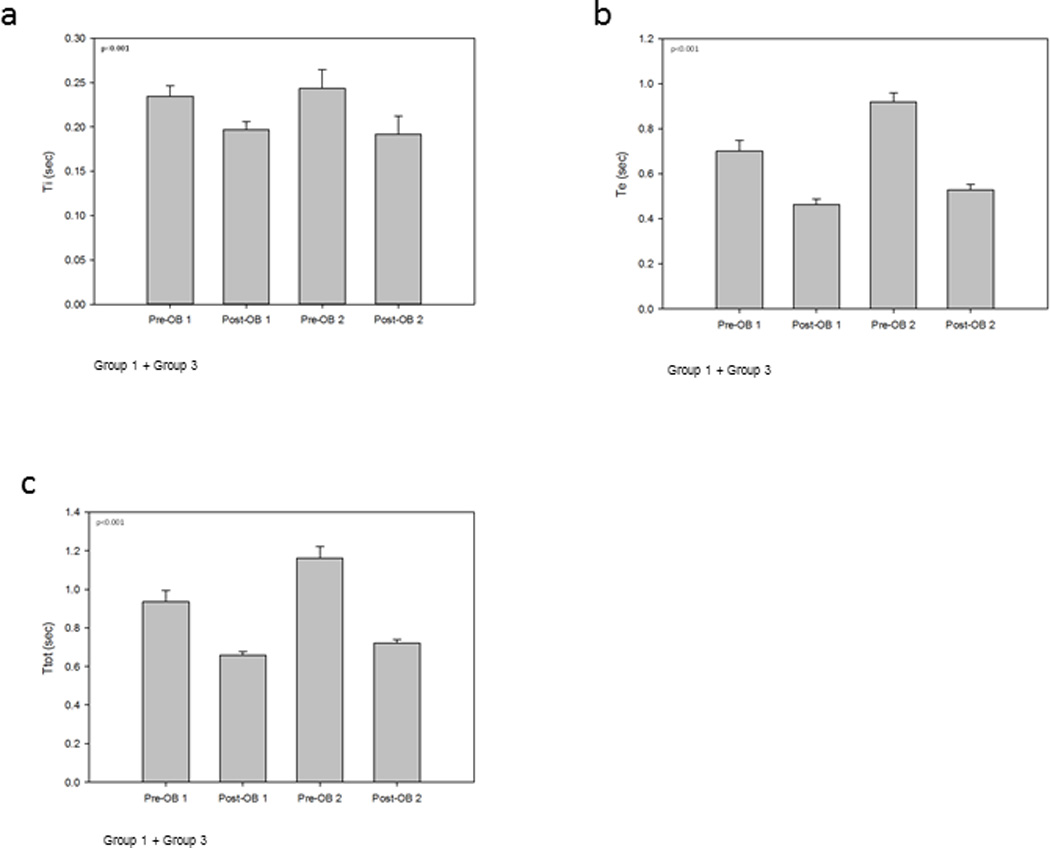
Group 1 and Group 3 animals mean respiratory phase timing for OB-1 and OB-2.
a. Ti: Group 1 and Group 3 Ti phase times were: Pre-OB-1 0.23±0.03; Post-OB-1 0.20±0.03, Pre-OB-2 0.24±0.05 and Post-OB-2 0.19±0.05. There were significance differences between treatment groups (p<0.001).
b. Te: Group 1 and Group 3 Te phase times were: Pre-OB-1 0.70±0.13; Post-OB-1 0.46±0.06, Pre-OB-2 0.92±0.10 and Post-OB-2 0.53±0.06. There were significance differences between treatment groups (p<0.001).
c. Ttot: Group 1 and Group 3 Ttot phase times were: Pre-OB-1 0.94±0.16; Post-OB-1 0.66±0.05, Pre-OB-2 1.16±0.14 and Post-OB-2 0.72±0.05. There were significance differences between treatment groups (p<0.001).
Figure 5a illustrates the group mean ∫dEMG Ti breath phase times for Group 2 (OB-1) and Group 4 (OB-2) were: Pre-OB-1 0.24±0.03, Post-OB-1 0.25±0.06, Pre-OB-2 0.22±0.06 and Post-OB-2 0.22±0.08. There were no significance differences between treatment groups (p=0.427). Figure 5b illustrates the group mean Te breath phase for Group 2 (OB-1) and Group 4 (OB-2) were: Pre-OB-1 0.78±0.31, Post-OB-1 0.72±0.24, Pre-OB-2 0.77±0.19 and Post-OB-2 0.92±0.42. There were no significance differences between treatment groups (p=0.426). Figure 5c illustrates the group mean Ttot breath phase for Group 2 (OB-1) and Group 4 (OB-2) were: Pre-OB-1 1.03±0.30, Post-OB-1 0.97±0.26, Pre-OB-2 0.99±0.24 and Post-OB-2 1.14±0.39. There were no significance differences between treatment groups (p=0.559).
Figure 5.
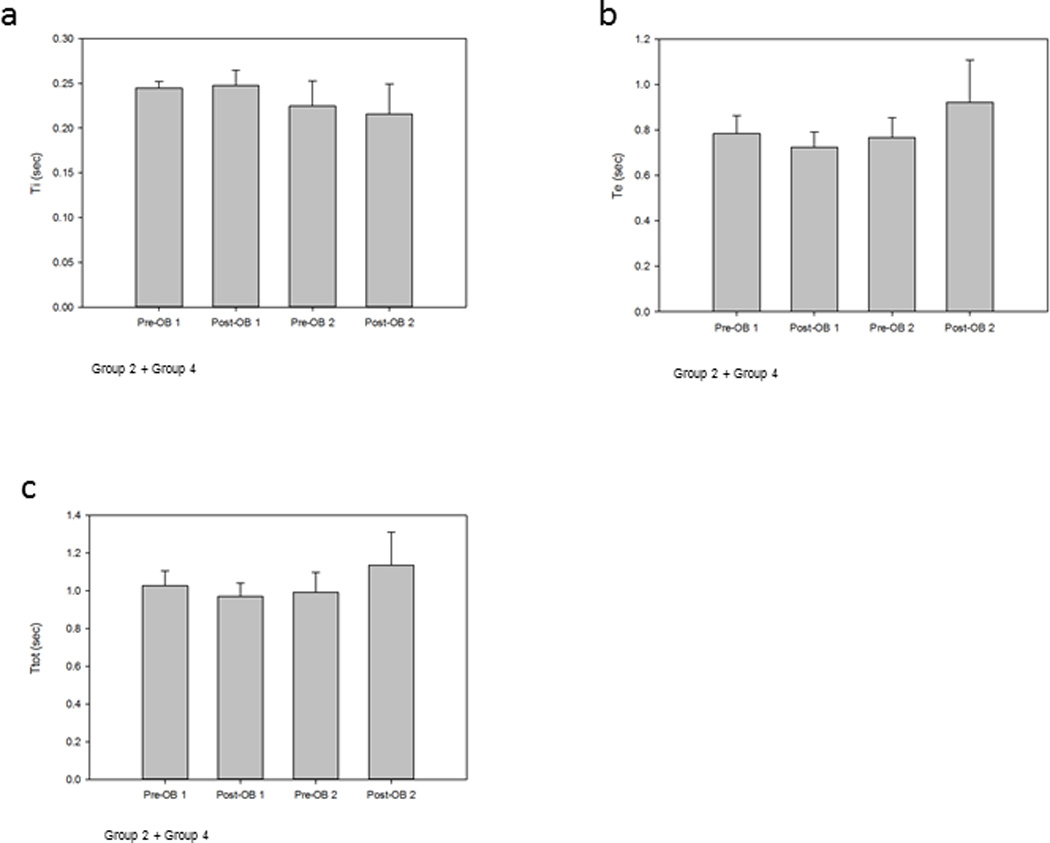
Group 2 and Group 4 animals mean respiratory phase timing for OB-1 and OB-2.
a. Ti: Group 2 and Group 4 Ti phase times were: Pre-OB-1 0.24±0.03; Post-OB-1 0.25±0.06, Pre-OB-2 0.22±0.06 and Post-OB-2 0.22±0.08. There were no significance differences between treatment groups (p=0.427).
b. Te: Group 2 and Group 4 Te phase times were: Pre-OB-1 0.78±0.31; Post-OB-1 0.72±0.24, Pre-OB-2 0.77±0.19 and Post-OB-2 0.92±0.42. There were no significance differences between treatment groups (p=0.426).
c. Ttot: Group 2 and Group 4 Ttot phase times were: Pre-OB-1 1.03±0.30; Post-OB-1 0.97±0.26, Pre-OB-2 0.99±0.24 and Post-OB-2 1.14±0.39. There were no significance differences between treatment groups (p=0.559).
Apnea as a Function of Psi
OB-1 Group Comparisons
Figure 6a shows a scatter plot of the apneic duration and the Psi for OB-1. Group 1 animals (n=7) with Psi = 70.29±1.37, had shorter apneic duration (2.25±1.48 sec). The Group 1 animals had a significant relationship between Psi and apnea duration (p<0.001, R2=0.893). The Group 2 animals (n=15) with Psi = 89.24±4.82, had longer apneic durations (4.29±3.83 sec). The Group 2 animals had a significant relationship between Psi and apnea duration (p=0.012, R2=0.370). Apneic duration of the combined results for Group 1 and Group 2 were significantly correlated with Psi (p=0.016, R2=0.233).
Figure 6.
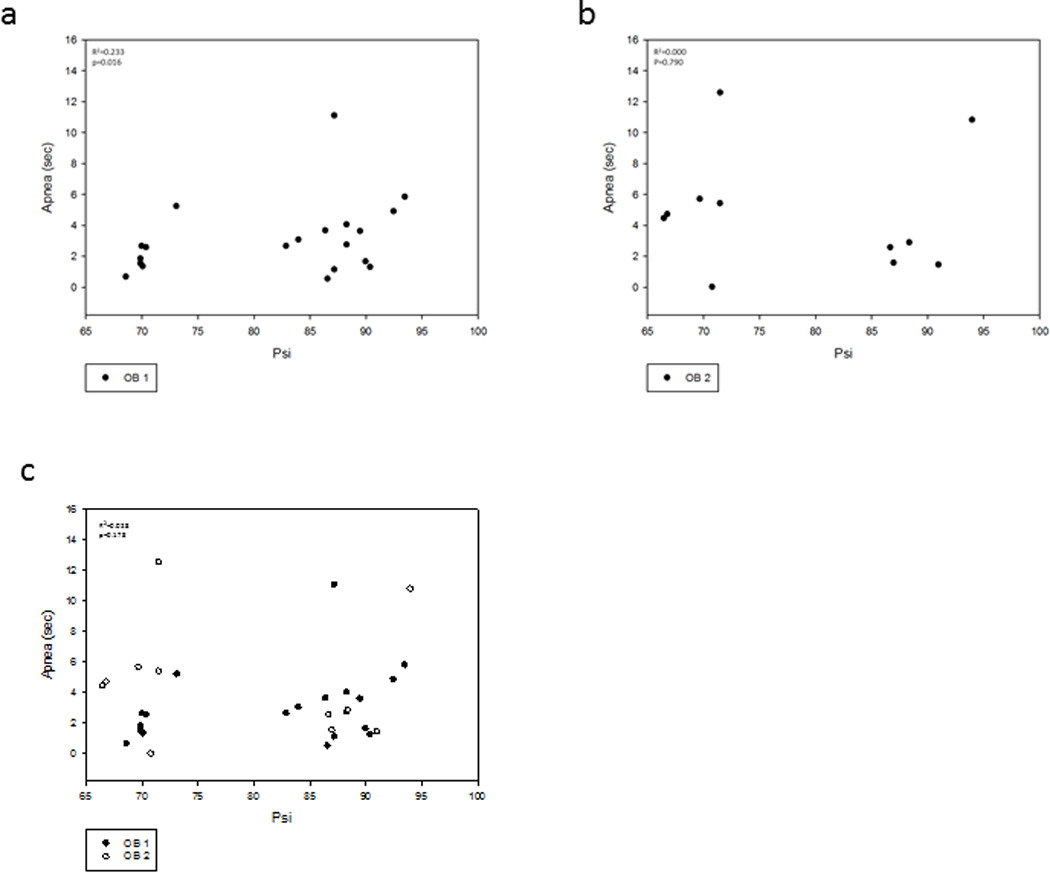
Relationship between apnea duration and OB Psi.
a. Effect of Psi Group 1 (70.29±1.37 Psi) and Group 2 (89.24±4.82) on OB-1 (n=22) apneic periods (2.25±1.48) and (4.29±3.83) respectively. There was a significant linear relationship (p=0.016, R2=0.233).
b. Effect of Psi of Group 1 (69.47±2.28 Psi) and Group 2 (89.42±3.07 Psi) on OB-2 (n-11) apneic periods (5.46±4.05) and (3.84±3.94) respectively. There was no significance between Psi and apnea (p=0.790, R2=0.000).
c. There was not a significant (p=0.178, R2=0.028) relationship between Psi and apnea duration for all animals when OB-1 and OB-2 are combined.
OB-2 Group Comparisons
Figure 6b shows a scatter plot of the apneic duration and the Psi for OB-2. Group 3 animals (n=6) with Psi = 69.47±2.28 had longer apneic durations (5.46±4.05 sec). The Group 3 animals had no significance between pressure Psi and apnea duration (p=0.613, R2=0.000). The Group 4 animals (n=5) with Psi = 89.42±3.07 had shorter apneic durations (3.84±3.94 sec). The Group 4 animals had no significance between Psi and apnea duration (p=0.114, R2=0.492). The apneic durations were not significantly correlated with Psi in Group 3 and Group 4 (p=0.790, R2=0.000). The apneic durations were similar regardless of the Psi during second blast. This suggests that even a mild TBI has cumulative effects due to two blasts on the apneic period.
OB-1 and OB-2 Comparisons
Figure 6c shows a scatter plot of the apneic duration and Psi for OB-1 (n=22) and OB-2 (n=11). OB-1 resulted in a linear increase in apneic duration (3.61±3.34 sec) as a relationship of Psi (82.92±9.98). OB-2 resulted in a more scattered apneic duration (4.73±3.89 sec) as a function of Psi (78.54±10.72). There was not a significant relationship between Psi and apnea for all animals when OB-1 and OB-2 were combined (p=0.178, R2=0.028).
Discussion
To our knowledge, this is the first study to record from the diaphragm EMG during blast-induced TBI in rats. Our results indicate that a dorsal directed closed head OB injury results in a neurally mediated apnea. The occurance and duration of the apnea is a function of the OB Psi and repeat injury. The Ti, Te and Ttot periods increased relative to Psi-during the first OB. The results become more varied with the second OB with increases in apneic periods seen in the lower OB-2 pressure group (Psi≤70) when comparing all animals that had multiple blasts. The second OB Ttot was affected by overpressure blast pressure in all animals. The apneic period and disruption in normal breathing pattern was evidenced by the dEMG recordings during and following OB in these animals. These changes are consistent with observational reports in previous studies (Cheng et al., 2010; Dixon et al., 1987; Guy et al., 1998b; Kuehn et al., 2011).
It is likely that these responses are multifactorial in nature. The OB injury is a global insult to the brain and each injury is likely to have varying kinectic energy projections throughout the brain based on the individual animal anatomy and potential variations in head orientation. Although we took measures to orient the animal head the same with each OB, the head was not in a stereotaxic apparatus resulting in potential variations in the angle of the head under the blast tube.
It is difficult to identify the exact neuronal pathways that were affected by the OB. Previous studies have suggested that the brainstem is likely affected resulting in the initial apneic period followed by irregular breathing (Cheng et al., 2010; Dixon et al., 1987; Guy et al., 1998b; Kuehn et al., 2011). Therefore, it is likely this disruption is at least in part at the medullary level and one possibility may be that the respiratory neural network neurons are affected by the mechanical pressure wave. This disruption is a function of the magnitude of the pressure with smaller pressures resulting in lesser apneic periods as well as more stable breathing pattern (Ti, Te and Ttot).
Behavior and cognitive performance has been the topic of multiple TBI studies on mice using fluid percussion (DeRoss et al., 2002), impactor tip (Longhi et al., 2005) and weight-drop (Creeley et al., 2004; DeFord et al., 2002). The TBIs in these studies were induced either every day or every other day for a week which is different from the present study. Two injuries within 7 days of each other was reported to increase damage to hippocampal neurons in the area of CA1 (Jenkins et al., 1989). Neuronal damage was found in the cortex and hypothalamus following single and repetitive concussive brain injury (Longhi et al., 2005). The multiple injury weight-drop model, however, did not report axonal injury in the brainstem (DeFord et al., 2002). Although no brainstem neuronal loss was reported with immunohistochemistry in the weight-drop model, a disruption in the neuronal network is feasible with the OB model that generates kinectic forces throughout the brain.
A mouse model using an impactor tip found that 15 animals had a brief observational apneic period 3-19 seconds with first injury and 9 animals had apneic periods of 6-21 seconds after second injury (Laurer et al., 2001). It is interesting to note that with multiple OB, the OB-2 lower pressures (Psi≤70) compared to the higher OB-1 pressures (Psi≥80) resulted in greater difference in apneic periods in the OB-2 condition. This may be a result of greater sensitivity due to less damage in the neuronal populations in the lower OB pressure group. A repeated (three days after initial injury) head injury mouse model using an impactor tip found neurodegeneration in the ipsilateral cortex with less damage seen in the hypothalamus, hippocampus and thalamus (Longhi et al., 2005). Although there was less injury seen in the hypothalamus and thalamus, this was a relatively mild injury and not a global insult. With silver staining, evidence of diencephalon damage was found in a composite OB injury (Svetlov et al., 2010) which could likely result in respiratory disturbances. Our OB injury model provides a global brain impact with repeat OBs most likely resulting in greater neurodegeneration especially in the lower OB pressure animals.
Although we are unable in the present study to determine the respiratory neural network neurons in the brainstem that are affected with the OB injury model, the length of the apneic period and duration of the respiratory cycle is increased following the OB-2 and appears to be more affected at low OB pressures. Although there were fewer deaths caused by the OB-2, perturbations in breathing still occur. This is important when considering the appropriate recovery time before individuals exposed to closed-head injury can return to service due to the cumulative effects of TBI.
Future experiments are needed to include different blast orientation and pressures to determine the affect of Psi magnitude on the apneic period and breathing cycle. A frontal injury may result in different neuromotor effects that is a function of the vector of kinectic energy transferred to the brainstem and respiratory neural control network. It would also be important to determine the OB pressure threshold for dorsal OB injury that results in apnea and alterations in the breathing pattern.
Highlights.
Blast overpressure (OB) injury in rodents has been employed for modeling the traumatic brain injury (TBI) induced by an improvised explosive device (IED). This study investigated the relationship between OB pressure, repeat injury and breathing pattern before, during and after head-directed OB injury. Diaphragm electromyographic recordings in chronically instrumented animals revealed OB induced apnea followed by respiratory timing changes that were a function of the OB pressure and second exposure to OB.
Acknowledgements
The authors express gratitude to Victor Prima for assistance with the OB injury and Lauren Donnangelo for assistance with animal care.
Grants:
Training support to SLA was provied by NIH R01HL109025.
Footnotes
Publisher's Disclaimer: This is a PDF .le of an unedited manuscript that has been accepted for publication. As a service to our customers we are providing this early version of the manuscript. The manuscript will undergo copyediting, typesetting, and review of the resulting proof before it is published in its final citable form. Please note that during the production process errors may be discovered which could affect the content, and all legal disclaimers that apply to the journal pertain.
Disclosures:
No real or potential conflict of interest exists for any of the authors in this study.
References
- Cheng J, Gu J, Ma Y, Yang T, Kuang Y, Li B, Kang J. Development of a rat model for studying blast-induced traumatic brain injury. Journal of the neurological sciences. 2010;294:23–28. doi: 10.1016/j.jns.2010.04.010. [DOI] [PubMed] [Google Scholar]
- Creeley CE, Wozniak DF, Bayly PV, Olney JW, Lewis LM. Multiple episodes of mild traumatic brain injury result in impaired cognitive performance in mice. Academic emergency medicine : official journal of the Society for Academic Emergency Medicine. 2004;11:809–819. doi: 10.1111/j.1553-2712.2004.tb00761.x. [DOI] [PubMed] [Google Scholar]
- DeFord SM, Wilson MS, Rice AC, Clausen T, Rice LK, Barabnova A, Bullock R, Hamm RJ. Repeated mild brain injuries result in cognitive impairment in B6C3F1 mice. Journal of neurotrauma. 2002;19:427–438. doi: 10.1089/08977150252932389. [DOI] [PubMed] [Google Scholar]
- DeRoss AL, Adams JE, Vane DW, Russell SJ, Terella AM, Wald SL. Multiple head injuries in rats: effects on behavior. The Journal of trauma. 2002;52:708–714. doi: 10.1097/00005373-200204000-00017. [DOI] [PubMed] [Google Scholar]
- Dixon CE, Lyeth BG, Povlishock JT, Findling RL, Hamm RJ, Marmarou A, Young HF, Hayes RL. A fluid percussion model of experimental brain injury in the rat. Journal of neurosurgery. 1987;67:110–119. doi: 10.3171/jns.1987.67.1.0110. [DOI] [PubMed] [Google Scholar]
- Faul M XL, Wald MM, Coronado VG. Traumatic brain injury in the United States: emergency department visists, hospitalizations, deaths. Atlanta (GA): Centers for Disease Control and Prevention, National Center for Injury Prevention and Control; 2010. [Google Scholar]
- Guy RJ, Glover MA, Cripps NP. The pathophysiology of primary blast injury and its implications for treatment. Part I: The thorax. Journal of the Royal Naval Medical Service. 1998a;84:79–86. [PubMed] [Google Scholar]
- Guy RJ, Kirkman E, Watkins PE, Cooper GJ. Physiologic responses to primary blast. The Journal of trauma. 1998b;45:983–987. doi: 10.1097/00005373-199812000-00001. [DOI] [PubMed] [Google Scholar]
- Jenkins LW, Moszynski K, Lyeth BG, Lewelt W, DeWitt DS, Allen A, Dixon CE, Povlishock JT, Majewski TJ, Clifton GL, et al. Increased vulnerability of the mildly traumatized rat brain to cerebral ischemia: the use of controlled secondary ischemia as a research tool to identify common or different mechanisms contributing to mechanical and ischemic brain injury. Brain research. 1989;477:211–224. doi: 10.1016/0006-8993(89)91409-1. [DOI] [PubMed] [Google Scholar]
- Kuehn R, Simard PF, Driscoll I, Keledjian K, Ivanova S, Tosun C, Williams A, Bochicchio G, Gerzanich V, Simard JM. Rodent model of direct cranial blast injury. Journal of neurotrauma. 2011;28:2155–2169. doi: 10.1089/neu.2010.1532. [DOI] [PubMed] [Google Scholar]
- Laurer HL, Bareyre FM, Lee VM, Trojanowski JQ, Longhi L, Hoover R, Saatman KE, Raghupathi R, Hoshino S, Grady MS, McIntosh TK. Mild head injury increasing the brain's vulnerability to a second concussive impact. Journal of neurosurgery. 2001;95:859–870. doi: 10.3171/jns.2001.95.5.0859. [DOI] [PubMed] [Google Scholar]
- Longhi L, Saatman KE, Fujimoto S, Raghupathi R, Meaney DF, Davis J, McMillan BSA, Conte V, Laurer HL, Stein S, Stocchetti N, McIntosh TK. Temporal window of vulnerability to repetitive experimental concussive brain injury. Neurosurgery. 2005;56:364–374. doi: 10.1227/01.neu.0000149008.73513.44. discussion 364-374. [DOI] [PubMed] [Google Scholar]
- Lumsden T. Observations on the respiratory centres in the cat. The Journal of physiology. 1923;57:153–160. doi: 10.1113/jphysiol.1923.sp002052. [DOI] [PMC free article] [PubMed] [Google Scholar]
- Svetlov SI, Prima V, Kirk DR, Gutierrez H, Curley KC, Hayes RL, Wang KK. Morphologic and biochemical characterization of brain injury in a model of controlled blast overpressure exposure. The Journal of trauma. 2010;69:795–804. doi: 10.1097/TA.0b013e3181bbd885. [DOI] [PubMed] [Google Scholar]


