

Abstract
Sulfane sulfurs are one type of important reactive sulfur species. These molecules have unique reactivity that can attach reversibly to other sulfur atoms and exhibit regulatory effects in diverse biological systems. Recent studies have suggested that sulfane sulfurs are involved in signal transduction processes regulated by hydrogen sulfide (H2S). Accurate and reliable measurements of sulfane sulfurs in biological samples are thus needed to reveal their production and mechanisms of actions. Herein we report a convenient and accurate method for the determination of sulfane sulfurs concentrations. The method employs a triphenylphosphine derivative (P2) to capture sulfane sulfurs as a stable phosphine sulphide product PS2. The concentration of PS2 was then determined by isotope dilution mass spectrometry, using a 13C3-labelled phosphine sulfide PS1 as the internal standard. The specificity and efficiency of the method were proved by model reactions. It was also applied in the measurement of sulfane sulfurs in mice tissues including brain, kidney, lung, liver, heart, spleen, and blood.
Keywords: Reactive sulfur species, Isotope dilution assay, sulfane sulfur, mass
Introduction
Reactive sulfur species (RSS) are a family of sulfur-containing molecules that widely exist in biological systems. Representative examples are biothiols (such as cysteine and glutathione), S-modified cysteine adducts (such as S-nitrosothiols and sulfenic acids), hydrogen sulphide (H2S), persulfides, and polysulfides. Many of these species play important roles in physiological and pathophysiological processes.1-3 Among them, reactive sulfane sulfurs have received increased attention as some of these compounds are suggested to be involved in signal transduction processes mediated by H2S.4-12 Sulfane sulfur refers to a sulfur atom with six valence electrons but no charge (represented as S0).13-16 Biologically relevant sulfane sulfur compounds include persulfides (R-S-SH), hydrogen polysulfides (H2Sn, n>1), polysulfides (R-S-Sn-S-R), as well as protein-bound elemental sulfur (S8) (Figure 1). H2S and sulfane sulfurs are interchangeable, therefore they always coexist. From a chemistry perspective, sulfane sulfurs can be the metabolites of H2S; meanwhile they can be the precursors of H2S. Because of this property, some mechanisms of actions that were originally attributed to H2S may actually be mediated by sulfane sulfurs. For example, recent work by Kimura and co-workers suggests that H2S-derived sulfane sulfurs may be the actual signaling molecules.8,10 Moreover it has been long appreciated that sulfane sulfurs have unique regulatory effects in diverse biological systems: post-transcriptional modification of transfer RNA, synthesis of sulfur-containing cofactors and vitamins, activation or inhibition of enzymes, etc.4
Figure 1. The pool of biological sulfane sulfurs.

Despite the increased interest in sulfane sulfurs, fundamental questions regarding their production and functions remain to be clarified. To this end, accurate and reliable measurements of sulfane sulfurs in biological samples are needed. Currently, several methods for sulfane sulfur detection have been reported (Figure 2). The traditional method, i.e. cyanolysis, is based on the reaction between sulfane sulfurs and cyanide (CN-) under basic pH (8.5∼10) to form thiocyanate (SCN-), which can be further converted to ferric thiocyanate and measured by its characteristic UV absorbance at 460 nm.17 Another method is to convert sulfane sulfurs into H2S, upon treating with reductants like DTT. The resultant H2S can be determined by chromatography methods or trapped with monobromobimane, and then analyzed to deduce the concentrations of sulfane sulfurs.13 It should be noted that monobromobimane-based methods have been used to detect individual sulfane sulfur species,18 as well as the whole sulfane sulfur pool.19 Recently specific fluorescent probes, such as SSP2, were developed by our laboratory.20 This method is based on a sulfane sulfur-mediated cyclization to turn-on fluorescence signals. It allows the detection of sulfane sulfurs by convenient and non-destructive fluorescent measurements.
Figure 2. Current methods for sulfane sulfur detection.

In order to develop other new and efficient methods for sulfane sulfur detection we have initiated a program to study the reactions of sulfane sulfurs. It is known that triarylphosphines (PAr3) can rapidly react with sulfane sulfur species to form triarylphosphine sulfides (S=PAr3).21 However this reaction has not been well-appreciated in sulfane sulfur detection. One report by Sörbo et al employed a gas chromatographic method analyzing S=PAr3 generated from sulfane sulfurs in tissue samples.22 This work indicated the possibility of using this reaction for sulfane sulfur detection, while the method requires complicate chromatographic pretreatments of samples. We envisioned that isotope dilution mass spectrometry would be a useful application of the reaction for sulfane sulfur detection. Isotope dilution is a widely applied method for analyzing chemical substances in biological samples.23-26 The method comprises the addition of isotope-enriched substances (as internal standards) to samples containing non-isotope labelled analytes. Unlike traditional analytical methods, which rely on signal intensities, isotope dilution utilizes the ratios between internal standards and analytes to determine the concentrations. Another advantage of mass spectrometry is that the method does not need complex sample extraction and separation; therefore it is easy for operation.27 Because of these advantages, isotope dilution has been applied in the quantification of proteins, nucleosides (derived from DNA or RNA), vitamins, and other bioactive molecules.24-29 Yet the applications on sulfane sulfurs have not been reported.
Herein we proposed an isotope dilution strategy for sulfane sulfurs (Figure 3). We expected that triarylphosphine reagents could effectively react with sulfane sulfurs in biological samples to form phosphine sulfide A. After the reaction was completed, isotope-labelled phosphine sulphide B (exampling as 13C isotopes) would be spiked into the sample as internal standards. A and B should show identical chemical/physical properties (such as solubility, extraction efficiency, sensitivity to ionization in mass, etc.). When the mixture was subjected to mass analysis, the comparison of mass peaks' intensities corresponding to A and B should allow us to determine the concentration of A, and in turn determine the original concentration of sulfane sulfurs.
Figure 3. Proposed isotope dilution mass spectrometry method for sulfane sulfur detection.

Materials and Methods
Chemicals
All solvents and chemicals were reagent grade. L-Alanine, thionyl chloride and Fmoc-Ala-OH-13C3 were purchased from Sigma–Aldrich; 4-dimethylaminopyridine and HOBt were purchased from Acros Organics; DCC, methyl iodide, and piperidine were purchased from Alfa Aesar. 2-(Diphenylphosphino)benzoic acid 3 was prepared according to a literature protocol.30
Synthesis of phosphine P1 and P2
Phosphine P2 was prepared from L-alanine methyl ester through a standard coupling procedure with 2-(diphenylphosphino)benzoic acid 3 in 54% yield.31 1H NMR (300 MHz, CDCl3) δ 1.27 (d, J = 7.2 Hz, 3H), 3.72 (s, 3H), 4.64 (t, J = 7.5 Hz, 1H), 6.54 (d, J = 6.9 Hz, 1H), 6.95 (m, 1H), 7.41-7.25 (m, 12H), 7.64 (m, 1H); 13C NMR (75 MHz, CDCl3) δ 173.6, 168.4, 137.2, 137.1, 136.8, 134.4, 134.3, 134.0, 133.9, 130.6, 129.1, 129.0, 128.9, 128.8, 128.1, 128.0, 52.7, 48.6, 18.6; 31P NMR δ: -8.6; HRMS m/z 392.1428 [M+H]+; calcd for C23H23NO3P: 392.1416; IR 3269, 3067, 2946, 1723, 1567, 1465, 1249, 1053, 747; mp 123-124 °C.
The 13C-labeled phosphine P1 was synthesized from 13C-labeled alanine methyl ester using the same procedure for P2. The 13C-labeled alanine methyl ester was prepared from Fmoc-Ala-OH-13C3 in 2 steps: esterification with methyl iodide32 and deprotection to remove the Fmoc group.33 The overall yield was 23%. 1H NMR (300 MHz, CDCl3) δ 1.06 (m, 1.5H), 1.49 (m, 1.5H), 3.72 (d, J = 3.9 Hz, 3H), 4.39 (m, 0.5H), 4.86 (m, 0.5H), 6.54 (d, , J = 6.6 Hz, 1H), 6.95 (m, 1H), 7.60-7.25 (m, 12H), 7.66 (m, 1H); 31P NMR δ: -8.6; MS (ESI+) m/z 433.3 (M+K+). IR 3270, 3057, 2946, 1728, 1565, 1460, 1249, 1052, 747; mp 124-125 °C.
Sulfane sulfur compounds
Elemental sulfur and sodium tetrasulfide were purchased from Alfa Aesar. Sodium tetrathionate was purchased from Sigma–Aldrich. Other sulfane sulfur compounds such as 5, 6, 7, and sodium disulfide were prepared using methods described previously.18 Compound 7 was a 1:1 mixture of trisulfide and tetrasulfide.
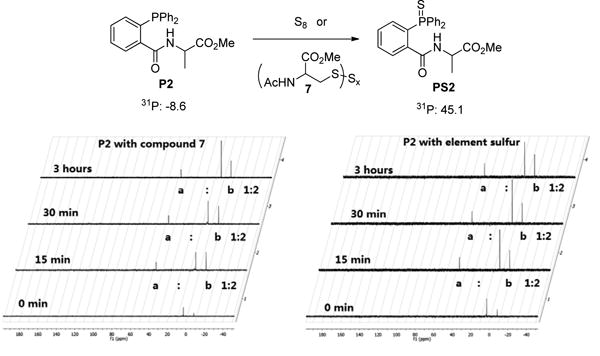
Time-dependent reactions of P2 with sulfane sulfurs
To a solution of P2 (29.4 mg, 0.075 mmol) in CH3CN (20.0 mL) and phosphate buffer (5.0 mL, 100 mM, pH = 7.4) was added 7 or S8 (0.025 mmol). The mixture was stirred at rt. 0.5 mL of the mixture was taken out at different time intervals (0, 0.25, 0.5, and 3 hours) and monitored by 31P NMR. The results showed that the reaction was completed within 15 min.
Reactions of P2 with sulfane sulfur species
General protocol: to a solution of P2 (9.8 mg, 0.025 mmol) in CH3CN (20.0 mL) and phosphate buffer (5.0 mL, 100 mM, pH 7.4) was added elemental sulfur (0.8 mg, 0.025 mmol). The mixture was stirred for 3 h at r.t. and then diluted with CH2Cl2 (50 mL). The organic layer was seperated, dried by MgSO4, and concentrated. Purification by flash column chromatography afforded compound PS2 as a white solid (9.7 mg, 92% yield). 1H NMR (300 MHz, CDCl3) δ 1.15 (d, J = 7.5 Hz, 3H), 3.69 (s, 3H), 3.86 (m, 1H), 7.16 (m, 1H), 7.35-7.60 (m, 8H), 7.75-7.91 (m, 5H), 8.08 (d, J = 6.3 Hz, 3H);13C NMR (75 MHz, CDCl3) δ 172.9, 167.8, 133.3, 133.2, 132.8, 132.7, 132.3, 132.2, 132.0, 131.9, 131.8, 131.5, 131.4, 131.2, 130.5, 130.3, 128.9, 128.8, 128.7(6), 128.7(1), 52.5, 49.3, 17.2; 31P NMR δ 45.1; MS (ESI+) m/z 446.0 (M+Na+); IR 3240, 3050, 2950, 1740, 1650, 1520, 1440. mp 86-87 °C.
Compound PS1 was synthesized using the same procedure for PS2. 1H NMR (300 MHz, CDCl3) δ 0.94 (m, 1.5H), 1.36 (m, 1.5H), 3.64 (m, 0.5H), 3.69 (d, J = 3.6 Hz, 3H), 4.10 (m, 0.5H), 7.16 (dd, J = 15, 7.5 Hz, 1H), 7.35-7.60 (m, 8H), 7.76-7.91 (m, 5H), 8.08 (d, J = 3.9 Hz, 1H); 13C NMR (75 MHz, CDCl3): δ 173.4 (d, J = 61.5 Hz, 1C, 13CO2Me), 133.4, 132.8, 132.7, 132.2, 131.9, 131.8, 131.6, 131.4, 130.5, 130.3, 128.9, 128.8, 128.7(7), 128.7(1), 52.5, 49.3 (dd, J = 61.5, 33.7 Hz, 1C, NH13CH), 17.6 (d, J = 40.5 Hz, 13CH3); 31P NMR δ: 45.1, MS (ESI+) m/z 449. 1 (M+Na+). IR 3250, 3050, 2940, 1660, 1650, 1520, 1430. mp 87-88 °C.
Control experiments
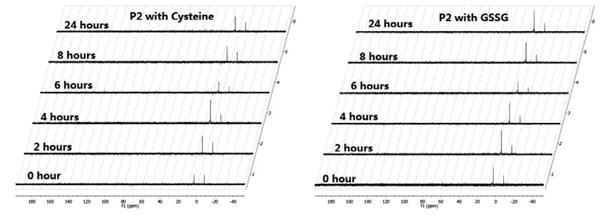
To the solution of P2 (9.8 mg, 0.025 mmol) in CH3CN (20.0 mL) and phosphate buffer (5.0 mL, 100 mM, pH = 7.4) was added cysteine 8 or GSSG (0.025 mmol). The mixture was stirred at rt. 0.5 mL sample was removed from the mixture at different time (0, 2, 4, 6, 8, and 24 h) and monitored by 31P NMR. No reaction was observed. After 24 h, CH2Cl2 (50.0 mL) was added into the solution to extract the products. The organic layers were separated, dried by MgSO4, concentrated, and purified column chromatography. Unreacted P2 was recovered in 91-94% yields.
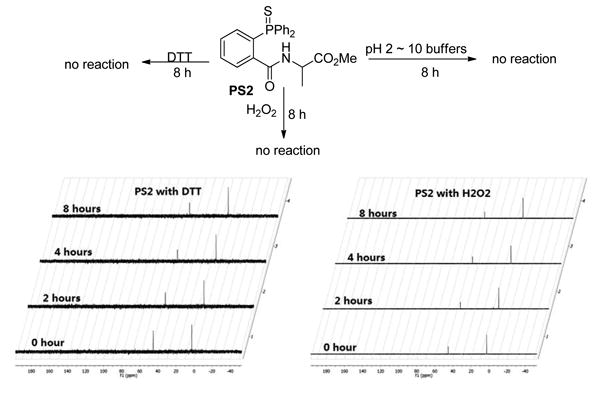
To the solution of P2 (9.8 mg, 0.025 mmol) or PS2 (10.8 mg, 0.025 mmol) in CH3CN (20.0 mL) and phosphate buffer (5.0 mL, 100 mM, pH = 7.4) was added DTT (0.025 mmol). The mixture was stirred at rt. 0.5 mL sample was removed from the mixture at different time (0, 2, 4, and 8 h) and monitored by 31P NMR. No reaction was observed After 8 h, CH2Cl2 (50.0 mL) was added into the solution to extract the products. The organic layers were separated, dried by MgSO4, concentrated, and purified column chromatography. Unreacted P2 and PS2 were recovered in 95% and 96%, respectively. The protocol described above was also applied to test the reaction between PS2 and H2O2, the stability of P2 and PS2 in solutions. The results were shown in text.
Preparation of stock solutions
P2: 19.6 mg of P2 was dissolved in 10.0 mL CH3CN to provide the stock solution. [P2] = 5.0 mM.
PS1: 10.6 mg of PS1 was dissolved in 25.0 mL CH3CN to provide the stock solution.
[PS1] = 1.0 mM.
Compound 7: 26.6 mg of 7 was dissolved in 100.0 mL CH3CN to provide the stock solution. [7] = 0.5 mM, [sulfane sulfur] = 1.0 mM.
General procedure for mass analysis
A model experiment was carried out to verify the effectiveness of isotope dilution mass spectrometry assay in the quantification of sulfane sulfurs. A series of solutions of 7 were prepared in a mixed solvents of acetonitrile and phosphate buffer (4/1). The final sulfane sulfur concentrations were 0, 1, 2.5, 5, 7.5, and 10 μM, respectively. Then phosphine P2 (100 μM) was added to trap the sulfane sulfurs. After 3 h the internal standard PS1 (5 μM) was spiked into each sample and solutions were subjected to MALDI-TOF/TOF mass analysis.
A series of compound 7 stock solutions (0, 1, 2.5, 5.0, 7.5, 10.0 μL) were placed in microcentrifuge tubes (2 mL) and diluted to 0.2 mL with phosphate buffer (100 mM, pH = 7.4).
0.78 mL of acetonitrile was added.
20 μL of P2 stock solution (5.0 mM) was added.
The tubes were put on a Fisher Scientific Pulsing Vortex Mixer for 3 hours.
5 μL of PS1 stock solution (1.0 mM) was added to each tube.
2.5 μL of sample was added to 2.5 μL of fresh dihydroxybenzoic acid matrix (concentration: 10 mg/mL water). This mixture was centrifuged, mixed, then re-centrifuged.
Approximately 0.3 μL of the sample/matrix was added to three spots on the stainless steel sample plate. The plate was put under vacuum and dried.
The sample plate was loaded onto a Sciex 4800 MALDI TOF/TOF Analyzer. The MS reflector positive acquisition method supplied by the manufacture was modified to collect data in the mass range of 455 to 475 with a delayed extraction time of 300 nsec. The edge bias laser pattern was used because of the DHBA matrix.
The laser intensity was adjusted to keep the signal intensity of the highest peak in the spectra below 10,000 in the accumulated 400 spectra. A total of 1600 spectra were collected in groups of 400 if each set of 400 was below 10,000. This was done to keep the sometimes much larger 464 peak from affecting the intensity of the 465 peak.
All peaks in the spectra were labeled with mass and area. The relative intensity of the 465/462 peak was calculated from the displayed areas for the two masses. The correct mass is the lower mass peak when two peaks were seen for either the 462 or 465 peak. This assignment of these peaks was confirmed by accurate mass determination when internal calibration was used in spectra collected in the 200 to 1400 mass ranges.
Animals
Female C57BL/6 mice were purchased from Charles River Laboratories (Wilmington, WA), and single housed in Wegner Hall Vivarium, at Washington State University. Mice were euthanized via overdose of isoflurane. Blood, brain, spleen, lung, liver, heart and kidney were collected. The animal protocol was approved by the Institutional Animal Care and Use Committee at Washington State University.
Preparation of blood and organ samples
Mice were euthanized via overdose of isoflurane.
500 μL of blood were collected by cardiac puncture and placed in a microcentrifuge tube.
0.1 mL of heparin solution (100 mg in 1.83 mL of phosphate buffer) was added.
The blood samples were centrifuged at 800 g for 3 min.
Plasma and red blood cell samples were collected with micropipette.
Different organs including spleen, liver, lung, heart, brain and kidney were extracted separately.
The freshly extracted organs were weighted, placed in 15.0 mL tubes, to which was added phosphate buffers (100 mM, PH = 7.4) (organs/phosphate buffer = 1 g/4 mL).
Organ samples were homogenized by an OMNI International TH-287 homogenizer.
The samples were stored at -78 °C.
Measurements of sulfane sulfers in animal specimens
0.2 mL of organ homogenates were placed in microcentrifuge tubes (2.0 mL).
0.78 mL of acetonitrile was added.
20 μL of P2 stock solution (5.0 mM) was added.
The tubes were put on a Fisher Scientific Pulsing Vortex Mixer for 3 hours.
5 μL of PS1 stock solution (1.0 mM) was added.
The mixtures were centrifuged at 800 g for 3 min.
The supernatants were removed by micropipettes.
2.5 μL of supernatants were added into 2.5 μL of fresh dihydroxybenzoic acid matrix (concentration: 10 mg/mL water). This mixture was centrifuged, mixed, then re-centrifuged.
0.3 μL of the sample/matrix was added to three spots on the stainless steel sample plate. The plate was put under vacuum and dried.
The sample plate was loaded onto a Sciex 4800 MALDI TOF/TOF Analyzer. The MS reflector positive acquisition method supplied by the manufacture was modified to collect data in the mass range of 455 to 475 with a delayed extraction time of 300 nsec. The edge bias laser pattern was used because of the DHBA matrix.
The laser intensity was adjusted to keep the signal intensity of the highest peak in the spectra below 10,000 in the accumulated 400 spectra. A total of 1600 spectra were collected in groups of 400 if each set of 400 was below 10,000. This was done to keep the sometimes much larger 464 peak from affecting the intensity of the 465 peak.
All peaks in the spectra were labeled with mass and area. The relative intensity of the 465/462 peak was calculated from the displayed areas for the two masses. The correct mass is the lower mass peak when two peaks were seen for either the 462 or 465 peak. This assignment of these peaks was confirmed by accurate mass determination when internal calibration was used in spectra collected in the 200 to 1400 mass ranges.
Results and Discussion
Synthesis of triarylphosphine reagents P1 and P2
In order to introduce isotopes on triarylphosphines, we decided to prepare a 13C-labelled phosphine P1 (Figure 4). Three 13C atoms were installed for the purpose of better distinguishing the peaks of analyte and internal standard in mass spectrum. As alanine-13C3 1 is commercially available, it was selected as the starting material and converted into 13C-labelled phosphine P1 in three steps. P1 should react with sulfane sulfurs to produce PS1, which is the internal standard in this study (vide infra). Meanwhile, the non-isotope labelled sulfane sulfur trapping reagent P2 was prepared from alanine methyl ester 4 through similar synthetic steps.
Figure 4. Preparation of triarylphosphine reagents.

Model reactions of phosphine reagents with sulfane sulfurs
With phosphine P2 in hand, it was first needed to ensure the reagent could effectively trap sulfane sulfur species. To this end, we tested the reactions between P2 and two representative sulfane sulfurs (elemental sufur S8 and a cysteine polysuflide 7). In this study, 3 equiv. of P2 vs 1 equiv. of sulfane sulfurs were used. The reactions were monitored by 31P NMR. As shown in Figure 5, three peaks were observed: δ 45.1 (PS2), δ -8.6 (P2), and δ 2.7 (phosphate buffer). The ratios between δ 45.1 and δ -8.6 were used to determine the progress of the reactions. In both cases, the reactions were found to be fast and completed within 15 min.
Figure 5. Time-dependent reaction progress of P2 in the presence of sulfane sulfurs.
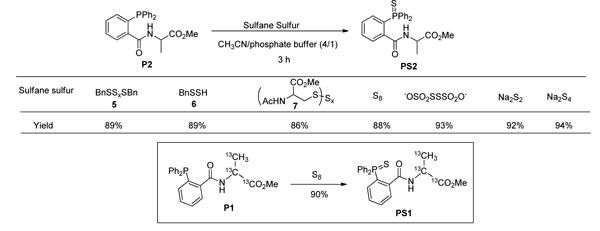
We next determined the effectiveness of the reaction toward diffrent sulfane sulfur compounds including small molecule polysulfides/perthiols (5, 6, 7), elemental sulfur (S8), polythionate, and hydrogen polysulfides (Na2S2 and Na2S4). These substrates were employed to mimic biological sulfane sulfurs. Reaction time was prolongened to 3 hours to ensure the reaction was completed. As shown in Figure 6, all reactions worked well and the desired phosphine sulfide PS2 was obtained in high isolated yields (84% – 94%), indicating that P2 was effeicent in capturing sulfane sulfurs. The internal standard, 13C3-labeled phosphine sulfide PS1, was also obtained from the reaction between P1 and elemental sulfur in excellent yield under the same conditions.
Figure 6. The reactions between P2 and sulfane sulfur compounds.
Control reactions
If our proposed method is used for biological sulfane sulfur detection, two criteria should be met: 1) phosphine P2 should not react with other sulfur species (such as disulfides and biothiols) to form phosphine sulfide, and 2) the product PS2 (and PS1) should be stable during sample preparation and analysis. To address these concerns, we tested the reactions of P2 in the presence of a model disulfide (GSSG) and a thiol derivative 8. Again 31P NMR was used to monitor the reaction (Figure 7). P2 was found to be un-reactive toward these species as no new peak was observed after 24 hours. In addition, we also tested DTT, a commonly used reductant, in this study. No reaction was observed for DTT either (data not shown).
Figure 7. Test the reactivity of P2 toward thiols and disulfides.
The stability of the phosphine sulfide PS2 was next studied. PS2 was found to be stable in the presence of thiols (such as DTT) and oxidants (such as H2O2). 31P NMR assay results were shown in Figure 8. PS2 was also found to be stable in a wide range of pH (2 ∼ 10) (data not shown).
Figure 8. Stability test of PS2.
Method validation
To ensure the proposed isotope dilution mass analysis can accurately determine the concentration of PS2, a linear calibration curve covering the concentration range (0.0, 1.0, 2.5, 4.0, 5.0, 7.5, 15, and 25.0 μM) was obtained. 5.0 μM of the internal standard PS1 was added into each sample. Linear regression was calculated with nonweighting and non-zero-forced, and the linear equation was obtained: y=0.198x-0.0062 (r2=0.9997). Over the entire concentration range of the calibration curves, the mean observed percentage deviation of back-calculated concentrations was between 1.5 and 5.0 % with an imprecision (CV) of <10%.
To understand the sensitivity of the method, we determined the limit of quantification (LOQ) and the limit of detection (LOD). LOQ was defined as the lowest concentration that could be reliably and reproducibly measured with values for accuracy and intra- and interday imprecision (coefficient of variation (CV) <20%). LOQ of this method was determined to be 0.20 μM, based on direct measurements of a series of diluted PS2 calibration solutions. LOD, defined as the lowest concentration that gave a signal-to-noise ratio of at least 3, was 0.07 μM.
Trapping and quantifying sulfane sulfurs by mass spectrometry
Next we decided to verify the effectiveness of isotope dilution mass spectrometry assay in the quantification of sulfane sulfurs. A model experiment was carried out (Figure 9, the detailed experimental protocols were described in Materials and Methods). Cysteine polysulfide 7 was employed as the model of sulfane sulfurs. A series of solutions of 7 were prepared in a mixed solvent of acetonitrile and phosphate buffer (4/1). The final sulfane sulfur concentrations were 0, 1, 2.5, 5, 7.5, and 10 μM, respectively. Then phosphine P2 (100 μM) was added into each sample and the reactions were kept at rt. After 3 h the internal standard PS1 (5 μM) was spiked into each sample and solutions were subjected to MALDI-TOF/TOF mass analysis. As expected we observed very distinct mass peaks of PS2 (462.1, M+K+) and PS1 (465.1, M+K+). The intensity ratios of these two peaks allowed us to deduce the concentrations of PS2 from the spiked concentration of PS1. As summarized in Table 1, the measured concentrations of PS2 were 0, 0.99, 2.54, 5.0, 7.34, and 10.3 μM, which correlated well to the initial sulfane sulfur concentrations of compound 7. These results demonstrated that the phosphine based isotope dilution method was effective in the determination of sulfane sulfur concentrations.
Figure 9.

schematic descriptions of the isotope dilution mass protocol and a representative mass spectrum.
Table 1. A model study to quantify sulfane sulfurs.
| Initial sulfane sulfur concentration of 7 (μM) | 0 | 1 | 2.5 | 5 | 7.5 | 10 |
|---|---|---|---|---|---|---|
| ratio of PS1/PS2 | 0 | 5.03±0.2 | 1.96±0.07 | 1.00±0.01 | 0.68±0.04 | 0.48± 0.01 |
| Measured sulfane sulfur concentration (μM) | 0 | 0.99±0.05 | 2.54±0.10 | 5.00 ±0.01 | 7.34 ± 0.44 | 10.3±0.3 |
Quantification of sulfane sulfurs in tissue samples
Finally we applied this method to determine sulfane sulfur concentrations in mice tissues. The protocol is illustrated in Figure 10 and described in the Materials and Methods. The results were shown in Table 2. Plasma and erythrocytes were found to have relatively low sulfane sulfur concentrations (4.7-13.1 nmol/g and 2.3-3.7 nmol/g), while other organs maintained higher concentrations. The average concentrations were 57.0 nmol/g (liver), 150.9 nmol/g (kidney), 46.0 nmol/g (brain), 61.8 nmol/g (heart), and 56.1 nmol/g (spleen). The concentrations of sulfane sulfur in lung were a bit lower (20.8 nmol/g). These data were comparable to reported values.13
Figure 10.

The general procedure for the quantification of sulfane sulfur in mice tissues.
Table 2. Sulfane sulfur concentrations in tissues.
| Sulfane sulfurs (nmol/9) | Plasma | Erythrocytes | Liver | Kidney | Brain | Heart | Lung | Spleen |
|---|---|---|---|---|---|---|---|---|
|
| ||||||||
| Mouse | ||||||||
| 1 | 13.1 | 2.8 | 52.5 | 125.0 | 43.5 | 62.8 | 20.8 | 60.9 |
| 2 | - | - | 53.4 | 148.8 | 38.1 | 66.1 | 19.6 | 54.8 |
| 3 | 6.5 | 2.3 | 58.6 | 148.8 | 42.5 | 45.2 | 16.2 | 48.8 |
| 4 | 4.7 | 3.7 | 63.3 | 181.1 | 59.8 | 73.1 | 24.5 | 60.0 |
| average | 8.1 | 2.9 | 57.0 | 150.9 | 46.0 | 61.8 | 20.3 | 56.1 |
Conclusion
In summary, we reported in this study a convenient isotope dilution mass assay for sulfane sulfur detection. The strategy was based on a selective reaction between triphenylphosphine derivatives and sulfane sulfurs. The specificity and efficiency of the method were proved by model reactions. It was also applied in the measurement of sulfane sulfurs in mice tissues including brain, kidney, lung, liver, heart, spleen and blood.
Acknowledgments
This work is supported by NIH (R01HL116571) and the ACS-Teva USA Scholar Grant.
Footnotes
The reactions between triphenylphosphine derivatives and sulfane sulfurs were studied.
Based on these reactions, a convenient isotope dilution mass assay for sulfane sulfur detection was developed.
The method was used in the determination of sulfane sulfur concentrations in mice tissues.
Publisher's Disclaimer: This is a PDF file of an unedited manuscript that has been accepted for publication. As a service to our customers we are providing this early version of the manuscript. The manuscript will undergo copyediting, typesetting, and review of the resulting proof before it is published in its final citable form. Please note that during the production process errors may be discovered which could affect the content, and all legal disclaimers that apply to the journal pertain.
References
- 1.Gruhlke MCH, Slusarenko AJ. The biology of reactive sulfur species (RSS) Plant Physiol Biochem. 2012;59:98. doi: 10.1016/j.plaphy.2012.03.016. [DOI] [PubMed] [Google Scholar]
- 2.Giles GI, Jacob C. Reactive sulfur species: an emerging concept in oxidative stress. Biol Chem. 2002;383:375. doi: 10.1515/BC.2002.042. [DOI] [PubMed] [Google Scholar]
- 3.Giles GI, Tasker KM, Jacob C. Hypothesis:the role of reactive sulfur species in oxidative stress. Free Rad Biol Med. 2001;31:1279. doi: 10.1016/s0891-5849(01)00710-9. [DOI] [PubMed] [Google Scholar]
- 4.Toohey JI. Sulfur signaling: Is the agent sulfide or sulfane? Anal Biochem. 2011;413:1. doi: 10.1016/j.ab.2011.01.044. [DOI] [PubMed] [Google Scholar]
- 5.Jacob C, Anwar A, Burkholz T. Perspective on recent developments on sulfur-containing agents and hydrogen sulfide signaling. Planta Med. 2008;74:1580. doi: 10.1055/s-0028-1088299. [DOI] [PubMed] [Google Scholar]
- 6.Francoleon NE, Carrington SJ, Fukuto JM. The reaction of H2S with oxidized thiols: generation of persulfides and implications to H2S biology. Arch Biochem Biophys. 2011;516:146. doi: 10.1016/j.abb.2011.09.015. [DOI] [PubMed] [Google Scholar]
- 7.Kimura Y, Mikami Y, Osumi K, Tsugane M, Oka JI, Kimura H. Polysulfides are possible H2S-derived signaling molecules in rat brain. FASEB J. 2013;27:2451. doi: 10.1096/fj.12-226415. [DOI] [PubMed] [Google Scholar]
- 8.Koike S, Ogasawara Y, Shibuya N, Kimura H, Ishii K. Polysulfide exerts a protective effect against cytotoxicity caused by t-buthylhydroperoxide through Nrf2 signaling in neuroblastoma cells. FEBS Lett. 2013;587:3548. doi: 10.1016/j.febslet.2013.09.013. [DOI] [PubMed] [Google Scholar]
- 9.Nagy P, Pálinkás Z, Nagy A, Budai B, Tóth I, Vasas A. Chemical aspects of hydrogen sulfide measurements in physiological samples. Biochim Biophys Acta. 2014;1840:876. doi: 10.1016/j.bbagen.2013.05.037. [DOI] [PubMed] [Google Scholar]
- 10.Kimura H. Physiological role of hydrogen sulfide and polysulfide in the central nervous system. Neurochem Int. 2013;63:492. doi: 10.1016/j.neuint.2013.09.003. [DOI] [PubMed] [Google Scholar]
- 11.Kabil O, Motl N, Banerjee R. H2S and its role in redox signaling. Biochim Biophys Acta. 2014 doi: 10.1016/j.bbapap.2014.01.002. [DOI] [PMC free article] [PubMed] [Google Scholar]
- 12.Kimura H. The physiological role of hydrogen sulfide and beyond. Nitric Oxide. 2014 doi: 10.1016/j.niox.2014.01.002. [DOI] [PubMed] [Google Scholar]
- 13.Ubuka T. Assay methods and biological roles of labile sulfur in animal tissues. J Chromatogr B: Anal Technol Biomed Life Sci. 2002;781:227. doi: 10.1016/s1570-0232(02)00623-2. [DOI] [PubMed] [Google Scholar]
- 14.Toohey JI. Sulphane sulphur in biological systems: a possible regulatory role. Biochem J. 1989;264:625. doi: 10.1042/bj2640625. [DOI] [PMC free article] [PubMed] [Google Scholar]
- 15.Westley AM, Westley J. Biological sulfane sulfur. Anal Biochem. 1991;195:63. doi: 10.1016/0003-2697(91)90295-5. [DOI] [PubMed] [Google Scholar]
- 16.Mueller EG. Trafficking in persulfides: delivering sulfur in biosynthetic pathways. Nat Chem Biol. 2006;2:185. doi: 10.1038/nchembio779. [DOI] [PubMed] [Google Scholar]
- 17.Wood JL. Sulfane sulfur. Methods Enzymol. 1987;143:25. doi: 10.1016/0076-6879(87)43009-7. [DOI] [PubMed] [Google Scholar]
- 18.Ida T, Sawa T, Ihara H, Tsuchiya Y, Watanabe Y, Kumagai Y, Suematsu M, Motohashi H, Fujii S, Matsunaga T, Yamamoto M, Ono K, Devarie-Baez NO, Xian M, Fukuto JM, Akaike T. Reactive cysteine persulfides and S-polythiolation regulate oxidative stress and redox signaling. Proc Natl Acad Sci USA. 2014;111:7606. doi: 10.1073/pnas.1321232111. [DOI] [PMC free article] [PubMed] [Google Scholar]
- 19.Shen X, Peter EA, Bir S, Wang R, Kevil CG. Analytical measurement of discrete hydrogen sulfide pools in biological specimens. Free Radical Biol Med. 2012;55:2276. doi: 10.1016/j.freeradbiomed.2012.04.007. [DOI] [PMC free article] [PubMed] [Google Scholar]
- 20.Chen W, Liu C, Peng B, Zhao Y, Pacheco A, Xian M. New fluorescent probes for sulfane sulfurs and the application in bioimaging. Chem Sci. 2013;4:2892. doi: 10.1039/C3SC50754H. [DOI] [PMC free article] [PubMed] [Google Scholar]
- 21.Moore CG, Trego BR. The reaction of triphenylphosphine with unsymmetrical dialkenyl disulphides and with symmetrical dialkenyl trisulphides. Tetrahedron. 1963;19:1251. [Google Scholar]
- 22.Hannestad U, Margheri S, Sörbo B. A sensitive gas chromatographic method for determination of protein-associated sulfur. Anal Biochem. 1989;178:394. doi: 10.1016/0003-2697(89)90659-3. [DOI] [PubMed] [Google Scholar]
- 23.Rosenblum C. Principles of isotope dilution assays. Anal Chem. 1957;29:1740. [Google Scholar]
- 24.Ciccimaro E, Blair IA. Stable-isotope dilution LC–MS for quantitative biomarker analysis. Bioanalysis. 2010;2:311. doi: 10.4155/bio.09.185. [DOI] [PMC free article] [PubMed] [Google Scholar]
- 25.Hu CW, Chao MR, Sie CH. Urinary analysis of 8-oxo-7,8-dihydroguanine and 8-oxo-7,8-dihydro-2′-deoxyguanosine by isotope-dilution LC-MS/MS with automated solid-phase extraction: study of 8-oxo-7,8-dihydroguanine stability. Free Radic Biol Med. 2010;48:89. doi: 10.1016/j.freeradbiomed.2009.10.029. [DOI] [PubMed] [Google Scholar]
- 26.Tang G, Qin J, Hao Ly, Yin Sa, Russell RM. Use of a short-term isotope-dilution method for determining the vitamin A status of children. Am J Clin Nutr. 2002;76:413. doi: 10.1093/ajcn/76.2.413. [DOI] [PubMed] [Google Scholar]
- 27.Milton MJT, Wielgosz RI. Uncertainty in SI-traceable measurements of amount of substance by isotope dilution mass spectrometry. Metrologia. 2000;37:199. [Google Scholar]
- 28.Liu X, Lovell MA, Lynn BC. Development of a method for quantification of acrolein-deoxyguanosine adducts in DNA using isotope dilution-capillary LC/MS/MS and its application to human brain tissue. Anal Chem. 2005;77:5982. doi: 10.1021/ac050624t. [DOI] [PubMed] [Google Scholar]
- 29.Chan W, Chen B, Wang L, Taghizadeh K, Demott MS, Dedon PC. Quantification of the 2-deoxyribonolactone and nucleoside 5′-aldehyde products of 2-deoxyribose oxidation in DNA and cells by isotope-dilution gas chromatography mass spectrometry: differential effects of gamma-radiation and Fe2+-EDTA. J Am Chem Soc. 2010;132:6145. doi: 10.1021/ja910928n. [DOI] [PMC free article] [PubMed] [Google Scholar]
- 30.Stadler A, Kappe CO. Rapid formation of triarylphosphines by microwave-assisted transition metal-catalyzed C-P cross-coupling reactions. Org Lett. 2002;4:3541. doi: 10.1021/ol026716b. [DOI] [PubMed] [Google Scholar]
- 31.König W, Geiger R. Eine neue methode zur synthese von peptiden: aktivierung der carboxylgruppe mit dicyclohexylcarbodiimid unter zusatz von 1-hydroxy-benzotriazolen. Chem Ber. 1970;103:788. doi: 10.1002/cber.19701030319. [DOI] [PubMed] [Google Scholar]
- 32.Rella MR, Williard PG. Oxidation of peptides by methyl(trifluoromethyl)dioxirane: the protecting group matters. J Org Chem. 2007;72:525. doi: 10.1021/jo061910n. [DOI] [PMC free article] [PubMed] [Google Scholar]
- 33.Hamzavi R, Dolle F, Tavitian B, Dahl O, Nielsen PE. Modulation of the pharmacokinetic properties of PNA: preparation of galactosyl, mannosyl, fucosyl, N-acetylgalactosaminyl, and N-acetylglucosaminyl derivatives of aminoethylglycine peptide nucleic acid monomers and their incorporation into PNA oligomers. Bioconjugate Chem. 2003;14:941. doi: 10.1021/bc034022x. [DOI] [PubMed] [Google Scholar]