Abstract
The primary purpose of this study was to compare static and dynamic optimization muscle force and work predictions during the push phase of wheelchair propulsion. A secondary purpose was to compare the differences in predicted shoulder and elbow kinetics and kinematics and handrim forces. The forward dynamics simulation minimized differences between simulated and experimental data (obtained from 10 manual wheelchair users) and muscle co-contraction. For direct comparison between models, the shoulder and elbow muscle moment arms and net joint moments from the dynamic optimization were used as inputs into the static optimization routine. RMS errors between model predictions were calculated to quantify model agreement. There was a wide range of individual muscle force agreement that spanned from poor (26.4 % Fmax error in the middle deltoid) to good (6.4 % Fmax error in the anterior deltoid) in the prime movers of the shoulder. The predicted muscle forces from the static optimization were sufficient to create the appropriate motion and joint moments at the shoulder for the push phase of wheelchair propulsion, but showed deviations in the elbow moment, pronation-supination motion and hand rim forces. These results suggest the static approach does not produce results similar enough to be a replacement for forward dynamics simulations, and care should be taken in choosing the appropriate method for a specific task and set of constraints. Dynamic optimization modeling approaches may be required for motions that are greatly influenced by muscle activation dynamics or that require significant co-contraction.
Keywords: upper extremity, biomechanics, musculoskeletal model, forward dynamics
INTRODUCTION
Numerous studies using inverse dynamics analyses have documented high mechanical loads on the upper extremity (UE) during handrim wheelchair propulsion (Rodgers et al. 1994; Robertson et al. 1996; Boninger et al. 1997; Kulig et al. 1998; Boninger et al. 1999; Boninger et al. 2000; Boninger et al. 2002; Veeger et al. 2002; Rozendaal and Veeger 2003). While providing useful data and insights that can aid in determining potential links between propulsion mechanics and the development of pain, clinical interpretations made from intersegmental joint forces and moments calculated from an inverse dynamics model are limited. Intersegmental forces do not represent the articulating surface load (i.e., joint contact force), and moments are an estimate of the net action of all muscles crossing each joint. Because measuring in-vivo joint contact forces without an invasive procedure is not feasible, more complex musculoskeletal modeling and optimization techniques are needed to estimate joint contact forces and individual muscle contributions to the joint moment. This information is useful in identifying activities and conditions that place manual wheelchair users at increased risk for shoulder pain and rotator cuff injury.
The majority of prior investigations have utilized static optimization techniques to solve the indeterminate muscle force distribution problem at the shoulder joint during wheelchair propulsion (Veeger et al. 2002; Lin et al. 2004; van Drongelen et al. 2005; van Drongelen et al. 2006; Dubowsky et al. 2008; Morrow et al. 2009; Rankin et al. 2011). Dynamic optimization techniques, which have been found to be useful in other movements such as pedaling, standing and walking (Rankin and Neptune 2010; Nataraj et al. 2012; Miller et al. 2013) have recently been used with upper extremity models to investigate manual wheelchair propulsion biomechanics (Rankin et al. 2011; Rankin et al. 2012; Slowik and Neptune 2013). Compared to dynamic optimization, static optimization has a much lower computational cost. However, unlike dynamic optimization, the method is time-independent and does not include the time-dependent physiological nature of muscles. Thus, it is not clear whether static optimization predictions of muscle forces can be used to investigate wheelchair propulsion mechanics. Anderson and Pandy (2001) investigated the necessity of complex forward dynamics techniques to simulate half a gait cycle during walking using a lower extremity (LE) model and found the muscle force predictions between static and dynamic approaches were practically equivalent. However, it is unknown if Anderson and Pandy’s (2001) conclusions are generalizable to UE tasks. A comparison performed for the UE may differ from the LE due to its increased range of motion, complexity of the musculature and different task demands.
Therefore, the primary purpose of this study was to assess whether the UE muscle force and muscle work predictions during the push phase of wheelchair propulsion generated from static and dynamic optimization are the same. A secondary purpose was to compare the differences in predicted shoulder and elbow kinetics and kinematics and handrim forces between a dynamic simulation and a dynamic simulation driven by the statically-optimized muscle forces. We expected that, despite the increase in complexity and range of motion of the movement compared to walking, static and dynamic muscle force predictions would show good agreement. However, due to the complex non-linear UE dynamics, we expected that even small differences in the static muscle force solution would cause the simulation to deviate from the forward dynamics solution when used to drive the model.
METHODS
Data Collection
A previously collected dataset using a cross-sectional, observational study design of manual wheelchair users (Rankin et al. 2012) was used as the basis for performing the static and dynamic optimization analyses. Twelve experienced manual wheelchair users (10 men, 2 women) with an average age of 32 years provided informed consent. All data collection procedures were performed at MAX Mobility, LLC (Antioch, TN). Testing was conducted on a custom-built wheelchair treadmill while each subject propelled their own wheelchair at a selfselected speed (Rankin et al. 2012). Shoulder and elbow kinematics were obtained using a 3-camera motion capture system (Phoenix Technologies Inc., BC, Canada) with an active marker set. Markers were placed on the head, sternum and right side acromium process, lateral epicondyle, radial and ulnar styloids, 3rd and 5th metcapophalangeal joints, 2nd proximal interphalangeal joint and wheelchair hub. Marker data were collected at 100 Hz and low-pass filtered (10 Hz) using an eighth-order Butterworth filter. Handrim kinetics and wheel angle were recorded at 200 Hz using an OptiPush force sensing wheel (MAX Mobility, LLC) (Richter and Axelson 2005) and low-pass filtered (20 Hz) using an eighth-order Butterworth filter.
Musculoskeletal Model
An UE musculoskeletal model was developed in SIMM (Musculographics, Inc., Santa Rosa, CA) with associated muscle properties and origin/insertion sites based on the work by Holzbaur et al. (2005) and Rankin et al. (2011). The model consisted of rigid segments representing the trunk, right upper arm, forearm (independent ulna and radius) and hand of a 50th percentile male. Articulations were defined between rigid segments to represent anatomical joints at the shoulder (3 DOF: shoulder elevation plane, shoulder elevation angle, shoulder internal/external rotation) and elbow (2 DOF: Flexion-Extension, Pronation-Supination). Trunk lean and hand location were constrained based on experimental data and a scapulohumeral rhythm was defined from cadaver data of subjects with no apparent upper extremity dysfunction (de Groot and Brand 2001). The model was driven by 26 Hill-type musculotendon actuators to represent the major UE muscles crossing the shoulder and elbow joints. Each actuator was defined using two states (activation, fiber length) and was governed by intrinsic force-length-velocity relationships (Zajac 1989). All other model parameters were selected from Holzbaur et al. (2005). Musculotendon lengths and moment arms were determined as a function of the joint angles at each time step of the motion using polynomial equations (Rankin and Neptune 2012). The resultant dynamic model had 8 kinematic states (trunk lean, three shoulder angles, elbow flexion-extension and pronation-supination) and 26 muscle activation and fiber length states.
Dynamic and Static Optimization
Dynamic simulation data were obtained from the push phase of a single forward dynamics simulation that reproduced the group average experimental data (identical to Rankin et al. 2011) using a global optimization algorithm (simulated annealing, Goffe et al. 1994). The algorithm determined the muscle excitation patterns that minimized differences between simulated and experimental joint kinematics (shoulder, elbow and wrist) and handrim forces using an optimal tracking cost function in the form of Neptune et al. (2001):
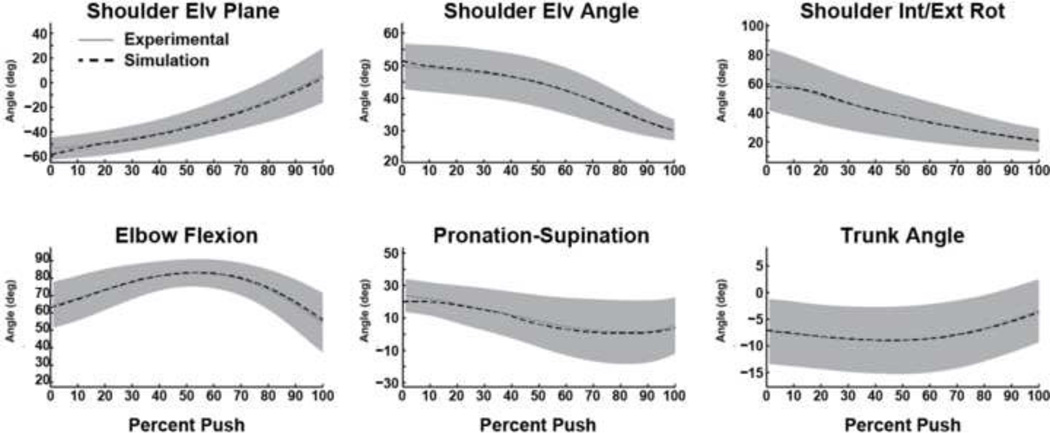
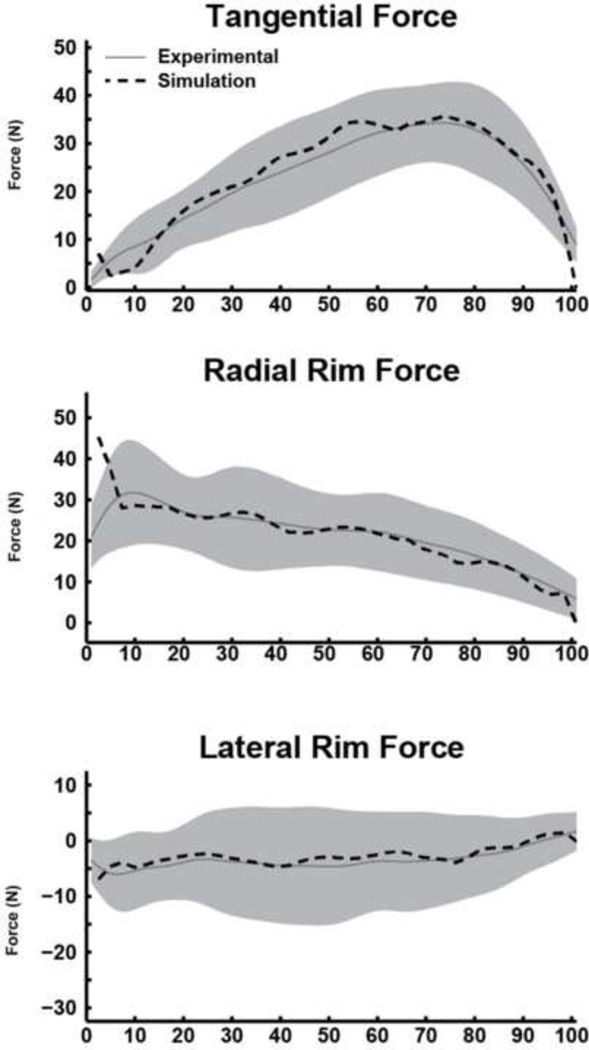
where Yij and Ŷij are the experimental and corresponding simulation value for variable j at time step i and SDj is the standard deviation of variable j calculated from the experimental data. Based on the assumption that the efficiency of the human neuromuscular system is governed by the minimization of redundant muscle activation for a given task, an additional term was included in the cost function that was directly proportional to muscle stress (i.e., force ratio, expressed as percentage of maximum isometric force) to reduce co-contraction. The average force percentage was calculated over the motion for each muscle and then summed across all muscles. Individual terms in the tracking cost function were weighted independently and adjusted in an iterative manner until tracking of joint kinematics and handrim kinetics were within 1 SD of the experimental data (Figs. 1 & 2). The weight on the muscle stress term was then increased iteratively until an increase in tracking errors was observed.
Figure 1.
Comparisons between the experimental and dynamic simulation kinematic data. Average experimental and simulation values are represented by solid and dashed lines, respectively. Shaded regions represent ±1SD of the experimental data.
Figure 2.
Comparisons between the experimental and dynamic simulation hand rim force data. Average experimental and simulation values are represented by solid and dashed lines, respectively. Shaded regions represent ±1SD of the experimental data.
To allow for a direct comparison between approaches, the muscle moment arms and net joint moments at the shoulder and elbow from the dynamic optimization were then used as input into the static optimization routine (Morrow et al. 2009). For the static optimization, the identical musculoskeletal model parameters were implemented in MATLAB (Mathworks, Nantucket, MA). The static optimization used a quadratic programming algorithm to predict the muscle forces constrained to produce the dynamic optimization net joint moments while minimizing the sum of the each muscle’s force ratio squared (equivalent to the sum of the muscle activations squared). The static optimization defined the upper limit on muscle forces as the maximum isometric force (Fmax) utilized in the dynamic musculoskeletal model, and therefore, it did not require muscle activation-deactivation dynamics or intrinsic muscle properties (i.e., the force-length-velocity relationships).
Analysis
Predicted muscle forces were normalized to Fmax for each muscle (Rankin et al. 2011). To compare the static and dynamic optimization solutions, the root mean square error (RMSE) between solutions was determined for each muscle and then averaged across muscles to yield a global RMSE with units of % Fmax. Because the RMSE data are normalized to Fmax, thresholds were set to define the comparisons as excellent (<5 % Fmax), good (5–10 % Fmax), moderate (11–20 % Fmax) and poor (>20 % Fmax) agreements. In addition, peak force and total muscle mechanical work (positive work + absolute value of the negative work) were determined for all muscles from each solution for qualitative comparison.
To test whether the static optimization results could produce a simulation with similar kinematics and kinetics as the dynamic optimization solution, an additional forward dynamics simulation was generated by driving the model with the predicted muscle forces from the static optimization. The dynamic simulation driven by the statically-optimized muscle forces overrode the "muscle model/excitation level" generated forces and instead applied the previously predicted static optimization muscle forces at each time step. Muscle moments were then calculated during the simulation using these input force values. As a result, the applied muscle moments could differ from the original dynamic optimization simulation since the UE kinematics were free to change from the original simulation, which would lead to temporal changes in the muscle moment arms. Shoulder and elbow kinematics, joint moments and handrim forces were then compared between the dynamic simulation and the dynamic simulation driven by the statically-optimized muscle forces using the RMSE.
RESULTS
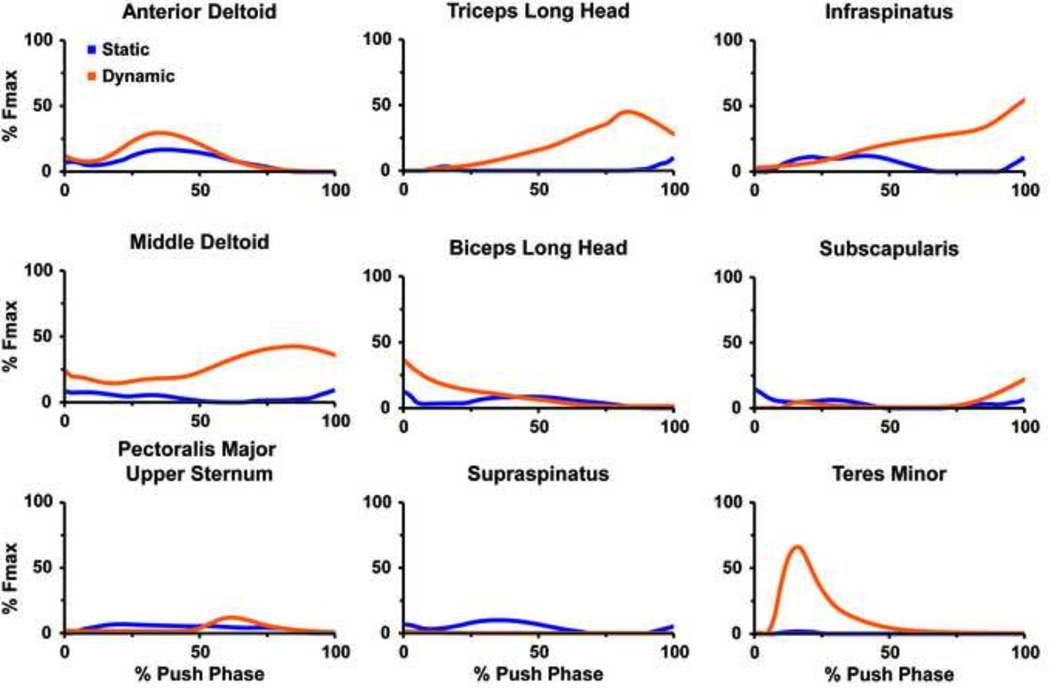
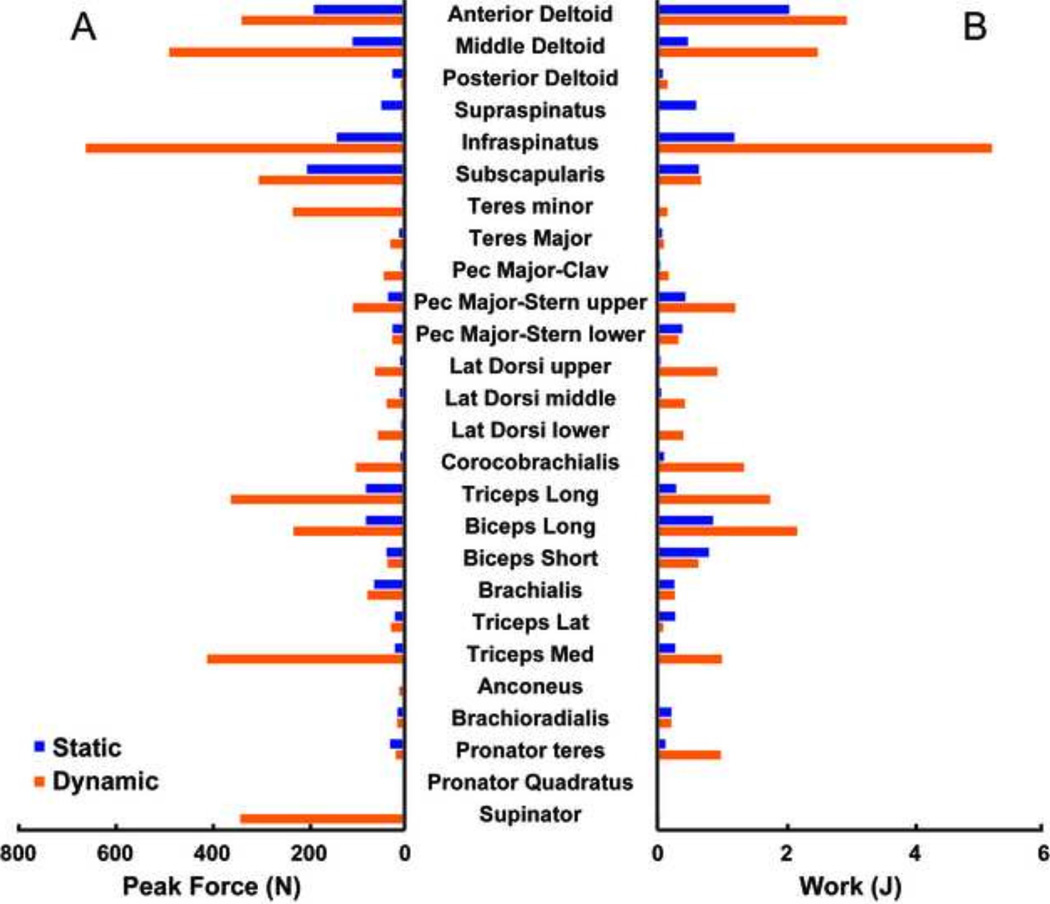
There was a range of good to poor agreement in the general waveform of the predicted muscle forces between the static and dynamic solutions for the prime movers (i.e., anterior deltoid, middle deltoid, pectoralis major, triceps long head and biceps long head) and rotator cuff musculature (i.e., suprapinatus, infraspinatus, subscapularis and teres minor) (Fig. 3). The global RSME value between the static and dynamic solutions was borderline between good and moderate (9.9 % Fmax, Table 1). In the rotator cuff and prime mover muscles, the posterior deltoid had the best agreement (1.7 % Fmax) while the middle deltoid had the worst (26.4 % Fmax). The dynamic optimization predicted larger peak forces of the prime movers and rotator cuff muscles than the static solution (Fig. 4A) except for the posterior deltoid, supraspinatus, biceps short head and triceps lateralis. The dynamic optimization predicted the largest peak forces in the infraspinatus and middle deltoid. The static optimization predicted the largest peak forces in the subscapularis and anterior deltoid. Similar to the peak forces, the dynamic optimization predicted larger total work magnitudes (Fig. 4B) than the static solution with the exception of the muscles that had larger static peak forces. The overall RMSE for the muscle work between models was 1.1 J.
Figure 3.
Predicted muscle force time series for the upper extremity prime movers and rotator cuff musculature during the push phase of wheelchair propulsion obtained from static (blue) and dynamic (orange) optimization approaches.
Table 1.
RMS Error for dynamic versus static optimization force predictions
| Muscle | Dynamic vs. Static RMS Error (%Fmax) |
|---|---|
| Anterior Deltoid | 6.4 |
| Middle Deltoid | 26.4 |
| Posterior Deltoid | 1.7 |
| Supraspinatus | 5.5 |
| Infraspinatus | 22.2 |
| Subscapularis | 5.9 |
| Teres minor | 22.4 |
| Teres Major | 1.4 |
| Pec Major-Clav | 3.9 |
| Pec Major-Stern upper | 9.8 |
| Pec Major-Stern lower | 4.6 |
| Lat Dorsi upper | 9.7 |
| Lat Dorsi middle | 4.9 |
| Lat Dorsi lower | 12.7 |
| Corocobrachialis | 20.7 |
| Triceps Long | 23.2 |
| Biceps Long | 9.3 |
| Biceps Short | 4.7 |
| Brachialis | 4.5 |
| Triceps Lateral | 1.7 |
| Triceps Medial | 20.1 |
| Anconeous | 1.3 |
| Brachioradialis | 3.8 |
| GLOBAL RMSE | 9.9 |
Figure 4.
Peak forces (A) and net muscle work (B) during the push phase of wheelchair propulsion obtained from the static (blue) and dynamic (orange) optimization approaches.
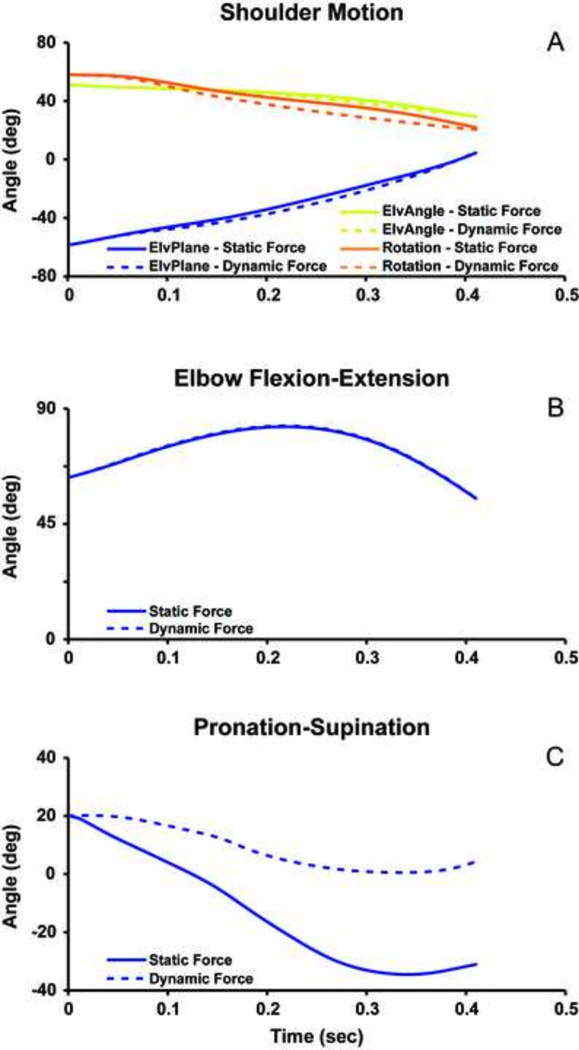
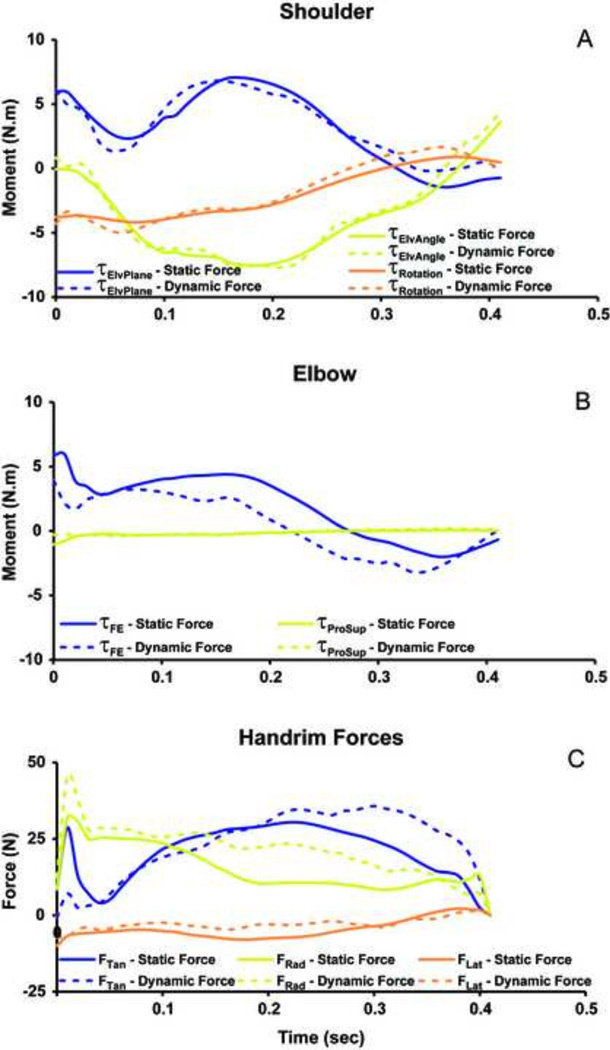
The dynamic simulation accurately reproduced experimental joint kinematics and handrim forces (Table 2). The UE motion from the dynamic simulation driven by the statically-optimized muscle forces showed excellent agreement with the dynamic simulation for the shoulder (Fig. 5A) and elbow flexion-extension (Fig. 5B) with RMSE values less than 5° (Table 2). However, the predicted forearm pronation-supination from the dynamic simulation using statically-optimized muscle forces had poor agreement with the dynamic simulation with differences up to 35° (Fig. 5C) and an RMSE of 25°. The predicted shoulder moments showed excellent agreement between the two simulations (Fig. 6A) with RSME values less than 0.9 Nm (Table 2). The elbow flexion moment showed agreement in the general waveform between the simulations (Fig. 6B), but there were differences in the magnitude throughout the push phase resulting in an RMSE of 1.8 Nm. There was excellent agreement in the forearm pronation-supination moment (Fig. 6B). The predicted handrim force comparisons had RMSE values from 2.6 to 8.0 N (Table 2, Fig. 6C).
Table 2.
RMS Error for dynamic simulation compared to dynamic simulation using statically-optimized muscle forces and RMS Error for experimental (exp) data compared to dynamically simulated data for the push phase of the forward dynamics simulation
| Measure (units) | Dynamic vs. Static RMS Error |
Dynamic vs. Exp RMS Error |
|---|---|---|
| Shoulder elevation plane(deg) | 2.4 | 0.6 |
| Shoulder elevation angle (deg) | 1.3 | 2.3 |
| Shoulder int/ext rotation (deg) | 4.4 | 1.2 |
| Elbow flexion (deg) | 0.3 | 1.3 |
| Pronation supination (deg) | 25.0 | 1.3 |
| Shoulder elevation plane moment (N.m) | 0.8 | |
| Shoulder elevation angle moment (N.m) | 0.6 | |
| Shoulder int/ext rotation moment (N.m) | 0.5 | |
| Elbow flexion moment (N.m) | 1.8 | |
| Pronation supination moment (N.m) | 0.2 | |
| Rim tangential force (N) | 8.0 | 2.3 |
| Rim radial force (N) | 7.6 | 3.8 |
| Rim lateral froce (N) | 2.6 | 1.1 |
Figure 5.
Forward dynamic simulation results for (A) shoulder joint moment, (B) elbow flexion-extension, and (C) Pronation-supination from static (solid line) and dynamic (dotted line) predicted muscle forces during the push phase of wheelchair propulsion. ElvPlane refers to the shoulder elevation plane angle, ElvAngle refers to the shoulder elevation angle, and Rotation refers to the internal-external rotation of the shoulder.
Figure 6.
Forward dynamic simulation results for (A) shoulder joint moments (τ), (B) elbow joint moments (τ), and (C) hand rim forces from static (solid line) and dynamic (dotted line) predicted muscle forces during the push phase of wheelchair propulsion.. ElvPlane refers to the shoulder elevation plane axis, ElvAngle refers to the shoulder elevation axis, and Rotation refers to the internal-external rotation axis of the shoulder. FE refers to the flexion-extension axis of the elbow, and ProSup refers to the pronation-supination axis of the forearm. The tangential (Tan), radial (Rad), and lateral forces (Lat) are shown for the handrim.
DISCUSSION
This study compared predicted muscle forces during the push phase of wheelchair propulsion between static (Morrow et al. 2009) and dynamic (Rankin et al. 2011) optimization approaches using an identical UE model. Using the muscle moment arms and net joint moments at the shoulder and elbow from the dynamic optimization as inputs into the static optimization routine allowed for a direct comparison. Additionally, we compared how differences in the muscle forces predicted by the static and dynamic approaches influence simulated UE motion and kinetics. The 9.9% global RMSE between the static and dynamic predicted muscle forces indicates the agreement between solutions was at the low end of a good agreement. Surprisingly, the dynamic simulation driven by the statically-optimized muscle forces was stable and compared well with the dynamic simulation shoulder kinematics (RMSE < 5°) and kinetics (RMSE < 0.9 Nm). However, the magnitudes of the elbow flexion moment and rim forces did not compare as well between the original dynamic simulation and the dynamic simulation driven by the statically-optimized muscle forces (Table 2).
To reduce confounding differences between the two optimization methods, the net joint moments in the static optimization were constrained to match the dynamic optimization moments. This resulted in similar overall net muscle work; however, the dynamic approach predicted higher muscle forces than the static approach (Fig. 4) in the majority of the muscles. The RMSE force values between the static and dynamic solutions ranged from 1.3 to 26.4 % Fmax (Table 1). Generally, the muscles with the smallest predicted activation throughout the push phase and no appreciable isolated peaks had the best agreement between models (e.g., supraspinatus). The muscles with the worst agreement occurred when the dynamic approach predicted large force values while the static model predicted low values (e.g., infraspinatus and teres minor, Fig. 3).
The two approaches had a range of good to poor agreement in the forces generated by muscles responsible for the majority of the joint motion at the shoulder and elbow during the push phase. The force patterns showed good agreement between the static and dynamic approaches in the anterior deltoid muscle (Fig. 3), which is largely responsible for the forward flexion of the humerus (shoulder plane of elevation, Fig. 5A). The humerus flexion has the largest range of motion about the shoulder during the push phase. Similarly, the force patterns compared well between approaches in the biceps long head (Fig. 3), which is responsible for elbow flexion during the first half of the push phase (Fig. 5B). In contrast, the middle deltoid and triceps long head (Fig. 3) had poor agreement between approaches (Table 1). The static approach showed minimal to no activation of the middle deltoid, which is responsible for the lateral elevation (abduction) of the humerus, while the dynamic approach predicted peak activation of the middle deltoid over 40 % Fmax. The dynamic solution also predicted a large activation of the triceps long head (> 40% Fmax) towards the end of the push phase to extend the elbow while the static solution predicted a much smaller value (< 10 % Fmax).
When using the muscle forces from the static optimization to drive a forward dynamics simulation, the shoulder joint kinematics and moments were simulated well. However, differences between the two approaches increased distally along the arm, with the largest differences occurring in the pronation-supination angle and resulting rim forces (Figs. 5 & 6). This is partly explained by the setup of the static optimization approach, which optimized shoulder and elbow joint net moments but did not account for the wrist which drives forearm pronation-supination. The pronation-supination was the one degree of freedom not greatly influenced by the constraints associated with wheelchair propulsion (cyclical movement, limited cycle-to-cycle variability), and presumably, in UE tasks that are less constrained, the static approach would perform worse.
The agreement between the static and dynamic approaches in our study was not as good as that presented by Anderson and Pandy (2001), who showed a more favorable agreement between approaches during half a gait cycle simulation of walking. Walking is a complex, highly nonlinear dynamic task that can require carefully setting the initial conditions and terminal constraints, and selecting an appropriate cost function to simulate effectively. As a result, the dynamic optimization approach and short simulation duration used in Anderson and Pandy (2001) may have constrained the solution and contributed to the similar results between the dynamic and static approaches. In contrast, the dynamic optimization approach used in the present study solved the optimal tracking problem and evaluated the cost function after the simulation had reached steady-state (i.e., not until the third consecutive push and recovery cycle). Thus, the solution is independent of the initial conditions and has no explicit terminal constraints. Another factor potentially contributing to difference between studies is the difference in workload between the two tasks. In contrast to self-selected walking, wheelchair propulsion requires significant upper extremity demand that may require increased muscle co-contraction (e.g., at the transition between the push and recovery phases) relative to walking that is difficult to capture using static optimization.
In this study, we are not able to conclude which optimization method more closely predicts human muscle performance because we do not have the actual in vivo muscle, tendon and/or contact force measurements to reference. Although we cannot fully assess the accuracy of either method, our findings highlight that if the human subjects had used a similar pattern as the forward dynamics simulation, the static optimization approach would not have accurately predicted the human subject results. More general, for a given motion, a simple static optimization scheme using a standard optimal criterion is not able to closely match the dynamic simulation muscle force predictions in upper extremity movement. Although both approaches produced muscle forces and activation patterns that could approximately reproduce the kinematics, a qualitative assessment of the predicted muscle time-series plots obtained using the two methods (Fig. 1) would have not led to that conclusion. Predicted magnitudes and timing differ for nearly every muscle between methods, yet both muscle force solution sets closely approximate the experimental kinematics at the shoulder and elbow. This point serves as a reminder that the solution set is just one of many possible solutions and that extreme care should be taken to validate the underlying model assumptions and parameters that will govern the solution set.
Limitations of the musculoskeletal model and the dynamic and static approaches used in this study have been previously described (Morrow et al. 2009; Rankin et al. 2011). When comparing the two approaches, only one static optimization cost function (minimize force ratio) was presented. Additional cost functions were implemented post-hoc, but these did not improve the agreement between solutions. However, future studies could benefit from exploring other cost functions that might improve model agreement. Further, although the dynamic optimization tracked the body segment kinematics and hand rim forces, there were some minor differences in joint moment patterns between the inverse and forward dynamics solutions. Since static optimization analyses most often use joint moments derived from inverse dynamics rather than forward dynamics solutions, we would expect some differences with the static optimization results presented here. However, our primary goal was to investigate differences between the two optimization techniques, and we feel that constraining the static optimization to match the forward dynamics joint moments allowed for a more direct and clear comparison between the two methods. Finally, including the wrist may also improve the pronation-supination comparison. To fully test the capabilities of the static optimization to predict muscle forces from the dynamic approach, the hand translation constraints in the forward simulation could be relaxed to see how the static solution performs in a less constrained environment.
CONCLUSIONS
The dynamic and static approaches had good to moderate overall agreement with a wide range from excellent to poor in individual muscle agreement. The approaches did not compare as well as the walking analysis in Anderson and Pandy (2001), and the peak force data highlight considerable differences in the rotator cuff and large prime mover shoulder muscles. The predicted muscle forces from the static approach were sufficient to create the appropriate motion and joint moments at the shoulder for the push phase of wheelchair propulsion, but showed considerable deviations in the elbow moment, pronation-supination motion and hand rim forces. The inability of the static approach to replicate the forward dynamics simulation may highlight an underestimated co-contraction/joint stiffness needed to produce the dynamic movement. Based on these results, the static approach did not produce results similar enough to be a replacement for the dynamic simulation, and care should be taken in choosing the most appropriate method for a specific task and set of constraints. Finally, dynamic optimization modeling approaches may be required for motions that are greatly influenced by muscle activation dynamics or that require significant co-contraction.
Acknowledgements
Funding for this project was provided in part by the National Institutes of Health (R01HD48781 and T32 HD00447). The authors would also like to thank Dr. Mark Richter for providing the experimental data used in this study.
Footnotes
Publisher's Disclaimer: This is a PDF file of an unedited manuscript that has been accepted for publication. As a service to our customers we are providing this early version of the manuscript. The manuscript will undergo copyediting, typesetting, and review of the resulting proof before it is published in its final citable form. Please note that during the production process errors may be discovered which could affect the content, and all legal disclaimers that apply to the journal pertain.
Conflict of interest statement
The authors have no conflicts of interest to disclose.
REFERENCES
- Anderson FC, Pandy MG. Static and dynamic optimization solutions for gait are practically equivalent. Journal of Biomechanics. 2001;34(2):153–161. doi: 10.1016/s0021-9290(00)00155-x. [DOI] [PubMed] [Google Scholar]
- Boninger ML, Baldwin M, et al. Manual wheelchair pushrim biomechanics and axle position. Archives of Physical Medicine & Rehabilitation. 2000;81(5):608–613. doi: 10.1016/s0003-9993(00)90043-1. [DOI] [PubMed] [Google Scholar]
- Boninger ML, Cooper RA, et al. Wheelchair pushrim kinetics: body weight and median nerve function. Archives of Physical Medicine & Rehabilitation. 1999;80(8):910–915. doi: 10.1016/s0003-9993(99)90082-5. [DOI] [PubMed] [Google Scholar]
- Boninger ML, Cooper RA, et al. Wrist biomechanics during two speeds of wheelchair propulsion: an analysis using a local coordinate system. Archives of Physical Medicine & Rehabilitation. 1997;78(4):364–372. doi: 10.1016/s0003-9993(97)90227-6. [DOI] [PubMed] [Google Scholar]
- Boninger ML, Souza AL, et al. Propulsion patterns and pushrim biomechanics in manual wheelchair propulsion. Archives of Physical Medicine & Rehabilitation. 2002;83(5):718–723. doi: 10.1053/apmr.2002.32455. [DOI] [PubMed] [Google Scholar]
- de Groot JH, Brand R. A three-dimensional regression model of the shoulder rhythm. Clinical Biomechanics. 2001;16(9):735–743. doi: 10.1016/s0268-0033(01)00065-1. [DOI] [PubMed] [Google Scholar]
- Dubowsky SR, Rasmussen J, et al. Validation of a musculoskeletal model of wheelchair propulsion and its application to minimizing shoulder joint forces. J Biomech. 2008;41(14):2981–2988. doi: 10.1016/j.jbiomech.2008.07.032. [DOI] [PubMed] [Google Scholar]
- Goffe WL, Ferrier GD, et al. Global optimization of statistical functions with simulated annealing. Journal of econometrics. 1994;60:65–99. [Google Scholar]
- Holzbaur KR, Murray WM, et al. A model of the upper extremity for simulating musculoskeletal surgery and analyzing neuromuscular control. Ann Biomed Eng. 2005;33(6):829–840. doi: 10.1007/s10439-005-3320-7. [DOI] [PubMed] [Google Scholar]
- Kulig K, Rao SS, et al. Shoulder joint kinetics during the push phase of wheelchair propulsion. Clinical Orthopaedics & Related Research. 1998;(354):132–143. doi: 10.1097/00003086-199809000-00016. [DOI] [PubMed] [Google Scholar]
- Lin HT, Su FC, et al. Muscle forces analysis in the shoulder mechanism during wheelchair propulsion. Proc Inst Mech Eng [H] 2004;218(4):213–221. doi: 10.1243/0954411041561027. [DOI] [PubMed] [Google Scholar]
- Miller RH, Brandon SC, et al. Predicting sagittal plane biomechanics that minimize the axial knee joint contact force during walking. Journal of Biomechanical Engineering. 2013;135(1):011007. doi: 10.1115/1.4023151. [DOI] [PubMed] [Google Scholar]
- Morrow MMB, An KN, et al. Upper extremity musculoskeletal and optimization model validation. 2009 [Google Scholar]
- Nataraj R, Audu ML, et al. Center of mass acceleration feedback control for standing by functional neuromuscular stimulation: a simulation study. Journal of rehabilitation research and development. 2012;49(2):279–296. doi: 10.1682/jrrd.2010.12.0235. [DOI] [PMC free article] [PubMed] [Google Scholar]
- Neptune RR, Kautz SA, et al. Contributions of the individual ankle plantar flexors to support, forward progression and swing initiation during walking. Journal of Biomechanics. 2001;34(11):1387–1398. doi: 10.1016/s0021-9290(01)00105-1. [DOI] [PubMed] [Google Scholar]
- Rankin JW, Kwarciak AM, et al. The influence of wheelchair propulsion technique on upper extremity muscle demand: a simulation study. Clinical Biomechanics. 2012;27(9):879–886. doi: 10.1016/j.clinbiomech.2012.07.002. [DOI] [PMC free article] [PubMed] [Google Scholar]
- Rankin JW, Neptune RR. The influence of seat configuration on maximal average crank power during pedaling: a simulation study. Journal of Applied Biomechanics. 2010;26(4):493–500. doi: 10.1123/jab.26.4.493. [DOI] [PubMed] [Google Scholar]
- Rankin JW, Neptune RR. Musculotendon lengths and moment arms for a threedimensional upper-extremity model. Journal of Biomechanics. 2012;45(9):1739–1744. doi: 10.1016/j.jbiomech.2012.03.010. [DOI] [PMC free article] [PubMed] [Google Scholar]
- Rankin JW, Richter WM, et al. Individual muscle contributions to push and recovery subtasks during wheelchair propulsion. Journal of Biomechanics. 2011;44(7):1246–1252. doi: 10.1016/j.jbiomech.2011.02.073. [DOI] [PMC free article] [PubMed] [Google Scholar]
- Richter WM, Axelson PW. Low-impact wheelchair propulsion: achievable and acceptable. Journal of rehabilitation research and development. 2005;42(3) Suppl 1:21–33. doi: 10.1682/jrrd.2004.06.0074. [DOI] [PubMed] [Google Scholar]
- Robertson RN, Boninger ML, et al. Pushrim forces and joint kinetics during wheelchair propulsion. Archives of Physical Medicine & Rehabilitation. 1996;77(9):856–864. doi: 10.1016/s0003-9993(96)90270-1. [DOI] [PubMed] [Google Scholar]
- Rodgers MM, Gayle GW, et al. Biomechanics of wheelchair propulsion during fatigue. Archives of Physical Medicine & Rehabilitation. 1994;75(1):85–93. [PubMed] [Google Scholar]
- Rozendaal LA, Veeger HEJ. The pushrim force pattern in manual wheelchair propulsion as a balance between cost and effect. Journal of Biomechanics. 2003;36:239–247. doi: 10.1016/s0021-9290(02)00320-2. [DOI] [PubMed] [Google Scholar]
- Slowik JS, Neptune RR. A theoretical analysis of the influence of wheelchair seat position on upper extremity demand. Clinical Biomechanics. 2013;28(4):378–385. doi: 10.1016/j.clinbiomech.2013.03.004. [DOI] [PubMed] [Google Scholar]
- van Drongelen S, van der Woude LH, et al. Glenohumeral contact forces and muscle forces evaluated in wheelchair-related activities of daily living in able-bodied subjects versus subjects with paraplegia and tetraplegia. Archives of Physical Medicine & Rehabilitation. 2005;86(7):1434–1440. doi: 10.1016/j.apmr.2005.03.014. [DOI] [PubMed] [Google Scholar]
- van Drongelen S, van der Woude LH, et al. Glenohumeral joint loading in tetraplegia during weight relief lifting: a simulation study. Clin Biomech (Bristol, Avon) 2006;21(2):128–137. doi: 10.1016/j.clinbiomech.2005.09.003. [DOI] [PubMed] [Google Scholar]
- Veeger HE, Rozendaal LA, et al. Load on the shoulder in low intensity wheelchair propulsion. Clinical Biomechanics. 2002;17(3):211–218. doi: 10.1016/s0268-0033(02)00008-6. [DOI] [PubMed] [Google Scholar]
- Veeger HE, Rozendaal LA, et al. Load on the shoulder in low intensity wheelchair propulsion. Clinical Biomechanics (Bristol, Avon) 2002;17(3):211–218. doi: 10.1016/s0268-0033(02)00008-6. [DOI] [PubMed] [Google Scholar]
- Zajac FE. Muscle and tendon: properties, models, scaling, and application to biomechanics and motor control. Critical Reviews in Biomedical Engineering. 1989;(4):359–411. [PubMed] [Google Scholar]


