

Abstract
Contour integration is a fundamental visual process that recovers object structure by representing spatially separated edge elements as a continuous contour or shape boundary. Clinically stable persons with schizophrenia have repeatedly been shown to be impaired at contour integration but it is unclear whether this process varies with clinical state or whether it arises as early as the first episode of psychosis. To consider these issues, we administered a contour integration test to persons with chronic schizophrenia and to those with a first episode of psychosis. The test was administered twice—once at admission to short term psychiatric hospitalization and once again at discharge. A well-matched healthy control group was also tested across the same time points. We found that contour integration performance improved to the same degree in all groups over time, indicating that there were no recovery effects over and above normal practice effects. Moreover, the schizophrenia group demonstrated poorer contour integration than the control group and the first episode group exhibited intermediate performance that could not be distinguished from the other groups. These results suggest that contour integration ability does not vary as a function of short-term changes in clinical state, and that it may become further impaired with an increased number of psychotic episodes.
Keywords: Schizophrenia, perception, vision, cognition, biomarker, contour integration
1. Introduction
Evidence is increasing for the presence of visual perceptual impairments in schizophrenia, along with their etiologic (Schiffman et al., 2004; Schubert et al., 2005) and functional (Green et al., 2012; Rassovsky et al., 2011) significance. One well-documented impairment is in perceptual organization, which refers to processes by which individual elements of sensory information are collectively structured into larger units of perceived objects and their interrelations (Palmer, 1999). Over 50 studies have now demonstrated reduced perceptual organization in schizophrenia across various paradigms, labs, and countries (for review, see Silverstein and Keane, 2011). One of the most widely used measures of perceptual organization in the schizophrenia and basic vision literatures is contour integration (CI) (Chandna et al., 2001; Field et al., 1993; Kovacs, 2000; Levi et al., 2007). CI is typically measured as the ability to detect or make a judgment about a closed contour made up of non-contiguous elements, embedded within a display of randomly oriented elements. Previous studies have shown that people with schizophrenia are less able to detect and make shape judgments about integrated contours when compared to various healthy and psychiatric control groups (Silverstein and Keane, 2011; Uhlhaas and Silverstein, 2005). Poor performance on CI tasks, as with other forms of perceptual organization impairment in schizophrenia (Silverstein and Keane, 2011a), has also been associated with poorer premorbid social functioning (Joseph et al., 2013; Schenkel et al., 2005), elevated disorganized symptoms (Silverstein et al., 2000; Uhlhaas et al., 2006a; Uhlhaas et al., 2006b; Uhlhaas et al., 2005), and a more chronic course of illness (Silverstein et al., 2006a) - a triad of characteristics which have been demonstrated to significantly covary and which may represent a particularly severe form of the condition (Farmer et al., 1983; Sham et al., 1996; Wickham et al., 2001).
An unanswered question in the perceptual organization and CI literatures in schizophrenia is the extent to which these impairments are state - or trait - related. Only a single study has demonstrated state sensitivity of CI in schizophrenia. In Uhlhaas (2005), schizophrenia patients scoring higher than 3 on the PANSS P2 conceptual disorganization item, but not other groups of schizophrenia, psychotic, or non-psychotic patients, demonstrated improvement in CI during the course of short-term inpatient treatment, and CI improvement covaried significantly with reductions in conceptual disorganization, but not positive, negative, cognitive, excitement, or depression symptom dimensions. An issue with the Uhlhaas et al. (2006) study, however, is that the card-based CI task had a small number of stimulus trials (15), which undoubtedly limited sensitivity to impairments or to change over time. On the other hand, that task only included one practice trial and so the poor initial performance of disorganized patients may have reflected a reduced or delayed comprehension of the nature of the task. The purpose of the present study was, therefore, to examine state-sensitivity of CI in schizophrenia using a recently improved, computer-based CI task with previously demonstrated validity and good test-retest reliability, and with a large number of trials and an adequate practice session (Silverstein et al., 2012).
A second unanswered question concerns the degree of contour integration impairment at the first episode of psychosis. Therefore, we examined the extent to which CI impairments are observed at first episode, and the extent to which they are ameliorated over the course of initial hospitalization. Only 2 prior studies investigated visual perceptual organization at first episode. One did not include a measure of CI, and found no impairment on other perceptual organization indices (Silverstein et al., 2006b). The other found that on a measure of CI, first episode patients performed at a level intermediate between controls and chronic schizophrenia patients; however, they did not use a longitudinal approach, and their CI measure differed in significant ways from the standard paradigm that we report on here (Parnas, 2001). Therefore, in this study, we included a group of first episode psychosis patients, a group of people with schizophrenia with more than one psychotic episode, and healthy controls well-matched to the schizophrenia group.
2. Methods
2.1 Subjects
Demographic information for subjects is provided in Table 1. Three groups of subjects were recruited: 1) subjects hospitalized for a first episode of psychosis (FEP) (n = 18, 9 males), whose final diagnosis, in most cases, is still currently unknown (see Supplemental Methods), based on the length of time required for a diagnosis of schizophrenia spectrum disorder; 2) patients at a second or later episode of schizophrenia (SCZ) (n = 24, 17 males) and recruited from the same short-term inpatient unit as the FEP group; and 3) healthy controls (CON) (n = 36, 18 males) who were screened for presence of a psychotic or mood disorder.
Table 1.
Demographic variables.
| Variable | SCZ | FEP | CON | ||||
|---|---|---|---|---|---|---|---|
| Demographics | Mean | SD | Mean | SD | Mean | SD | p value |
| Age (years) | 39.92 | 11.24 | 26.5 | 8.84 | 42.78 | 12.08 | < .001 |
| Gender (% male) | 70.8 | 50 | 50 | .22 | |||
| Ethnicity (% Caucasian) | 50 | 38.9 | 36.1 | .17 | |||
| Personal Education (years) | 13.04 | 1.73 | 13.61 | 2.87 | 14.11 | 2.3 | .59 |
| Mother Education | 13.14 | 4.02 | 13.28 | 4.6 | 12.53 | 4.51 | .80 |
| Father Education | 13.84 | 3.45 | 14.24 | 3.98 | 12.36 | 4.35 | .23 |
| Estimated IQ (Shipley-2) | 88.68 | 18.05 | 94.82 | 21.84 | 93.76 | 13.37 | .45 |
Inclusion criteria for all subjects included age between 18-60, and, for patients, a diagnosis of either schizophrenia or a first episode of a psychiatric disorder with psychotic symptoms, as confirmed by the Structured Clinical Interview for DSM-IV Diagnosis, patient version (First et al., 2002b). Exclusion criteria for patients included any history of traumatic brain injury or head injury with loss of consciousness exceeding 10 minutes, current mood disorder if a diagnosis of schizophrenia was established, substance abuse disorder within the previous 6 months or positive urine toxicology screen on the day of any testing session, or electroconvulsive therapy in the prior 8 weeks. Subjects were also excluded if they had a history of a neurological disorder, developmental disorder, or evidence of intellectual disability. This latter condition was confirmed by the electronic medical record if subjects demonstrated any evidence of intellectual impairment via their behavior, staff report, or score on the Shipley-2 (Shipley, 2009). Exclusion criteria for control subjects are those items just listed for patients, in addition to: current mood disorder or psychotropic medication use in the prior 6 months, and presence of any lifetime Axis-I disorder as indicated by the SCID [non-patient version (First et al., 2002a)], excepting past substance use disorders. Subjects were also excluded if they self reported having a first degree relative with a diagnosis of bipolar disorder, schizoaffective disorder, or schizophrenia. A Snellen chart was used to assess subjects for visual acuity; all subjects had normal or corrected-to-normal visual acuity.
All patients were on antipsychotic medication, but the precise medications for two patients could not be confirmed. Subjects were excluded from data analysis if the CI catch trial (see below) accuracy fell below 62.5% accuracy at either of the two times on the CI task. All other exclusion and inclusion criteria are listen in the Supplemental Methods.
Initial subject recruitment was 27 for FEP, 35 for SCZ, and 43 for CON; the number of subjects who either declined to participate for the second session or were released from the inpatient unit before the study team could assess them was 7 (26%) of the FEP, 9 (26%) of the SCZ, and 7 (16%) of the CON groups. The drop-out rates did not differ significantly between groups [x2 (2) = 1.348, p = .51]. Two FEP and SCZ subjects were excluded from analyses for performing below the catch trial accuracy cutoff. Subject testing sessions were conducted as close to admission and discharge dates as possible.
2.2 Contour integration task
The CI task was implemented in the same way as in previous studies (Feigenson et al., 2014; Kozma-Weibe, 2006; Silverstein et al., 2009; Silverstein et al., 2012). Stimuli comprised a non-continuous path of individual Gabor elements forming an egg shaped closed contour which itself was embedded within an array of noise Gabor elements (see Fig. 1). Difficulty was manipulated by varying the degree of orientational jitter added to the individual elements composing the contour. On each trial, subjects were asked to indicate whether the shape pointed to the left or right. Each stimulus included a gray background containing 207 distracter Gabor elements and 15 target elements. Task specifications are listed in Supplemental Methods.
Fig 1.
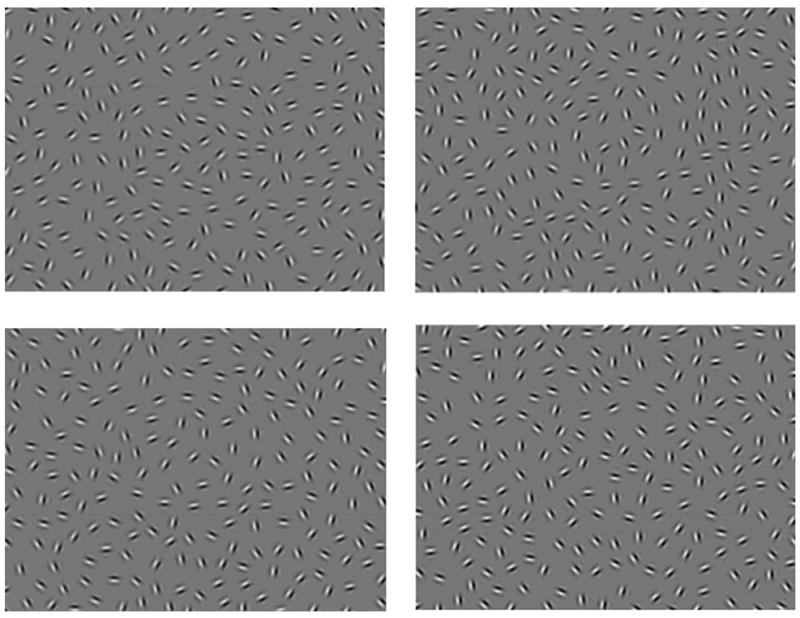
Sample stimulus displays images from the contour integration task in increasing order of task difficulty. Top left: 0° jitter. Top right: 7-8° jitter. Bottom left: 11-12° jitter. Bottom right: 15-16° jitter. Reproduced from: Silverstein and Keane (2011a) by permission of Oxford University Press.
On each trial, the stimulus was presented for 2 seconds, during which time subjects could enter a response. This was immediately followed by a 1 second interstimulus interval during which no responses were recorded. Blocks consisted of 12 trials at only one of the orientation jitter levels: +/-0º, 7º, 9º, 11º, 13º, and 15º (See Fig. 1) plus an additional two randomly interspersed catch trials to determine how well subjects were attending to the task (i.e., these stimuli should always be responded to correctly if a person is attending to them). There were two types of catch trials: 1) unjittered contours with luminance-defined lines drawn through the Gabor elements to eliminate the need for integrating adjacent contour elements; and 2) contours presented without background Gabor elements, to eliminate the need to extract the contour from noise. Blocks were presented in increasing order of difficulty (starting with +/-0º and ending at 15º), and each 6 block sequence was repeated 4 times for a total of 288 experimental and 48 catch trials.
2.3 Clinical assessment measures
The Structured Clinical Interview for DSM-IV Diagnosis (SCID), patient version (First et al., 2002b) was used to interview all patients, whereas non-patients were assessed for psychopathology using the non-patient version of the SCID (First et al., 2002a). Information for patients was also obtained from medical records and through confirmation with clinical staff. At each session, symptoms during the past two weeks were determined via the Positive and Negative Syndrome Scale (PANSS) (Kay et al., 1987) and scored using a 5-factor model (Lindenmayer et al., 1994a, b) including positive, negative, cognitive, excitement, and depression dimensions. Because past studies have linked impaired perceptual organization, including CI, to the presence of disorganization in other domains (e.g., cognitive, motor), we also used the supplemental PANSS item ‘inappropriate affect’ to derive a disorganization factor comprising that item in addition to P2 (conceptual disorganization) and G11 (impaired attention), following a previously established method (Cuesta and Peralta, 1995). In addition, we examined the association between conceptual disorganization (item P2) and CI performance, consistent with a previous investigation of CI that found poorer CI among more conceptually disorganized patients (Uhlhaas et al., 2005).
3. Results
3.1 Contour integration performance
The 3 groups were well-matched on demographic variables (Table 1 and Supplemental Results). To ensure that all groups understood the directions and were similarly attentive during the task, we examined catch trial performance using a 3 (group) × 2 (catch trial type) ANOVA at time 1. We observed a borderline significant result [F(2, 75) = 2.937, p = .059, ]. The SCZ group performed the poorest, but each subject group was largely on task (all means were above .95, see Table 2).
Table 2. Proportion correct on catch trials.
| Catch Trial 1 | Catch Trial 2 | |||
|---|---|---|---|---|
|
| ||||
| Group | M | SD | M | SD |
| SCZ | 0.967 | 0.053 | 0.953 | 0.052 |
| FEP | 0.983 | 0.029 | 0.962 | 0.073 |
| CON | 0.984 | 0.043 | 0.988 | 0.028 |
| AVERAGE | 0.978 | 0.044 | 0.971 | 0.051 |
Results are shown only for Time 1
For the non-catch trials, we first examined performance across both times using a 3 (group) × 2 (time) repeated measures ANOVA and found a significant main effect of group [F(2, 75) = 3.23, p < .05, ], and a significant main effect of time [F(1, 75) = 15.683, p < .001, ηp2 = 0.173], with performance generally improving over time. There was not a significant time × group interaction [F(2, 75) = 1.90, p = .31, ). The consistent degree of improvement in all groups across Times 1-2 suggests that performance changes in the patient groups were due to practice effects, as observed in controls, which is consistent with past studies using an older version of the task (Schwarzkopf and Kourtzi, 2008; Silverstein et al., 2006a). When change was expressed as a difference score between performance at the 2 time points, a lack of difference between recovering patients and healthy controls was again demonstrated [F(2,75) = 1.19, p = .309, ]. Planned t-tests indicated that performance on the CI task was significantly higher in the CON than SCZ group at both Time 1 [t(73) = -2.97, p < .01] and 2 [t(60) = -3.01, p < .01]. T-tests at both Times 1 and 2 between the FEP group and the other groups were not significant (ps > .17), with the exception of a trend towards significance between the FEP and CON groups at Time 1 [t(73) = -1.703, p = .09].
To see if length of time between sessions affected improvement, we used a one-way ANOVA to compare separation time of sessions between groups. There were no significant differences, although there was a trend [F(2, 75) = 2.59, p = .082] towards the SCZ group (M = 13.92, SD = 6.43) having fewer days between testing sessions than the CON (M = 17.06, SD = 5.76) and FEP (M = 18.67, SD = 9.88) groups. Pearson correlations between time between sessions and proportion correct on the task at Time 2, however, revealed no significant overall correlation (r = .09, p = .43), nor any significant correlations when groups were examined individually (rs < .25, ps > .32), indicating that length of time between visits did not impact CI task performance. Of note, response times did not differ significantly between groups, and there were no group differences in speed-accuracy trade-off that could account for the accuracy data reported above (See Supplemental Results).
3.2 Associations between symptoms and JOVI performance
At Time 1, there was no significant correlation between the P2 score and the CI task score when patients were collapsed across groups (rs = .192, n =53, p = .168). When analyzed separately, however, there was a positive significant correlation, (rs = .5, n = 22, p < .05) in the FEP group. There was no significant correlation in the SCZ group (rs = .072, n = 31, p = .702). At time 2, there were no significant or trend level relationships when subjects were examined within or collapsed across groups (rss < .37, ps >.13). Nor were there any significant correlations between the change of CI task score and change in P2 rating between Times 1-2 analyzed collectively or across groups (rss < 0.03, ps > 0.88). We also performed a t-test to determine if there was a difference on the P2 item rating between subjects who remained for time 2 and those who were lost to the study, but none was observed [t(51) = 0.354, p = .73). Correlations with other symptom factors are described in the Supplemental Results section.
4.Discussion
The major finding from this study is that - in both FEP and SCZ patients - CI performance did not improve over time, relative to CON subjects. This suggests that CI impairment may be a stable trait, at least over the short term, in schizophrenia. However, while this CI task effectively discriminated between healthy controls and individuals hospitalized multiple times with diagnoses of schizophrenia (as have past versions of the CI task), the FEP group was not significantly different from either of the other groups at either time, although there was a trend towards a significant difference between the FEP and CON groups at Time 1, suggesting some level of impairment even at the first episode. These results could reflect that: (1) the FEP group is comprised of some people who will not develop schizophrenia (i.e. they have an affective psychosis); (2) the current experimental design prevented detection of small group differences (e.g., not enough subjects, trials, or response alternatives); or (3) CI impairment is relatively mild at first episode, and is an aspect of illness progression over time. If view #3 is correct, it implies that while CI impairment is not related to clinical state (i.e., acute vs. stabilization vs. stable phases) it does vary with progressive CNS changes that occur over the long-term in many patients with schizophrenia. Support for this hypothesis comes from data on other forms of perceptual organization, indicating more intact functioning in first episode compared to later episode schizophrenia patients (Silverstein et al., 1996; Silverstein et al., 2006b). An intriguing possibility is that progressive CI performance decline could be related to loss of occipital lobe gray and white matter – given the role of occipital regions in CI impairment in poor outcome patients (Butler et al., 2013; Silverstein et al., 2009), and findings of posteriorization of gray and white matter loss in this “Kraepelinian” subgroup of patients.(Mitelman and Buchsbaum, 2007).
We did not observe a significant negative correlation between CI task performance and PANSS disorganization scores. This is in contrast to findings from previous studies. Note, however, that none of these unexpected correlations survived a correction for multiple comparisons, and that across both patient groups, there were only two individuals (both in the FEP group) who scored at a ‘moderate to severe’ level (above 3) on the PANSS conceptual disorganization item (P2) at either time. Therefore, we may not have had a sufficiently disorganized group of patients to adequately address this issue, and the observed correlations may be spurious. In contrast, Uhlhaas et al. (2005) included a group of 14 individuals with schizophrenia who scored at or above a ‘moderate to severe’ level of conceptual disorganization, and compared them to a non-disorganized group of 33 schizophrenia patients.
To address whether generalized deficits, such as inattention and poor motivation, affected performance in our study, we included 2 different types of catch trials that should be so easy as to be nearly always answered correctly by anyone who is adequately engaged in the task. We then only included subjects who passed an adequate proportion (.625) of these catch trials to eliminate subjects who were guessing or frequently not responding. Despite this, the SCZ group performed worse than the other groups on the catch trials. However, when we increased the cutoff criterion on the catch trials (.9), the group difference disappeared on the catch trials but remained for the non-catch trials (See Supplementary Results). That we observed the same effects on the main task at both cutoff points indicates that generalized deficits were unlikely to account for the group differences.
We observed substantial attrition between the two times, so it is possible that the subjects who were lost to the study represent a different population from those who remained. It is also possible that the subjects lost at Time 2 would have changed our results by exhibiting different symptoms or performance from the other patients at discharge. Although we cannot rule out this possibility, it is worth noting that the lost and retained subjects did not differ in CI task performance at Time 1, suggesting that attrition did not bias our results (See Supplemental Results). Furthermore, the proportion of subjects who were lost was not different between groups.
In summary, this CI task has demonstrated sensitivity to schizophrenia, but scores were not affected by short-term inpatient treatment, in contrast to scores on some other specific tests of visual function (Silverstein et al., 2013). In addition, as a group, people with a first episode psychosis perform midway between psychiatrically healthy controls and people with schizophrenia. Follow-up analyses will determine if CI ability during either hospital admission or discharge is associated with a later, final diagnosis of schizophrenia, or aspects of early course of illness in the FEP group.
Supplementary Material
Fig 2.
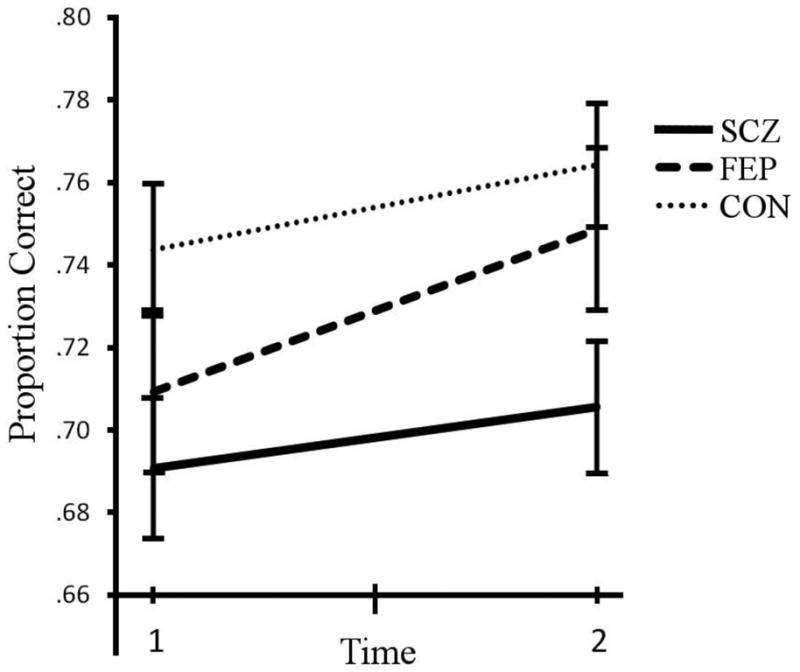
Contour Integration task accuracy at admission and discharge for the first episode group (FEP), schizophrenia group (SCZ), and healthy control group (CON). Performance corresponds to the proportion correct (where timed-out trials count as 0.5 correct). Error bars are standard error of the mean. There is a significant difference between the CON and SCZ groups across and at both times. Times 1 and 2 for patients corresponded roughly to admission and discharge to the inpatient unit, respectively. This chart does not depict subjects who dropped out of the study between Times 1-2.
Table 3. CI performance: Proportion correct, adjusted for time-outs.
| Main Task | Time 1 | Time 2 | ||
|---|---|---|---|---|
| Group | Mean | SD | Mean | SD |
| SCZ (n = 24) | 0.691 | 0.082 | 0.706 | 0.080 |
| FEP (n = 18) | 0.709 | 0.092 | 0.749 | 0.107 |
| CON (n = 36) | 0.744 | 0.082 | 0.764 | 0.089 |
Results indicate means and standard deviation of performance on the CI task only from subjects who performed above 0.625 correct on the catch trials at both Times 1-2.
Table 4. PANSS scores, Time 1 and Time 2.
| PANSS | FEP (n = 17) | SCZ (n = 24) | Combined (n = 41) | ||||||
|---|---|---|---|---|---|---|---|---|---|
| M | SD | T | M | SD | t | M | SD | t | |
| Positive | |||||||||
| Time 1 | 11.35 | 4.08 | 12.04 | 3.93 | 11.76 | 4.0 | |||
| Time 2 | 8.06 | 3.44 | 9.25 | 4.39 | 8.76 | 4.01 | |||
| Difference | 3.29 | 3.8 | 3.57** | 2.79 | 2.65 | 5.15*** | 3.0 | 3.15 | 6.11*** |
| Negative | |||||||||
| Time 1 | 14.94 | 6.11 | 16.88 | 4.15 | 16.07 | 5.08 | |||
| Time 2 | 12.94 | 4.68 | 15.38 | 4.96 | 14.37 | 4.94 | |||
| Difference | 2.0 | 3.59 | 2.3* | 1.5 | 3.9 | 1.88 | 1.7 | 3.74 | 2.93** |
| Cognitive | |||||||||
| Time 1 | 10.18 | 3.75 | 11.38 | 3.16 | 10.88 | 3.42 | |||
| Time 2 | 8.65 | 2.26 | 10.13 | 4.22 | 9.51 | 3.58 | |||
| Difference | 1.53 | 2.21 | 2.85* | 1.25 | 3.43 | 1.79 | 1.7 | 2.96 | 2.96** |
| Excitement | |||||||||
| Time 1 | 10 | 2.53 | 9.5 | 3.12 | 9.71 | 2.87 | |||
| Time 2 | 7.82 | 2.53 | 8.04 | 3.51 | 7.95 | 3.11 | |||
| Difference | 2.18 | 2.38 | 3.77** | 1.46 | 3.16 | 2.26* | 1.76 | 2.85 | 3.94*** |
| Disorganized | |||||||||
| Time 1 | 4.65 | 2.23 | 5.42 | 2.08 | 5.1 | 2.15 | |||
| Time 2 | 3.65 | 1.32 | 4.67 | 2.75 | 4.24 | 2.3 | |||
| Difference | 1.0 | 1.5 | 2.75* | 0.75 | 2.0 | 1.83 | 0.85 | 1.8 | 3.04** |
| Depression | |||||||||
| Time 1 | 13.76 | 4.24 | 14.5 | 4.28 | 14.2 | 4.23 | |||
| Time 2 | 11.29 | 5.18 | 12.04 | 5.19 | 11.73 | 5.13 | |||
| Difference | 2.47 | 3.61 | 2.82* | 2.45 | 3.35 | 3.6** | 2.46 | 3.41 | 4.62*** |
| P2 | |||||||||
| Time 1 | 1.53 | .943 | 1.87 | 1.14 | 1.73 | 1.06 | |||
| Time 2 | 1.06 | .243 | 1.83 | 1.40 | 1.5 | 1.13 | |||
| Difference | 0.47 | .874 | 2.22* | 0.04 | 1.02 | 0.20S | 0.23 | .974 | 1.46 |
PANSS scores are for subjects who attended both Times 1-2. Two-tailed uncorrected student's t-tests were used. P2 = conceptual disorganization item.
=p <.05
=p < .01
=p < .001
Acknowledgments
The authors would like to thank the patient and control participation. A special thanks goes to the research assistants who ran the sessions and collected the data: Yushi Wang, Deepthi Mikkilineni, and Daniel Paterno.
Role of Funding Source: This research was funded by NIMH grant R01MH093439 to SMS, National Research Service Award F32MH094102 to BPK, and NIH Grant 5K12GM093854 to KAF and MWR
Footnotes
Contributors: SMS designed the study. KAF did primary analysis of the data and drafted the manuscript. BPK also contributed to data analysis. All authors contributed to the interpretation of the results, edited the manuscript, and gave approval of the final version of the manuscript.
Conflicts of interest: All authors declare that they have no conflicts of interest.
Publisher's Disclaimer: This is a PDF file of an unedited manuscript that has been accepted for publication. As a service to our customers we are providing this early version of the manuscript. The manuscript will undergo copyediting, typesetting, and review of the resulting proof before it is published in its final citable form. Please note that during the production process errors may be discovered which could affect the content, and all legal disclaimers that apply to the journal pertain.
Contributor Information
Brian P. Keane, Email: brian.keane@gmail.com.
Matthew W. Roché, Email: rochemw@rwjms.rutgers.edu.
Steven M. Silverstein, Email: silvers1@ubhc.rutgers.edu.
References
- Butler PD, Abeles IY, Silverstein SM, Dias EC, Weiskopf NG, Calderone DJ, Sehatpour P. An event-related potential examination of contour integration deficits in schizophrenia. Frontiers in Psychology. 2013;4:132. doi: 10.3389/fpsyg.2013.00132. [DOI] [PMC free article] [PubMed] [Google Scholar]
- Chandna A, Pennefather PM, Kovacs I, Norcia AM. Contour integration deficits in anisometropic amblyopia. Invest Ophthalmol Vis Sci. 2001;42(3):875–878. [PubMed] [Google Scholar]
- Cuesta MJ, Peralta V. Psychopathological dimensions in schizophrenia. Schizophr Bull. 1995;21(3):473–482. doi: 10.1093/schbul/21.3.473. [DOI] [PubMed] [Google Scholar]
- Farmer AE, McGuffin P, Spitznagel EL. Heterogeneity in schizophrenia: a clusteranalytic approach. Psychiatry Res. 1983;8(1):1–12. doi: 10.1016/0165-1781(83)90132-4. [DOI] [PubMed] [Google Scholar]
- Feigenson KA, Gara MA, Roche MW, Silverstein SM. Is disorganization a feature of schizophrenia or a modifying influence: evidence of covariation of perceptual and cognitive organization in a non-patient sample. Psychiatry Res. 2014;217(1-2):1–8. doi: 10.1016/j.psychres.2014.03.005. [DOI] [PMC free article] [PubMed] [Google Scholar]
- Field DJ, Hayes A, Hess RF. Contour integration by the human visual system: evidence for a local “association field”. Vision Res. 1993;33(2):173–193. doi: 10.1016/0042-6989(93)90156-q. [DOI] [PubMed] [Google Scholar]
- First M, Spitzer R, Gibbon M, Williams JBW. Structured Clinical Interview for DSM-IV-TR Axis I Disorders, Research Version, Non-Patient Edition (SCID-I/NP) New York State Psychiatric Institute; New York, NY: 2002a. [Google Scholar]
- First M, Spitzer R, Gibbon M, Williams JBW. Structured Clinical Interview for DSM-IV-TR Axis I Disorders, Research Version, Patient Edition SCID-I/P. New York State Psychiatric Institute; New York, NY: 2002b. [Google Scholar]
- Green MF, Hellemann G, Horan WP, Lee J, Wynn JK. From perception to functional outcome in schizophrenia: modeling the role of ability and motivation. Arch Gen Psychiatry. 2012;69(12):1216–1224. doi: 10.1001/archgenpsychiatry.2012.652. [DOI] [PMC free article] [PubMed] [Google Scholar]
- Joseph J, Bae G, Silverstein SM. Sex, symptom, and premorbid social functioning associated with perceptual organization dysfunction in schizophrenia. Front Psychol. 2013;4:547. doi: 10.3389/fpsyg.2013.00547. [DOI] [PMC free article] [PubMed] [Google Scholar]
- Kay SR, Fiszbein A, Opler LA. The positive and negative syndrome scale (PANSS) for schizophrenia. Schizophr Bull. 1987;13(2):261–276. doi: 10.1093/schbul/13.2.261. [DOI] [PubMed] [Google Scholar]
- Kovacs I. Human development of perceptual organization. Vision Res. 2000;40(10-12):1301–1310. doi: 10.1016/s0042-6989(00)00055-9. [DOI] [PubMed] [Google Scholar]
- Kozma-Weibe P, Silverstein SM, Feher A, Kovacs I, Uhlhaas P, Wilkniss S. Development of a World-Wide-Web based contour integration test: Reliability and validity. Computers in Human Behavior. 2006;22:971–980. [Google Scholar]
- Levi DM, Yu C, Kuai SG, Rislove E. Global contour processing in amblyopia. Vision Res. 2007;47(4):512–524. doi: 10.1016/j.visres.2006.10.014. [DOI] [PMC free article] [PubMed] [Google Scholar]
- Lindenmayer JP, Bernstein-Hyman R, Grochowski S. Five-factor model of schizophrenia. Initial validation. J Nerv Ment Dis. 1994a;182(11):631–638. doi: 10.1097/00005053-199411000-00006. [DOI] [PubMed] [Google Scholar]
- Lindenmayer JP, Bernstein-Hyman R, Grochowski S. A new five factor model of schizophrenia. Psychiatric Quarterly. 1994b;65(4):299–322. doi: 10.1007/BF02354306. [DOI] [PubMed] [Google Scholar]
- Mitelman SA, Buchsbaum MS. Very poor outcome schizophrenia: clinical and neuroimaging aspects. Int Rev Psychiatry. 2007;19(4):345–357. doi: 10.1080/09540260701486563. [DOI] [PMC free article] [PubMed] [Google Scholar]
- Palmer SE. Vision science: photons to phenomenology. MIT Press; Cambridge, MA: 1999. [Google Scholar]
- Parnas J, Vianin P, Saebye D, Jansson L, Volmer-Larsen A, Bovet P. Visual binding abilities in the initial and advanced stages of schizophrenia. Acta Psychiatr Scand. 2001;103(3):171–180. doi: 10.1034/j.1600-0447.2001.00160.x. [DOI] [PubMed] [Google Scholar]
- Rassovsky Y, Horan WP, Lee J, Sergi MJ, Green MF. Pathways between early visual processing and functional outcome in schizophrenia. Psychol Med. 2011;41(3):487–497. doi: 10.1017/S0033291710001054. [DOI] [PMC free article] [PubMed] [Google Scholar]
- Schenkel LS, Spaulding WD, DiLillo D, Silverstein SM. Histories of childhood maltreatment in schizophrenia: relationships with premorbid functioning, symptomatology, and cognitive deficits. Schizophr Res. 2005;76(2-3):273–286. doi: 10.1016/j.schres.2005.03.003. [DOI] [PubMed] [Google Scholar]
- Schiffman J, Walker E, Ekstrom M, Schulsinger F, Sorensen H, Mednick S. Childhood videotaped social and neuromotor precursors of schizophrenia: a prospective investigation. A J Psychiatry. 2004;161(11):2021–2027. doi: 10.1176/appi.ajp.161.11.2021. [DOI] [PubMed] [Google Scholar]
- Schubert EW, Henriksson KM, McNeil TF. A prospective study of offspring of women with psychosis: visual dysfunction in early childhood predicts schizophrenia-spectrum disorders in adulthood. Acta Psychiatr Scand. 2005;112(5):385–393. doi: 10.1111/j.1600-0447.2005.00584.x. [DOI] [PubMed] [Google Scholar]
- Schwarzkopf DS, Kourtzi Z. Experience shapes the utility of natural statistics for perceptual contour integration. Curr Biol. 2008;18(15):1162–1167. doi: 10.1016/j.cub.2008.06.072. [DOI] [PubMed] [Google Scholar]
- Sham PC, Castle DJ, Wessely S, Farmer AE, Murray RM. Further exploration of a latent class typology of schizophrenia. Schizophr Res. 1996;20(1-2):105–115. doi: 10.1016/0920-9964(95)00091-7. [DOI] [PubMed] [Google Scholar]
- Shipley W, Gruber C, Martin T, Klein M. Shipley Institute of Living Scale-2. Western Psychological Services; Los Angeles: 2009. [Google Scholar]
- Silverstein SM, Berten S, Essex B, Kovacs I, Susmaras T, Little DM. An fMRI examination of visual integration in schizophrenia. Journal of Integrative Neuroscience. 2009;8(2):175–202. doi: 10.1142/s0219635209002113. [DOI] [PubMed] [Google Scholar]
- Silverstein SM, Hatashita-Wong M, Schenkel LS, Wilkniss S, Kovacs I, Feher A, Smith T, Goicochea C, Uhlhaas P, Carpiniello K, Savitz A. Reduced top-down influences in contour detection in schizophrenia. Cognitive Neuropsychiatry. 2006a;11(2):112–132. doi: 10.1080/13546800444000209. [DOI] [PubMed] [Google Scholar]
- Silverstein SM, Keane BP. Perceptual organization impairment in schizophrenia and associated brain mechanisms: review of research from 2005 to 2010. Schizophr Bull. 2011;37(4):690–699. doi: 10.1093/schbul/sbr052. [DOI] [PMC free article] [PubMed] [Google Scholar]
- Silverstein SM, Keane BP, Barch DM, Carter CS, Gold JM, Kovacs I, MacDonald A, 3rd, Ragland JD, Strauss ME. Optimization and validation of a visual integration test for schizophrenia research. Schizophr Bull. 2012;38(1):125–134. doi: 10.1093/schbul/sbr141. [DOI] [PMC free article] [PubMed] [Google Scholar]
- Silverstein SM, Keane BP, Wang Y, Mikkilineni D, Paterno D, Papathomas TV, Feigenson K. Effects of short-term inpatient treatment on sensitivity to a size contrast illusion in first-episode psychosis and multiple-episode schizophrenia. Frontiers in Psychology. 2013;4:1–11. doi: 10.3389/fpsyg.2013.00466. [DOI] [PMC free article] [PubMed] [Google Scholar]
- Silverstein SM, Knight RA, Schwarzkopf SB, West LL, Osborn LM, Kamin D. Stimulus configuration and context effects in perceptual organization in schizophrenia. J Abnorm Psychol. 1996;105(3):410–420. doi: 10.1037//0021-843x.105.3.410. [DOI] [PubMed] [Google Scholar]
- Silverstein SM, Kovacs I, Corry R, Valone C. Perceptual organization, the disorganization syndrome, and context processing in chronic schizophrenia. Schizophr Res. 2000;43(1):11–20. doi: 10.1016/s0920-9964(99)00180-2. [DOI] [PubMed] [Google Scholar]
- Silverstein SM, Uhlhaas PJ, Essex B, Halpin S, Schall U, Carr V. Perceptual organization in first episode schizophrenia and ultra-high-risk states. Schizophr Res. 2006b;83(1):41–52. doi: 10.1016/j.schres.2006.01.003. [DOI] [PubMed] [Google Scholar]
- Uhlhaas PJ, Phillips WA, Mitchell G, Silverstein SM. Perceptual grouping in disorganized schizophrenia. Psychiatry Res. 2006a;145(2-3):105–117. doi: 10.1016/j.psychres.2005.10.016. [DOI] [PubMed] [Google Scholar]
- Uhlhaas PJ, Phillips WA, Schenkel LS, Silverstein SM. Theory of mind and perceptual context-processing in schizophrenia. Cogn Neuropsychiatry. 2006b;11(4):416–436. doi: 10.1080/13546800444000272. [DOI] [PubMed] [Google Scholar]
- Uhlhaas PJ, Phillips WA, Silverstein SM. The course and clinical correlates of dysfunctions in visual perceptual organization in schizophrenia during the remission of psychotic symptoms. Schizophr Res. 2005;75(2-3):183–192. doi: 10.1016/j.schres.2004.11.005. [DOI] [PubMed] [Google Scholar]
- Uhlhaas PJ, Silverstein SM. Perceptual organization in schizophrenia spectrum disorders: empirical research and theoretical implications. Psychol Bull. 2005;131(4):618–632. doi: 10.1037/0033-2909.131.4.618. [DOI] [PubMed] [Google Scholar]
- Wickham H, Walsh C, Asherson P, Taylor C, Sigmundson T, Gill M, Owen MJ, McGuffin P, Murray R, Sham P. Familiality of symptom dimensions in schizophrenia. Schizophr Res. 2001;47(2-3):223–232. doi: 10.1016/s0920-9964(00)00098-0. [DOI] [PubMed] [Google Scholar]
Associated Data
This section collects any data citations, data availability statements, or supplementary materials included in this article.