

Abstract
We describe a protocol for measuring the speed of human neutrophils migrating through small channels, in conditions of mechanical confinement comparable to those experienced by neutrophils migrating through tissues. In such conditions, we find that neutrophils move persistently, at constant speed for tens of minutes, enabling precise measurements at single cells resolution, for large number of cells. The protocol relies on microfluidic devices with small channels in which a solution of chemoattractant and a suspension of isolated neutrophils are loaded in sequence. The migration of neutrophils can be observed for several hours, starting within minutes after loading the neutrophils in the devices. The protocol is divided into four main steps: the fabrication of the microfluidic devices, the separation of neutrophils from whole blood, the preparation of the assay and cell loading, and the analysis of data. We discuss the practical steps for the implementation of the migration assays in biology labs, the adaptation of the protocols to various cell types, including cancer cells, and the supplementary device features required for precise measurements of directionality and persistence during migration.
Introduction
The standard textbook pictures of white blood cells moving through a homogenous space from circulation to a site of injury in tissues are often misleading. Far from moving in homogenous microenvironment, white blood cells encounter all sorts of obstacles during their journey through tissues in vivo. In particular, fast moving cells like neutrophils often have to squeeze in between other cells in the tissue, chimney through tiny capillaries, go around matrix fibers, and find passage ways through fibrin clots or scars (McDonald et al., 2010). Like the textbooks, most of the in vitro assays we are using today to study the migration of cells rarely acknowledge the complexity of the in vivo microenvironment. Traditional assays (Zigmond chamber, Dunn chamber, or micropipette assay) as well as the majority of microfluidic assays mostly observe the cells migrating on flat surfaces, without any of the tissue-relevant mechanical challenges. The limitations of the current assays are not just methodological, but they often preclude the decoupling of individual conditions and modulators of cell migration. One early example illustrating the new insights that could emerge from restoring the mechanical complexity of the cell migration microenvironment was the finding of calcium-independent cell migration after squeezing neutrophils in between glass and agarose gel (Malawista & de Boisfleury Chevance, 1997), a finding later confirmed also in dendritic cells (DCs) (Lammermann et al., 2008). More recently, emerging microfluidic platforms have taken the issue of mechanical complexity to a higher level of sophistication and increased precision of microenvironment control.
The use of microscale channels for mechanically confining the cells during migration creates opportunities for discovery and for designing more robust drug screening assays. For example, confining neutrophils to channels significantly smaller than the cell cross section has been shown to reduce the variability in speed during chemotaxis (Irimia, Charras, Agrawal, Mitchison, & Toner, 2007). In the absence of confinement, the variations in migration speed are a significant issue when analyzing neutrophil migration on flat surfaces. The reduced variability was important when analyzing the human neutrophil migration for the purpose of defining a normal range of values for neutrophil migration from healthy volunteers and for quantifying changes in patients (Butler et al., 2010). The confinement was also useful for measuring the migration of other leukocytes as well, as shown in studies using DCs (Faure-Andre et al., 2008; Renkawitz et al., 2009) and T cells (Jacobelli et al., 2010). More recently, precise comparisons of the migration speed and persistence of various cancer epithelial cells have been enabled by microfluidic devices that confined the moving cells to channels (Irimia & Toner, 2009; Scherber et al., 2012). In addition to the analysis of speed, small channels with bifurcations also helped quantify the directional decisions during migration in normal and cancer epithelial cells and in human neutrophils (Ambravaneswaran, Wong, Aranyosi, Toner, & Irimia, 2010; Scherber et al., 2012). In these devices, the directional decisions that cells make when encountering the bifurcations were quantified in binary mode, simplifying the analysis and comparisons between conditions. Additional challenges for the moving cells and opportunities for biological insights emerge from loading the channels with Matrigel (Wolfer et al., 2010), tapering the channels to small cross sections (Balzer et al., 2012; Gallego-Perez et al., 2012), or the combination of geometric and extracellular matrix conditions (Kraning-Rush, Carey, Lampi, & Reinhart-King, 2013). Applications are also emerging toward the identification of new drug targets for cell migration (Smolen et al., 2010) or new context for activities of existing compounds (Balzer et al., 2012; Rolli, Seufferlein, Kemkemer, & Spatz, 2010).
10.1 Designing The Devices
10.1.1 Size of the microchannels
The size and topography of the channels for cell migration is one important parameter that depends on the type of cells to be studied and the goals of the experiments. In the simplest design, straight channels, with cross section comparable to the size of the cells, enable precise measurements of cell speed. In the case of human neutrophils (10 μm average diameter for cells in suspension), channels having 6–8 μm width and 3 μm height appear to be optimal for observing robust cell migration. For the migration of cancer epithelial cells, larger channels (for example 10 μm × 10 μm) are most favorable (Irimia & Toner, 2009). The length of channels can vary from 100 to 1000 μm.
10.1.2 Cell loading chamber
Because the height of the migration channels is smaller than the cells in suspension, a second set of channels that are taller has to be used to accommodate the cells to the entrance of the migration channels. The cell loading chamber can be designed as tall as 100 μm. Cells introduced as a suspension in the devices, usually settle by gravity alone to the bottom of the cell loading chamber, closer to the entrance to the emigration channels.
10.1.3 Gradient formation
The chemokine gradient forms by diffusion between the cell migration channels and the cell loading chamber. The migration channels are designed as chemokine “sources”, from which the cheomokine will diffuse at predictable rates, dependent on the length, geometry, and cross section of the channels. The cell loading chamber serves as a “sink” for the chemoattractant diffusing from the migration channels, the larger the chamber, the more effective it will be at maintaining the reduced chemokine concentration. To achieve the differential loading of the migration channels and cell loading chamber with chemokine and buffer, respectively, we are taking advantage of a sequential protocol for operating the devices. Off the shelf, the devices contain no liquid and are filled with air. In the first step, the entire device is primed with chemokine solution, which will fill the dead-end migration channels as well as the loading chamber. In the second step, the loading chamber is washed by flowing buffer from the inlet to the outlet. Because there is no flow in the dead-end migration channels, only the chemokine in the loading chamber is washed off. Most of the chemokine initially in the migration channels, remains in these channels. Quickly after, the diffusion of this chemokine between the “source” and the “sink” in the absence of convection produces the chemokine gradients which ultimately drive the cells into the side channels. Because of the limited volume of the source and sink, these gradients will progressively decrease and eventually the chemokine concentration becomes uniform. The time to equilibrium depends on the molecular weight of the chemokine and design parameters of the device. Longer channels, having smaller cross section toward the loading chambers will result in longer lasting gradients.
10.2 Device Fabrication
Fabricating the devices requires two major steps. In the first step, a mold will be fabricated, with the negative of the channels. In the second step, the mold will be replicated in elastomeric material and bonded to a glass slide, completing the channels. While the first step requires specialized photolithography techniques usually performed in clean room environment, the second step is relatively simple and could be accomplished in any lab. It is important to know that hundreds of devices could be fabricated from just one mold. Consequently, it is most economical for users interested in the application of the devices, to first fabricate one mold through the various microfluidic foundries, resource centers, or academic labs specialized in making microfluidic devices. The fabrication of the microfluidic devices could be accomplished locally, at the time when as they are needed for experiments. The essential steps for fabricating the elastomeric devices and final assembly are described in detail in this section.
10.2.1 Materials
Silicone elastomer (Polydimethylsiloxane (PDMS), Dow Corning Sylgard 184 Silicone Encapsulant Clear 0.5 kg Kit, Ellsworth Adhesives, Germantown, WI)
Vacuum desiccator (F42020-0000, Bel-Art Products, Wayne, NJ)
Vacuum oven (VO 914A, Thermo Scientific)
Hot plate
Scalpel and razor blades
Handling tweezers (item # 758TW070 TechniTool, Worcester, PA)
Punch—Harris Unicore, 1 mm (item #15072, Ted Pella)
Precleaned glass slides or glass coverslips
Five inch plastic petri dishes
Weigh dishes (item #01018-04 Cole Parmer, Court Vernon Hills, IL)
Plastic forks
Wipes
10.2.2 Equipment
Balance (EL2001, Mettler Toledo, Columbus, OH)
Plasma cleaner (PDC32 G, Harrick Plasma, Ithaca, NY)
10.2.3 Method
Secure the silicon wafer (the mold) to the bottom of the plastic dish with tape. Position the wafer to the center of the dish for easier cutting of the elastomer after curing and uniform thickness.
Prepare the uncured elastomer by mixing the base and curing agent in 10:1 ratio. Prepare about 50 g of elastomer the first time when using a mold. After cutting out the first set of devices, only 15 g of elastomer is routinely necessary. Place the mixing tray on the balance and zero the reading. Add first the curing agent which is more fluid to the center of the tray. Then, add the base, which is more viscous, around the drop of curing agent. For a routine preparation, you would need 1.5 g of curing agent and 15 g of the base. Use the fork to mix the base and curing agent thoroughly for at least 2 min. Air bubble will form upon vigorous mixing and the mixture should look white at the end of mixing.
Pour the uncured elastomer over the wafer making sure the coverage is uniform. Place the dish in the vacuum jar for 30–60 min. The elastomer should look clear and transparent.
Place the dish in the oven set to 65 °C for 8–12 h. Make sure the shelves in the oven are leveled; this is very important for the uniform thickness of the devices.
Cut the elastomer off the surface of the mold. Using the scalpel, cut close to the edge of the mold, on the surface of the silicon wafer. Using clean gloves and tweezers, peel off slowly the cured elastomer from the surface of the mold, with extra care where the smaller features of the devices are. Place the elastomer on the flat, clean surface of a cutting board, with the features down. It is advisable that you cover the mold with a fresh layer of uncured elastomer, preventing dust or dirt from contaminating the surfaces. The mold with cured elastomer could be stored indefinitely at room temperatures.
From the piece of elastomer, cut smaller pieces to the size of the devices, using the razor blades. Punch the inlet and outlet holes using the core punch.
Place the glass slide (or coverslip) and the smaller piece of elastomer with the features facing up, inside the plasma machine. Follow the step-by-step instructions from the plasma machine manufacturer. You will notice the formation of purple plasma inside the plasma chamber. Expose the glass and elastomer surfaces to plasma for approximately 30 s. It is important to optimize the time of exposure to plasma for strongest bonding, depending on the particularities of the machine being used. Remove the glass slide and elastomer piece from the plasma machine using tweezers, careful not to touch the surfaces with your fingers.
Turn the elastomer upside down on the glass slide and press gently. Looking carefully at an approximately 45° angle you will notice the change in reflection at the interface between the two materials, indicating the effective bonding of the two surfaces. It is very important to know that you have only one chance of bringing the two surfaces together. If the two elastomer pieces need to be repositioned on the glass surface after the two surfaces come into contact, the plasma step has to be repeated.
Finally, place the device on the hotplate set to 90 °C for 3 min for extra strong bonding.
10.3 Measuring Cell Migration
10.3.1 Materials
Regents
Human fibronectin (Sigma Aldrich, St. Louis, MO)
Hank's buffered salt solution (Life Technologies, Grand Island, NY)
Food dyes (for training purpose only)
Materials
1 ml syringes (item # 309659, Becton Dickinson, Franklin Lakes, NJ)
Blunt syringe needles (BN3005, 30 G × ½ in., Brico Medical Supplies, Dayton, NJ)
Tygon tubing ID = 0.01 in., OD = 0.03 in. (S54HL Tygon Tubing, Greene Rubber, Woburn, MA)
Hemostats forceps (item # 13-812-45, Fisher Sci, Pittsburgh, PA)
Flat tip tweezers (item # 758TW462, TechniTool)
10.3.2 Equipment
Microscope and camera with time-lapse capabilities (Nikon TiE, Nikon, Japan)
Environmental chamber (Live Cell, Pathology Devices, Westminster, MD)
Image J software
10.3.3 Method
Prepare four 4 cm long pieces of the tubing for each channel of the device (Fig. 10.1). Fit 30 G blunt needles to one end of three of these pieces of tubing. For this, gently slide the tubing over the needle tip using your fingers.
Insert one piece of free tubing and one with a needle into the inlet and outlet holes of device using tweezers.
Fill one 1 ml syringe with 300 μl of the chemokine solution, connect the syringe to the needle, and slowly push the solution into the device. As soon as the solution starts coming out of the free end of the tubing at the outlet of the device, clamp that tubing using the forceps.
Continue pushing the syringe plunger. This will push the fluid into the side channels of the device (Fig. 10.2). Allow enough time for the air trapped in the dead-end side channels to escape by diffusion through the elastomer and into the chemokine solution. You could verify on a microscope that all the air has been removed from the side channels and the entire device is filled with chemokine solution. Remove the tubing with the syringe and leave one droplet of chemokine solution on top of the inlet hole.
Prepare a second syringe with 300 μl of buffer solution, connect it to a new piece of tubing, and gently fill the tubing with buffer until a droplet forms at the free end of the tubing. Using the tweezers, insert this tubing into the inlet hole of the device. Open the clamp on the outlet tubing and gently push the buffer through the device for approximately 10 s (Fig. 10.3). This step is very important, as it will remove the chemokine from the main channel and trigger the formation of the chemokine gradient between the main channel and the end of the side channels (Fig. 10.4). Clean the inlet and outlet drops of fluid. Clamp the outlet tubing and gently remove the inlet tubing and syringe, leaving a droplet of buffer solution on top of the inlet hole.
To introduce the cells, fill the cell suspension in the third syringe at density of 106 cells/ml or higher. Connect it to a new piece of tubing, and gently fill the tubing with the cell suspension until a droplet forms at the free end of the tubing. Using the tweezers, insert this tubing into the inlet hole of the device. Open the clamp on the outlet tubing and gently push the cell suspension through the device for approximately 3 s. Verify on a microscope that enough cells are present in the cell loading channel. If needed, flow more cells into the device, keeping in mind that the cells will settle inside the syringe with time, affecting the local cell density in the tubing. Remove tubing at inlet and close the channel by looping tubing in outlet over to the inlet.
Once the cells are loaded in the device, place the device in the environmental chamber on the microscope and start recording images (Fig. 10.5). The magnification and timing between images will depend on the size of the cells and purpose of the experiments. If measuring the speed of migration is the goal, 10 × magnification using phase contrast and 20-s interval between frames is usually sufficient. If the microscope has an automated stage, images from multiple locations in the device could be acquired in parallel stacks.
Images can be analyzed manually using the manual tracking routine in Image J http://rsb.info.nih.gov/ij/plugins/track/track.html. You could then export the data to Excel or other programs that could help with the presentation of the data and its analysis (Fig. 10.6). Options for automated tracking also exist, in particular if cells are fluorescently labeled before the migration assay. While many of the fluorescent dyes for cell tracking can interfere with the migration, it is important to compare the speed of cells tracked manually in phase-contrast images to the speed of labeled cells in fluorescence images.
Figure 10.1.
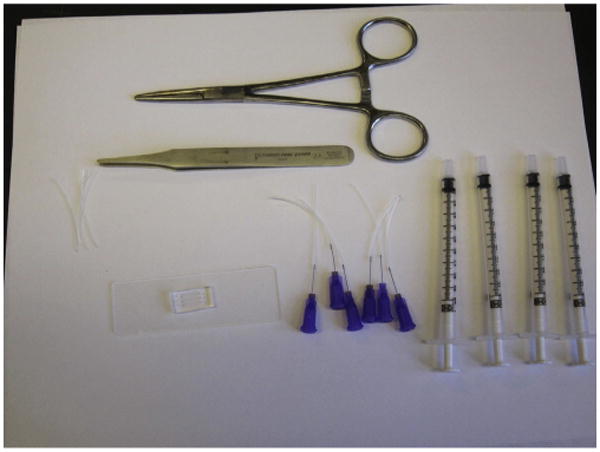
Microfluidic device on a standard glass slide, tubing, syringes, tweezers, and forceps necessary for setting up the cell migration experiments.
Figure 10.2.
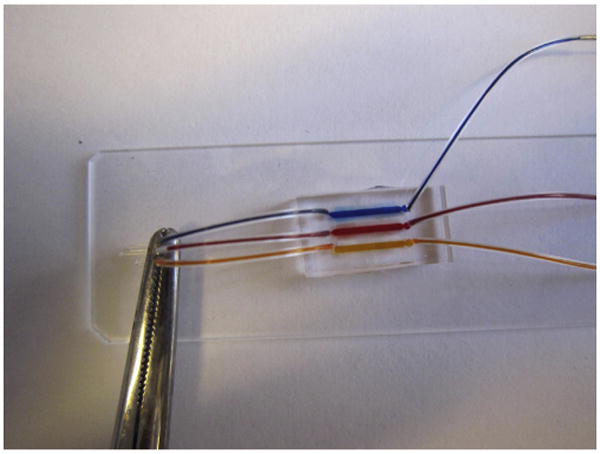
The microfluidic device primed with food dyes. Notice the array of side channels which are also filled.
Figure 10.3.
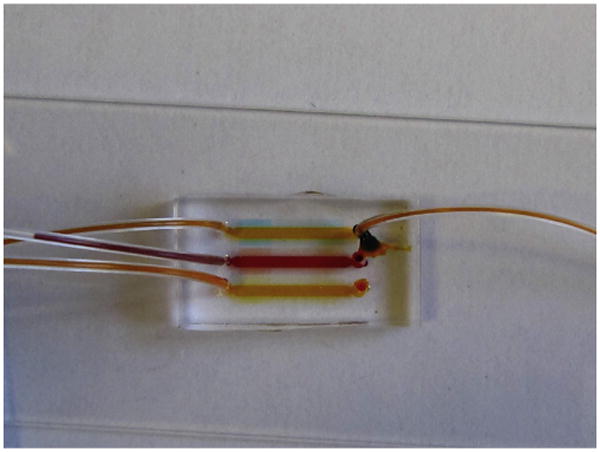
Soon after replacing the solution in the top “cell loading channel,” a gradient begins to form along the side channels. The droplet of fluid on top of the inlet (right) has to be cleaned before the tubing is removed.
Figure 10.4.
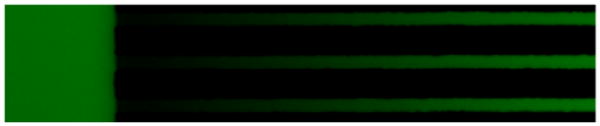
Spatial gradient of fluorescence along the cell migration channels. The cell loading chamber on the left also shows up in fluorescence because of the order of magnitude increased thickness.
Figure 10.5.
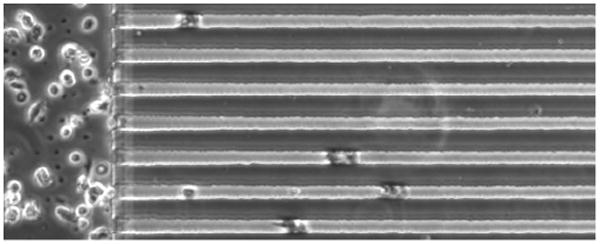
Human neutrophils from a healthy volunteer migrating through the channels in response to fMLP gradients (formyl-Methionyl-Leucyl-Phenylalanine, 100 nM maximum concentration), at 17 min after loading in the device.
Figure 10.6.
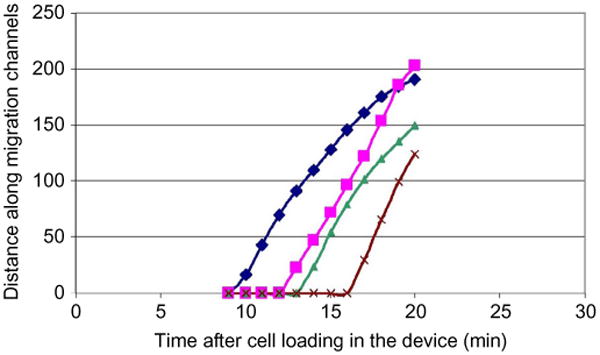
Example of neutrophil displacement versus time plots quantifying the migration in response to fMLP gradients. The four neutrophils enter difference channels at different times after cell loading but move at comparable and constant speed.
10.4 Discussion
Successful cell migration assays imply reproducible results from the same sample, independent of the operator. In our experience working with various microfluidic devices for cell migration, the confinement of cells in channels provides the most reliable devices, robust to perturbations and immune to large number of variables that one could encounter in experimental work. The learning curve for someone who has not used microfluidic devices before could be rather steep. However, after the initial setup hurdles fabricating and using microfluidic devices could become routine and the experimenter could focus quickly on the application rather than the technology. The ability to visualize the cells in channels at the different stages of the protocol provides immediate feedback which is not usually available through any other methods.
The migration assay could be easily adapted for probing the chemotaxis of cancer cells in gradients of growth factors (Desai, Bhatia, Toner, & Irimia, 2013). To accommodate for the larger cell size, the cross section of the channels is increased to 10 × 10 μm. Cancer cells can move through smaller as well as larger channels, but their migration speed decreases significantly in either one of the situations (Irimia et al., 2009). While cancer cells move an order of magnitude slower than neutrophils, the side channels also have to accommodate the need for gradients of growth factors that last for more than 12 h. This can be accomplished by extending the length of the side channels to increase the distance for diffusion or by designing larger reservoirs at the end of the side channels to increase the amount of factors available (Jones et al., 2012).
The protocol presented in this chapter is robust and adaptable to various purposes. For example, by implementing post and bifurcations in the design of the channels, the directionality of the moving cells could be measured directly, from the binary decisions at these locations (Ambravaneswaran et al., 2010; Scherber et al., 2012). Moreover, the design of migration channels can be easily modified to accommodate various cell types and various cell sizes. The length and geometry of the migration channels could be modified to increase the duration of the gradient for slower moving cells.
10.5 Practical Notes
Cut the tubing at an angle to facilitate inserting the tubing into the holes of the elastomeric devices.
To avoid bubbles, pipette small amount of phosphate buffered saline over inlet tubing such that a droplet of liquid surrounds the tubing before removing the chemokine-filled tubing from the inlet.
You should practice setting up the device using concentrated food dyes in water, without cells. The concentrated dye should allow you to see the gradient formed along the channels after flushing the main channel with water, providing quick feedback on the technique.
The first image of the device before cells enter the channels could be used as reference and subtracted from subsequent images to increase the contrast for the moving cells. This could allow automated cell tracking even in the absence of fluorescent labels.
PDMS devices are permeable to air and water, limiting the duration of experiments in the absence of an environmental chamber with humidity control.
It is possible to prime the cell loading chamber directly with the cell suspension and use the air trapped in the migration channels to temporarily confine the cells to the loading chamber. The air could be subsequently be removed by increasing the fluid pressure in the device, after the cells have attached (Mills, Frith, Hudson, & Cooper-White, 2011).
Immunochemistry of cells in channels is possible. One important difference compared to regular protocols on flat slides is the timing of each step.
Considering that the reagents will reach and leave the cells only by diffusion, it is important to increase the time with the square of molecular weight of the reagent (from minutes to hours for the fixation step, from minutes to tens of hours for the antibody loading and removing).
References
- Ambravaneswaran V, Wong IY, Aranyosi AJ, Toner M, Irimia D. Directional decisions during neutrophil chemotaxis inside bifurcating channels. Integrative Biology (Cambridge) 2010;2:639–647. doi: 10.1039/c0ib00011f. [DOI] [PMC free article] [PubMed] [Google Scholar]
- Balzer EM, Tong Z, Paul CD, Hung WC, Stroka KM, Boggs AE, et al. Physical confinement alters tumor cell adhesion and migration phenotypes. FASEB Journal. 2012;26:4045–4056. doi: 10.1096/fj.12-211441. [DOI] [PMC free article] [PubMed] [Google Scholar]
- Butler KL, Ambravaneswaran V, Agrawal N, Bilodeau M, Toner M, Tompkins RG, et al. Burn injury reduces neutrophil directional migration speed in microfluidic devices. PLoS One. 2010;5:e11921. doi: 10.1371/journal.pone.0011921. [DOI] [PMC free article] [PubMed] [Google Scholar]
- Desai SP, Bhatia SN, Toner M, Irimia D. Mitochondrial localization and the persistent migration of epithelial cancer cells. Biophysics Journal. 2013;104:2077–2088. doi: 10.1016/j.bpj.2013.03.025. [DOI] [PMC free article] [PubMed] [Google Scholar]
- Faure-Andre G, Vargas P, Yuseff MI, Heuze M, Diaz J, Lankar D, et al. Regulation of dendritic cell migration by CD74, the MHC class II-associated invariant chain. Science. 2008;322:1705–1710. doi: 10.1126/science.1159894. [DOI] [PubMed] [Google Scholar]
- Gallego-Perez D, Higuita-Castro N, Denning L, DeJesus J, Dahl K, Sarkar A, et al. Microfabricated mimics of in vivo structural cues for the study of guided tumor cell migration. Lab on a Chip. 2012;12:4424–4432. doi: 10.1039/c2lc40726d. [DOI] [PubMed] [Google Scholar]
- Irimia D, Charras G, Agrawal N, Mitchison T, Toner M. Polar stimulation and constrained cell migration in microfluidic channels. Lab on a Chip. 2007;7:1783–1790. doi: 10.1039/b710524j. [DOI] [PMC free article] [PubMed] [Google Scholar]
- Irimia D, Toner M. Spontaneous migration of cancer cells under conditions of mechanical confinement. Integrative Biology (Cambridge) 2009;1:506–512. doi: 10.1039/b908595e. [DOI] [PMC free article] [PubMed] [Google Scholar]
- Jacobelli J, Friedman RS, Conti MA, Lennon-Dumenil AM, Piel M, Sorensen CM, et al. Confinement-optimized three-dimensional T cell amoeboid motility is modulated via myosin IIA-regulated adhesions. Nature Immunology. 2010;11:953–961. doi: 10.1038/ni.1936. [DOI] [PMC free article] [PubMed] [Google Scholar]
- Jones CN, Dalli J, Dimisko L, Wong E, Serhan CN, Irimia D. Microfluidic chambers for monitoring leukocyte trafficking and humanized nano-proresolving medicines interactions. Proceedings of the National Academy of Sciences of the United States of America. 2012;109:20560–20565. doi: 10.1073/pnas.1210269109. [DOI] [PMC free article] [PubMed] [Google Scholar]
- Kraning-Rush CM, Carey SP, Lampi MC, Reinhart-King CA. Microfabricated collagen tracks facilitate single cell metastatic invasion in 3D. Integrative Biology (Cambridge) 2013;5:606–616. doi: 10.1039/c3ib20196a. [DOI] [PMC free article] [PubMed] [Google Scholar]
- Lammermann T, Bader BL, Monkley SJ, Worbs T, Wedlich-Soldner R, Hirsch K, et al. Rapid leukocyte migration by integrin-independent flowing and squeezing. Nature. 2008;453:51–55. doi: 10.1038/nature06887. [DOI] [PubMed] [Google Scholar]
- Malawista SE, de Boisfleury Chevance A. Random locomotion and chemotaxis of human blood polymorphonuclear leukocytes (PMN) in the presence of EDTA: PMN in close quarters require neither leukocyte integrins nor external divalent cations. Proceedings of the National Academy of Sciences of the United States of America. 1997;94:11577–11582. doi: 10.1073/pnas.94.21.11577. [DOI] [PMC free article] [PubMed] [Google Scholar]
- McDonald B, Pittman K, Menezes GB, Hirota SA, Slaba I, Waterhouse CC, et al. Intravascular danger signals guide neutrophils to sites of sterile inflammation. Science. 2010;330:362–366. doi: 10.1126/science.1195491. [DOI] [PubMed] [Google Scholar]
- Mills RJ, Frith JE, Hudson JE, Cooper-White JJ. Effect of geometric challenges on cell migration. Tissue Engineering Part C Methods. 2011;17:999–1010. doi: 10.1089/ten.TEC.2011.0138. [DOI] [PubMed] [Google Scholar]
- Renkawitz J, Schumann K, Weber M, Lammermann T, Pflicke H, Piel M, et al. Adaptive force transmission in amoeboid cell migration. Nature Cell Biology. 2009;11:1438–1443. doi: 10.1038/ncb1992. [DOI] [PubMed] [Google Scholar]
- Rolli CG, Seufferlein T, Kemkemer R, Spatz JP. Impact of tumor cell cytoskeleton organization on invasiveness and migration: A microchannel-based approach. PLoS One. 2010;5:e8726. doi: 10.1371/journal.pone.0008726. [DOI] [PMC free article] [PubMed] [Google Scholar]
- Scherber C, Aranyosi AJ, Kulemann B, Thayer SP, Toner M, Iliopoulos O, et al. Epithelial cell guidance by self-generated EGF gradients. Integrative Biology (Cambridge) 2012;4:259–269. doi: 10.1039/c2ib00106c. [DOI] [PMC free article] [PubMed] [Google Scholar]
- Smolen GA, Zhang J, Zubrowski MJ, Edelman EJ, Luo B, Yu M, et al. A genome-wide RNAi screen identifies multiple RSK-dependent regulators of cell migration. Genes and Development. 2010;24:2654–2665. doi: 10.1101/gad.1989110. [DOI] [PMC free article] [PubMed] [Google Scholar]
- Wolfer A, Wittner BS, Irimia D, Flavin RJ, Lupien M, Gunawardane RN, et al. MYC regulation of a “poor-prognosis” metastatic cancer cell state. Proceedings of the National Academy of Sciences of the United States of America. 2010;107:3698–3703. doi: 10.1073/pnas.0914203107. [DOI] [PMC free article] [PubMed] [Google Scholar]