Abstract
The gradient produced by an HPLC is never the same as the one it is programmed to produce, but non-idealities in the gradient can be taken into account if they are measured. Such measurements are routine, yet only one general approach has been described to make them: both HPLC solvents are replaced with water, solvent B is spiked with 0.1% acetone, and the gradient is measured by UV absorbance. Despite the widespread use of this procedure, we found a number of problems and complications with it, mostly stemming from the fact that it measures the gradient under abnormal conditions (e.g. both solvents are water). It is also generally not amenable to MS detection, leaving those with only an MS detector no way to accurately measure their gradients. We describe a new approach called “Measure Your Gradient” that potentially solves these problems. One runs a test mixture containing 20 standards on a standard stationary phase and enters their gradient retention times into open-source software available at www.measureyourgradient.org. The software uses the retention times to back-calculate the gradient that was truly produced by the HPLC. Here we present a preliminary investigation of the new approach. We found that gradients measured this way are comparable to those measured by a more accurate, albeit impractical, version of the conventional approach. The new procedure worked with different gradients, flow rates, column lengths, inner diameters, on two different HPLCs, and with six different batches of the standard stationary phase.
Keywords: Measure HPLC Gradient, Retention Projection, Liquid Chromatography-Mass Spectrometry, System Suitability Check, Retention Time Calculation, Retention Prediction
1. Introduction
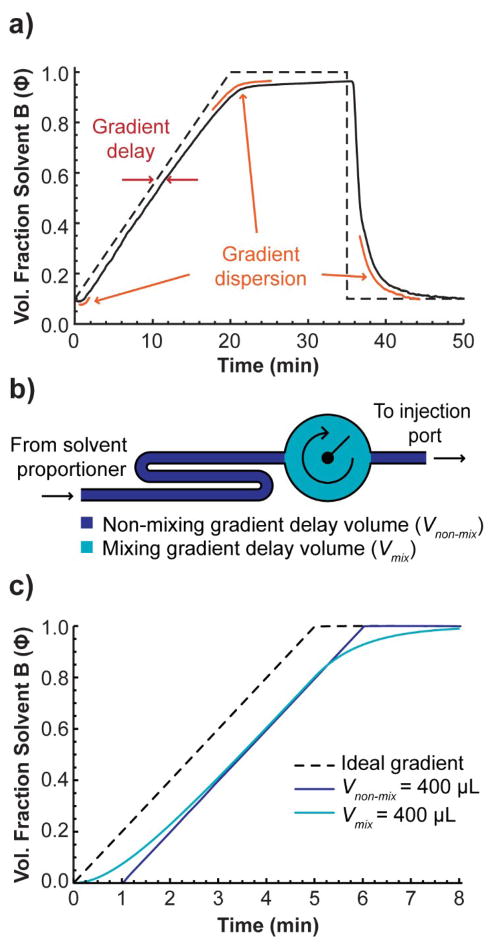
Gradient elution solves some important problems while adding complications of its own [1]. One major complication is that HPLC systems, without exception, are incapable of producing the precise gradient they are programmed to produce [2–5]. For example, Figure 1a shows a gradient produced by one of the HPLC systems in our lab that is less than five years old and in good repair. There are some major differences (non-idealities) between it and the programmed (ideal) gradient.
Figure 1.
a) Comparison of the ideal (programmed) gradient and the actual gradient produced by an HPLC system as measured from the point of sample injection, b) depiction of the sources of gradient delay volume, c) two simulated gradients, one with 400 μL non-mixing volume and no mixing volume (the gradient is just delayed), and the other with 400 μL non-mixing volume and no non-mixing volume (the gradient is delayed and dispersed).
Gradient non-idealities are usually categorized into three types: gradient delay, gradient dispersion, and solvent mis-proportioning [1,2]. Gradient delay time (also called the “dwell” time) is the delay from the time the gradient is programmed to be produced to when it actually reaches the point where the sample is injected. Gradient dispersion is the rounding out of the gradient, resulting in more gradual changes in slope as if a low-pass filter were applied to the gradient profile. Any other gradient non-ideality that is not described by the former two categories, we call solvent mis-proportioning.
Gradient delay and gradient dispersion originate from volume in the pump, tubing, fittings, and valves, starting at the point where the solvents are proportioned to where the mixed solvent reaches the point of injection (see Supporting Information for more details). One can think of the gradient delay volume as the sum of two parts: mixing volume, Vmix, and non-mixing volume, Vnon-mix (Figure 1b). Non-mixing volume can be represented by a long piece of narrow tubing; it takes a significant amount of time for solvent to travel its length, but the solvent does not mix with the solvent on either side of it as it travels through (of course, in reality it would mix to some extent by Aris-Taylor dispersion [6]). On the other hand, mixing volume may be approximately represented by a thoroughly mixed reservoir. Newly proportioned solvent entering the reservoir is mixed with the solvent that is already there before it leaves the reservoir at the other end, slowing the rate at which the solvent composition can change. Therefore, while non-mixing volume contributes only gradient delay, mixing volume contributes both gradient delay and gradient dispersion.
If one is unaware of the gradient non-idealities produced by their instrument, they can be a major source of trouble. One important problem arises when attempting to transfer a method developed on one HPLC to a different HPLC. Differences between the gradients produced by each instrument can cause shifts in retention times and even relative retention times (i.e. the selectivity is different) [1,3,4,7–9]. Another common problem arises when running a series of consecutive gradients. If insufficient time is provided between the gradients, the solvent composition will not return all the way back to the initial composition, thereby altering the separation [1]. One may avoid this irreproducibility by simply ignoring the first gradient of each series, but it is difficult to optimize the subsequent separations in the series without understanding the behavior of the HPLC in them. All of these problems are magnified in LC-MS where gradient non-idealities are exaggerated by the relatively low flow rates typically used (100 to 800 μL/min).
Therefore, it is important to measure the actual gradient produced by an HPLC. There is no “rule of thumb” that can be used to avoid measuring gradient non-idealities; gradient delay volume alone can span well over an order of magnitude (e.g., the Agilent 1290 binary pump specifies a gradient delay volume of <45 uL while the Agilent 1200 quaternary pump specifies a gradient delay volume of up to 1100 uL). But by measuring gradient non-idealities, one can take them into account, optimize methods by running their instruments close to their limits, and troubleshoot instrument problems.
1.1 The conventional approach to measure HPLC gradients
Despite the importance of measuring gradients, we are aware of only one basic approach to measure them [2,3,10]:
Replace the column with a piece of tubing narrow and/or long enough to generate the minimum required back-pressure for the HPLC instrument.
Replace solvent A with water and solvent B with water containing 0.1% acetone.
Measure the “instrument dead time” (the time it takes for an injected solute to reach the detector with the column bypassed) by injecting a detectable compound at a relatively low flow rate of solvent A and recording its retention time.
Run a relatively fast gradient (e.g. 5 min) from 0% B to 100% B and record the absorbance at 265 nm as a function of time.
Shift the timescale of the absorbance data back by an amount equal to the instrument dead time.
Then, to measure the total gradient delay volume, one line is fit to the baseline (before the gradient) and another line is fit to the gradient. The two lines are extrapolated and the gradient delay time is determined from their intersection. To measure the mixing volume, the error in the volume fraction of solvent B, δϕ, at the gradient delay time (see Figure S-1) is used in the following equation [2,3]:
| (1) |
where Vg is the gradient volume (Vg = tgF) and ϕi and ϕf are the initial and final volume fractions of solvent B.
Despite widespread use of this methodology (a small sampling of articles that describe/use it are as follows: [1,2,8,10–19]), we are not aware of any report in which its accuracy has been validated. In fact, we find two major problems with it. First, the gradient is not measured under the same conditions as a typical HPLC run: both solvents are water and the backpressure differs from when the column is in place. These differences can cause bias in the measured gradient. On one of our HPLC systems, the gradient measured this way was drastically different than when acetonitrile was used in solvent B (see Results and Discussion). Of course, the most obvious way to fix the problem is to change the second solvent to acetonitrile, but as we discuss below, this causes a number of complications and the effort required to accommodate them makes the approach impractical for most users.
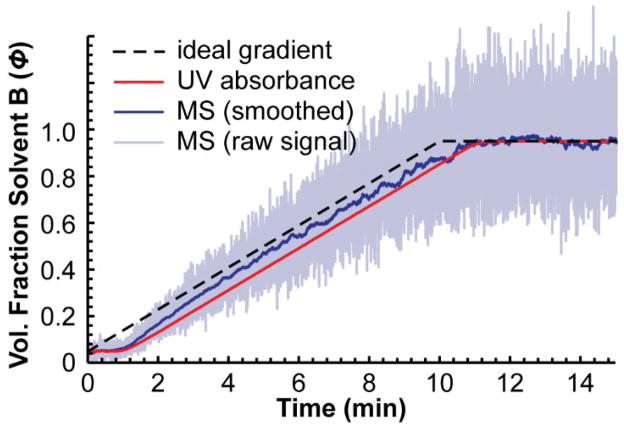
The second problem is that the approach requires an absorbance detector (or a conductivity detector if a salt is used instead of acetone). We could not find any reports describing a gradient successfully measured with MS detection and in our experience, the MS signal was unsuitable for this purpose. Figure 2 shows a gradient measured by MS and by UV absorbance using caffeine as the tracer compound instead of acetone. The signal from the MS was extremely noisy and had to be heavily filtered before it could be meaningfully compared to the profile measured by UV absorbance. Even then, the profile showed major differences from the profile measured by UV absorbance and it changed over time as the experiment was repeated. This was the case on both MS instruments we tried—one an ion trap MS and the other a triple quadrupole MS. This leaves many LC-MS users with no reliable way to accurately measure the gradient produced by their HPLC if they do not have another type of detector.
Figure 2.
A gradient measured using a UV absorbance detector and a mass spectrometer by the conventional approach using caffeine as the tracer. Both the raw extracted ion chromatogram (195 m/z) for caffeine and a smoothed chromatogram (moving average, n = 160) are shown. The MS signal was noisy and did not measure the same gradient as the UV absorbance detector. The gradient was a 10 min gradient from 5% to 95% B at a flow rate of 400 μL/min.
1.2 “Measure Your Gradient”
Here we describe a new approach to measure HPLC gradients that is practical, can be used under common LC-MS conditions, and is compatible with both MS and absorbance detectors. We call the approach, “Measure Your Gradient”, or MYG. In short, one runs a test mixture containing 20 standards in a gradient on a standard stationary phase (currently, the Eclipse Plus C18 phase with 3.5 μm particle size) and then enters the observed retention times into online software we developed (available at www.measureyourgradient.org). Using the observed gradient retention times and the known isocratic retention behavior of the 20 standards, the software back-calculates the gradient that must have been produced by the HPLC system.
In this work, we present a preliminary investigation of the new approach in which we compare it to the conventional approach and to a modified version of the conventional approach that uses acetonitrile as the second solvent. We also compare gradients and gradient delay volumes measured by MYG and the modified conventional approach at different gradient lengths and flow rates. Lastly, we test the reproducibility of MYG with different column lengths, inner diameters, and with simulated error in the temperature produced by the column oven.
2. Experimental
2.1 Chemicals
Water was purified in-house by a Barnstead (Dubuque, IA) B-Pure water filtration system and then distilled. CHROMASOLV Plus grade acetonitrile was purchased from Sigma-Aldrich (St. Louis, MO) and formic acid (≥99.5% pure) was purchased from Fisher Scientific (Pittsburgh, PA). All other chemicals and solvents were purchased from Sigma-Aldrich (St. Louis, MO), Alfa Aesar (Ward Hill, MA), or TCI America (Portland, OR).
2.2 Test Mixture
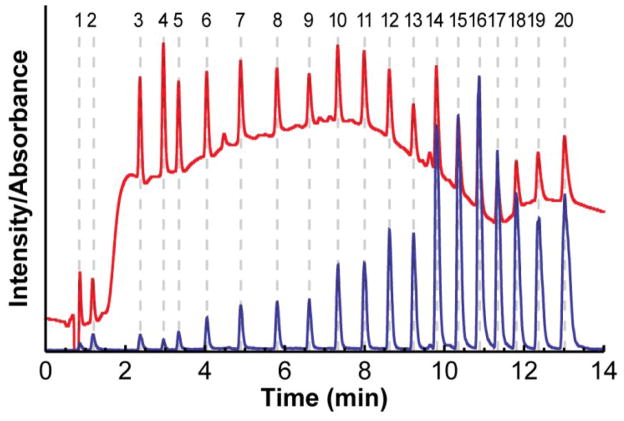
Twenty standards were developed for the MYG test mixture that give a strong signal by both UV absorbance and electrospray ionization-MS, cover a wide range of retention times in a gradient, and have different molar masses so that they can be easily distinguished from one another by MS detection. They were also selected because they are uncharged at the pH of the mobile phase and their retention is therefore less sensitive to error in the pH of the mobile phase. The test mixture contained (in order of increasing retention): 100 μM N-methylacetamide, 100 μM N-ethylacetamide, 100 μM N,N-dimethylpropionamide, 100 μM benzamide, and 25 μM of each N-alkylbenzamide from N-methylbenzamide to N-hexadecylbenzamide, all dissolved in 5% acetonitrile/95% water. Many of the benzamides were not commercially available and had to be synthesized (see below). Figure 3 shows chromatograms of the test mixture measured by both UV absorbance and MS detection. The test mixture is available from the website.
Figure 3.
Chromatograms of the MYG test mixture measured by MS detection (blue) and UV absorbance at 210 nm (red) in a 10 min gradient from 5% to 95% B at 400 μL/min. The peak positions of the 20 standards are shown with dashed gray lines.
2.3 Synthesis of N-alkylbenzamides
N-propylbenzamide and all benzamides of higher molar mass were synthesized in an adaptation of the Schotten-Baumann method [20–22], here described just for N-propylbenzamide. Propylamine (887 mg, 15 mmol) was added to a mixture of ethyl ether (20.0 mL) and aqueous NaOH (20.0 mL, 1.0 M) cooled to 0 °C in a 50 mL round-bottomed flask with a magnetic stirrer. The solution was stirred for 10 min and benzoyl chloride (2.636 g, 18.75 mmol) was then added drop-wise to the solution. The mixture was stirred at 0 °C for 45 min in an ice bath to form N-propylbenzamide as a precipitate. The crude product was filtered, dried under vacuum, and recrystallized in 15 mL ethanol, cooled to 0°C, to give colorless crystals with generally 70–80% yield. Analysis by GC-MS showed >99% purity.
2.4 Instrumentation
Two different LC-MS instruments were used which, hereafter, will be referred to as instruments ‘A’ and ‘B’. The first instrument, instrument ‘A’, was a Thermo Fisher Scientific Inc. (Waltham, MA) UltiMate 3000 Binary Rapid Separation LC system, a Rapid Separation Autosampler, a TCC-3000RS column oven with pre-column eluent heaters, and a DAD-3000RS diode array detector combined with a Bruker Amazon SL ion trap MS. The second instrument, instrument ‘B’, was a Thermo Fisher Scientific Inc. Accela UHPLC Pump (standard model), an Accela Autosampler with a 5 μL injection loop, an Accela Photo Diode Array detector, and a TSQ Quantum Access Triple Stage Quadrupole Mass Spectrometer with a HESI-II heated electrospray ionization source.
2.5 Software
The MYG software was compiled for compliance with the Java 1.6 (Oracle, Redwood Shores, CA) runtime environment. It includes the Java OpenGL (JOGL) binding library version 2.0-rc11 (JogAmp, http://jogamp.org), the Unidata netCDF library version 4.2 (Unidata®, Boulder, CO), the Savitzky-Golay filter library version 1.2 by Marcin RzeŸnicki (http://code.google.com/p/savitzky-golay-filter/), the jmzML library [23], and the jmzReader library [24]. The source code may be downloaded from http://www.measureyourgradient.org/development.
2.6 Isocratic Measurements
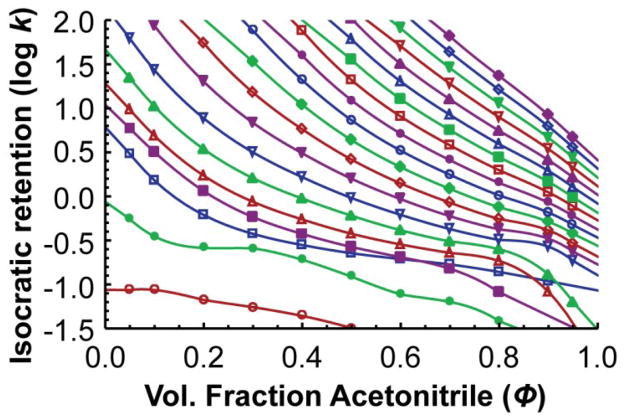
For each isocratic measurement, the mobile phase was premixed to avoid bias from any online mixing errors associated with the HPLC system. They were prepared gravimetrically to match the volume ratio that would be achieved if they were prepared volumetrically at 25 °C: First, two stock solutions were prepared: 0.1% formic acid in water (solvent A) was prepared by adding 0.610 g formic acid to 498.00 g of water. Acetonitrile with 0.1% formic acid (solvent B) was prepared by adding 0.610 g formic acid to 393.11 g of acetonitrile. From those two solutions, premixed solvents were prepared at 11 different solvent compositions: 5.00% B, 95.00% B, and from 10.00% to 90.00% B at 10.00% intervals. The MYG test mixture was run under isocratic elution on Instrument A (at 400 μL/min) with each pre-mixed solvent (three replicates, 5 μL injection volume) and an Eclipse Plus C18 column (2.1 x 100 mm, 3.5 μm particle size) held at 35.0 °C. The air temperature inside the forced air column oven was determined to be within ±0.1 °C by a secondary platinum reference standard temperature probe placed inside the oven on plastic standoffs. Retention factors were measured for each standard and for the dead time marker (measured from the apex of each peak) with each of the 11 mobile phase compositions, and the three replicates were averaged to give the final retention factors. Retention factors were corrected for instrument dead time. Uracil was the dead time marker. Uracil is slightly retained at low acetonitrile fractions, biasing the calculated retention factors of the standards, but it does not bias the back-calculated gradient because the same uracil dead times are used to calculate gradient retention times, canceling out the bias. Figure 4 shows the measured isocratic retention factors as a function of solvent composition for each of the 20 standards. The unusual relationships of N-methylacetamide and N-ethylacetamide are mostly a result of the fact that retention factors were small and had much more error associated with them.
Figure 4.
Measured isocratic retention vs. solvent composition relationships for each of the 20 standards: N-methylacetamide (
 ), N-ethylacetamide (
 ), N,N-dimethylpropionamide (
 ), benzamide (
 ), N-methylbenzamide(
 ), N-ethylbenzamide (
 ), N-propylbenzamide (
 ), N-butylbenzamide (
 ), N-pentylbenzamide (
 ), N-hexylbenzamide (
 ), N-heptylbenzamide (
 ), N-octylbenzamide (
 ), N-nonylbenzamide (
 ), N-decylbenzamide (
 ), N-undecylbenzamide (
 ), N-dodecylbenzamide (
 ), N-tridecylbenzamide (
 ), N-tetradecylbenzamide (
 ), N-pentadecylbenzamide (
 ), and N-hexadecylbenzamide (
 ).
).
3. Results/Discussion
3.1 The Modified Conventional Procedure
Despite the widespread use of the conventional approach to measure HPLC gradient profiles [1,2,8,10–19], we found that with at least one make/model of HPLC, it fails to measure the gradient produced under typical experimental conditions. We came across this problem when we discovered that gradient retention times of late-eluting compounds were much later on HPLC instrument B than expected. We assumed it had something to do with the gradient produced by instrument B, but when we used the conventional approach to measure it, we saw nothing unusual.
After exhausting all other possibilities, we went back and re-measured the gradient produced by the instrument using acetonitrile (with 0.1% acetone) as solvent B instead of water. Unfortunately, this was complicated by the fact that the molar absorptivity of acetone changes as a function of the acetonitrile fraction. Therefore, we first had to measure and correct for the dependence of molar absorptivity on solvent composition. Moreover, since the molar absorptivity corrections were measured using solvents mixed online by the HPLC pump, we also corrected for systemic solvent proportioning errors. Altogether, this modified version of the conventional procedure, which we call the “modified conventional approach”, was as follows:
Replace the column with a piece of narrow tubing long enough to generate the minimum required back-pressure for the HPLC instrument.
Replace solvent A with water and solvent B with water containing 0.1% acetone.
Measure the “instrument dead time” (the time it takes for an injected solute to reach the detector with the column bypassed).
Run steps from 0% to 100% B at 5–10% intervals.
Calculate the actual solvent composition the pump produces at each programmed solvent composition.
Replace solvent B with 0.1% acetone in acetonitrile.
Run steps again from 0% to 100% B at 5–10% intervals.
Assuming the same solvent proportioning errors as determined from step 5, determine the relationship between absorbance and solvent composition.
Run a relatively fast gradient (e.g. 5 min) from 0% B to 100% B and record the absorbance at 265 nm as a function of time.
Apply the correction from step 8 to determine solvent composition as a function of time.
Shift the timescale of the absorbance data back by an amount equal to the instrument dead time.
After we measured the gradient produced by instrument B with this approach, it became obvious why later-eluting compounds were retained so much longer than expected – the gradient was severely distorted when acetonitrile was used in solvent B (Figure 5). The same behavior was observed with two other HPLCs of the same make and model and we could not find any pump settings that could be altered to fix the problem (e.g., solvent compressibility settings), suggesting that the behavior was characteristic of this type of instrument, which was only five years old. Of course, the HPLC pump used in this example is an extreme case, but in our experience with other makes and models of pumps, we find that gradients are often more dispersed at the end than at the beginning when acetonitrile is used as solvent B. This is possibly a result of the different densities of the two solvents and the geometries of the mixing elements, causing them to mix better at some solvent compositions than at others. In any case, this example illustrates that the conventional approach for measuring gradient profiles can be misleading, indicating that an instrument is functioning properly when, under normal experimental conditions, it is not.
Figure 5.
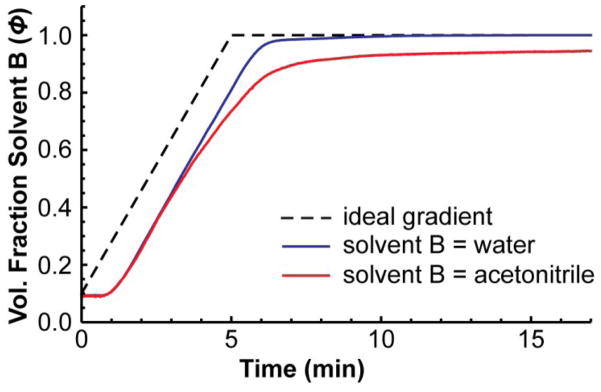
The same gradient measured on instrument B by the conventional approach and by the modified conventional approach. The gradient was fairly normal when solvent B was water, but it was severely distorted when solvent B was acetonitrile, even after correcting for changes in molar absorptivity as a function of solvent composition.
A more accurate gradient can yield useful information. For example, in this case it would indicate that a method transfer to such an instrument may fail for late-eluting compounds as they will experience a shallower gradient than they would on other instruments that produce less distortion. The gradient could also be modified to offset the distortion to some degree or to emulate the distortion on another HPLC instrument, although we are not aware of any standard methodology to do this, yet. More accurate knowledge of the gradient would also inform method development—one can see that with this HPLC system, it takes an especially long time to reach a solvent composition after it is programmed to produce it. Therefore, it would be necessary to give this HPLC plenty of time to return to a solvent composition near the initial one when it is preparing for the next run [25]. In our case, we used the information to model retention in a gradient with much higher accuracy [26].
Nevertheless, we do not recommend this procedure for general use. Not only was it time-consuming and difficult, it was also complicated by a number of other factors. For instance, unless the length of the tube that replaces the column is carefully tuned, it will not produce the same backpressure as the column. With some HPLC instruments, particularly those with diaphragm pulse dampeners, the backpressure strongly influences the shape of the gradient. We also found that it was necessary to re-measure the absorbance vs. solvent composition relationship (steps 4–8) on each absorbance detector due to slight differences between the detectors (Figure S-2). Finally, we found that vacuum degassers can cause major error, especially at low flow rates (see Supporting Information), sometimes making it necessary to bypass the vacuum degasser and degas the solvents a different way.
3.2 The “Measure Your Gradient” Procedure
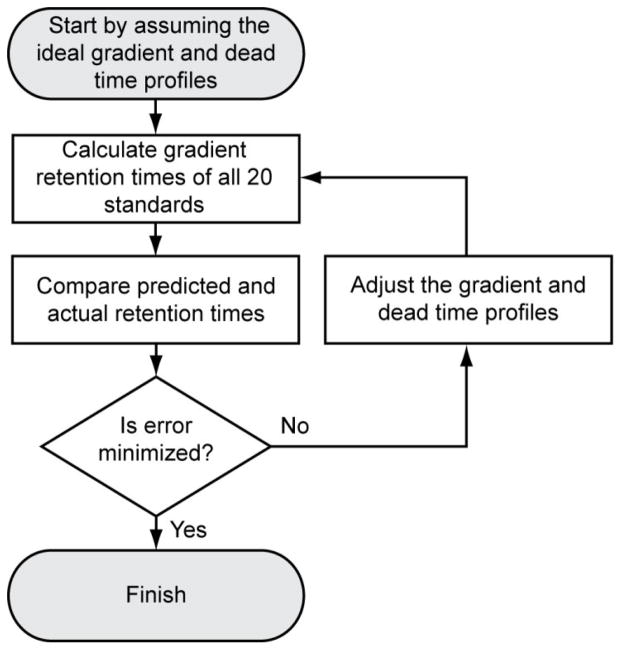
In contrast, the MYG methodology measures the gradient under common reversed-phase conditions used in LC-MS, is relatively easy to use, and it takes a similar amount of time as the conventional approach. It uses the gradient retention times of a set of 20 standards (see Experimental section) run on a standard stationary phase (currently the Eclipse Plus C18 phase with 3.5 μm particle size) to back-calculate the gradient and the dead time vs. solvent composition profile that must have been produced in the run. It back-calculates them by the convergent, iterative process outlined in Figure 6. It begins with the ideal gradient and dead time profile. In the case of the dead time profile, the “ideal” profile is the one we previously measured for the Eclipse Plus C18 phase using uracil as the dead time marker, scaled to the specified column dimensions. Then it makes a small change to the profiles in turn. After each change, the expected retention times of the standards are re-calculated from the new profiles and from measurements of each standard’s isocratic retention (see Experimental section) which are built into the software. (Gradient retention time calculations are discussed in Supporting Information.) The process repeats until the differences between the experimental and calculated retention times are minimized. The interested reader may find more details about the algorithm in the source code, which is available on the website.
Figure 6.
Flow chart showing how MYG iteratively back-calculates the gradient and dead time profiles.
Despite the overall complexity of the methodology, the approach is quite simple from a user’s perspective. The MYG procedure is as follows (step-by-step instructions are also given online):
Prepare solvents A and B. Solvent A must be 0.10% (v/v) formic acid in water and solvent B must be 0.10% formic acid (v/v) in acetonitrile. Up to 10% error in the formic acid concentration is acceptable as we found that it does not significantly affect the back-calculated gradients.
Measure the instrument dead time. Replace the column with a short piece of narrow bore tubing. We recommend 50 cm of PEEKsil tubing (IDEX Health & Science, Oak Harbor, WA) with 50 μm inner diameter (the ~1 μL of volume it contains is negligible, but it generates enough backpressure to meet the minimum backpressure required for most HPLC pumps). Then run the MYG test mix in a 1 min long isocratic method (50% B) at a relatively low flow rate (e.g., 200 μL/min). All of the standards should come out at about the same time since there is no column to retain them, but we recommend scanning for the 150 m/z ion (ethylbenzamide) if a mass spectrometer is used as the detector. If a UV absorbance detector is used, set it to 210 nm. A sampling rate of at least 5 Hz should be used if possible. The retention time that is measured is the instrument dead time at that flow rate.
Run the Measure Your Gradient test mix. The test mixture may be obtained from the website. Virtually any gradient program and flow rate may be used so long as: a) the column contains the Eclipse Plus C18 stationary phase (3.5 μm particles), though it can be of any length and inner diameter, b) the column temperature is set to 35 °C, c) the initial solvent composition is ≥5% B and the final solvent composition is ≤95% B, and d) the needle wash solvent is equal to or less than 5% B. Note that when measuring gradient delay volume, more precise results can be obtained with fast, steep gradients and/or a low flow rates. With newer HPLC equipment, a 5 min gradient from 5% to 95% B at a flow rate of 200 μL/min is a good place to start.
(optional) Convert the LC-MS data file into an open-source file format. Instructions are provided on the website to convert files with ProteoWizard [27].
Back-calculate the gradient. Launch the Measure Your Gradient application from the website (see Figure S-3). Enter the column inner diameter and length, the flow rate that was used, the gradient program that was run, the instrument dead time/volume that was measured in step 2 (if it is entered as a time, make sure it is appropriately scaled for the flow rate used), and the retention times of each of the standards in the MYG test mix with three decimal places precision. The retention times may be entered manually or automatically extracted from an mzXML, mzML, or netCDF file of the LC-MS run. We found this feature greatly speeds up the process and reduces the chance of errors in transcription of retention times. Then click the “Next Step” button and then the “Back-Calculate Profiles” button. The software iteratively optimizes the gradient and dead time profiles so as to minimize the difference between the experimental and calculated retention times. At first, it only optimizes the mixing volume, non-mixing volume, and dead time profile, but if desired, it can continue to optimize the entire gradient, allowing it to take on any shape so that it may reflect solvent proportioning errors.
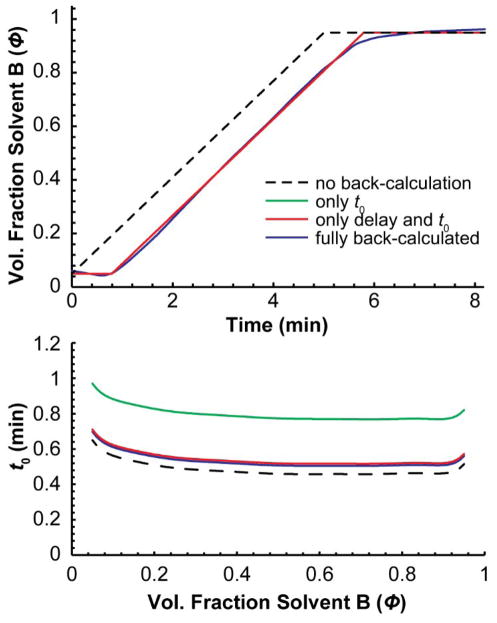
To illustrate the importance of each step of the back-calculation process and its effect on the resulting retention times, Table 1 shows the measured retention times of the 20 standards in a 5 min gradient along with the errors in the calculated retention times for each standards after different degrees of back-calculation. The corresponding gradients and dead time profiles back-calculated for each of the four cases are shown in Figure 7. When the retention times of the standards were calculated assuming ideal gradient and dead time profiles, the error was quite large (±0.89 min). Allowing the software to back-calculate only the dead time profile improved the accuracy 3-fold, but allowing it to also back-calculate gradient delay, i.e., Vnon-mix, improved the accuracy 20-fold. When the gradient was allowed to take on any shape (accommodating gradient dispersion and solvent misproportioning), the error dropped all the way to ±0.002 min, 22-fold more accurate than when only gradient delay was allowed to change. As can be seen in Figure 7, the differences between those two gradients are small, but they had a considerable effect on the accuracy of the calculated retention times of the standards.
Table 1.
Measured Retention Times and Error in the Calculated Retention Times of the Standardsa with Different Degrees of Back-Calculation
| Standard | Measured tR (min) | Calculated tR – measured tR (min) | |||
|---|---|---|---|---|---|
| Full back-calculationb | Only delay and t0 c | Only t0 d | No back-calculatione | ||
| N-methylacetamide | 0.728 | −0.005 | 0.040 | 0.321 | −0.026 |
|
| |||||
| N-ethylacetamide | 1.025 | 0.002 | 0.076 | 0.271 | −0.140 |
|
| |||||
| N,N-dimethylpropionamide | 2.071 | −0.002 | −0.025 | −0.289 | −0.788 |
|
| |||||
| benzamide | 2.428 | 0.003 | −0.044 | −0.329 | −0.870 |
|
| |||||
| N-methylbenzamide | 2.65 | 0.001 | −0.046 | −0.319 | −0.902 |
|
| |||||
| N-ethylbenzamide | 3.055 | −0.006 | −0.039 | −0.286 | −0.933 |
|
| |||||
| N-propylbenzamide | 3.499 | 0.003 | −0.005 | −0.244 | −0.924 |
|
| |||||
| N-butylbenzamide | 3.957 | 0.000 | 0.018 | −0.218 | −0.911 |
|
| |||||
| N-pentylbenzamide | 4.358 | −0.001 | 0.032 | −0.198 | −0.901 |
|
| |||||
| N-hexylbenzamide | 4.72 | 0.002 | 0.046 | −0.176 | −0.890 |
|
| |||||
| N-heptylbenzamide | 5.062 | −0.001 | 0.056 | −0.165 | −0.883 |
|
| |||||
| N-octylbenzamide | 5.384 | −0.001 | 0.064 | −0.149 | −0.876 |
|
| |||||
| N-nonylbenzamide | 5.697 | 0.001 | 0.068 | −0.148 | −0.875 |
|
| |||||
| N-decylbenzamide | 6.006 | 0.000 | 0.049 | −0.179 | −0.889 |
|
| |||||
| N-undecylbenzamide | 6.301 | 0.001 | 0.021 | −0.169 | −0.916 |
|
| |||||
| N-dodecylbenzamide | 6.612 | 0.001 | −0.014 | −0.119 | −0.967 |
|
| |||||
| N-tridecylbenzamide | 6.973 | −0.003 | −0.045 | −0.036 | −1.024 |
|
| |||||
| N-tetradecylbenzamide | 7.396 | 0.000 | −0.059 | 0.101 | −1.073 |
|
| |||||
| N-pentadecylbenzamide | 7.908 | 0.001 | −0.050 | 0.315 | −1.111 |
|
| |||||
| N-hexadecylbenzamide | 8.519 | −0.000 | −0.012 | 0.615 | −1.134 |
|
| |||||
| RMS error: | 0.002 | 0.045 | 0.26 | 0.89 | |
Retention times in a 5 min gradient from 5% to 95% B at 400 μL/min on instrument A.
Error in calculated retention times after the gradient and dead time profiles were fully back-calculated, i.e., the gradient was allowed to take on any shape in order to accommodate gradient dispersion and misproportioning.
Error in calculated retention times after only Vnon-mix and the dead time profile were allowed to change during back-calculation.
Error in calculated retention times after only the dead time profile was allowed to change during back-calculation, i.e., the gradient was assumed to be ideal.
Error in calculated retention times with no back-calculation at all. The gradient and dead time profiles were assumed to be ideal.
Figure 7.
Gradient and dead time profiles determined by different degrees of back-calculation. Each corresponds to those described in Table 1.
It may be unnecessary to use all 20 standards to back-calculate the gradient, but a significant number are necessary to obtain more detailed information about the shape of the gradient. For example, dispersion at the end of the gradient in Figure 7 could not be back-calculated if only a few standards were used. Having 20 standards in the test mixture also adds some redundancy, making it possible to back-calculate gradients even when the retention times of some standards cannot be found or are not useful. For example, if different initial and final solvent compositions are used, some standards may be almost completely unretained while others may be retained so much that they do not elute. Even then, the remaining standards may be enough to back-calculate the gradient. One might expect that the disadvantage of using so many standards is that it adds hassle for the user since they must record the retention time for each one. Indeed, when using an absorbance detector, it adds extra work, but when using an MS detector, the extra work is insignificant since the online software extracts the retention times of the standards automatically from the LC-MS data file.
3.3 Comparison of MYG and the Modified Conventional Procedure
3.3.1 Different Gradient Times, Flow Rates, and HPLC Instruments
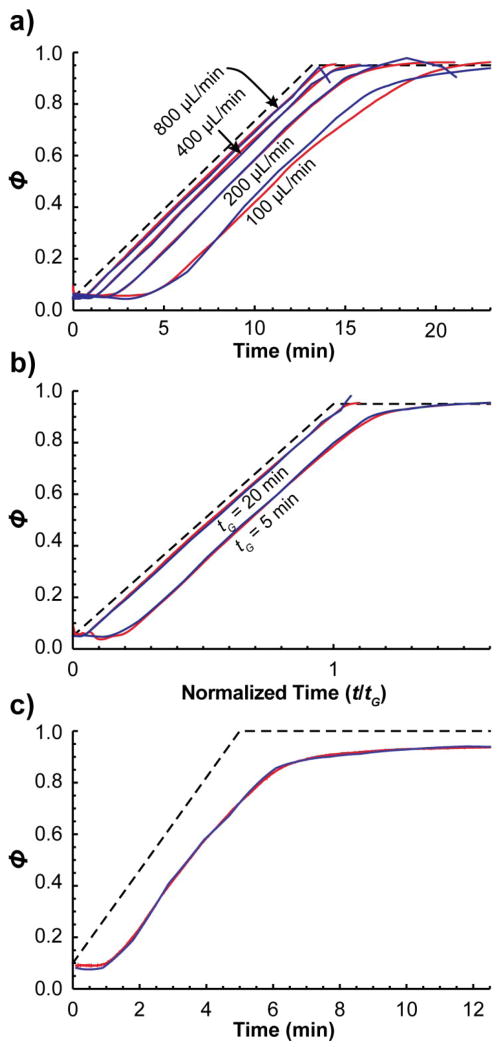
We found that gradients measured by MYG are comparable to those measured by the modified conventional procedure over a reasonable range of experimental conditions. Figure 8a shows gradients measured by each procedure under four different flow rates on instrument A. (Dead time profiles were omitted for brevity.) At the very end of the gradients measured by MYG, there are sometimes steep changes in slope. They should be ignored as they are an artifact caused by over-fitting the gradient to fit the retention time of the last standard. Other than that, the gradients are quite similar except in the case of the lowest flow rate (100 μL/min). There, the two profiles are similar at the beginning, but then the profile measured by MYG follows the slope of the ideal gradient a bit longer than the profile measured by the modified conventional procedure. It may be that the pump actually behaved differently in each case. The pump’s specifications state a minimum backpressure of 20 bar, but with the column in place, the backpressure dipped below 20 bar at the end of the gradient, potentially altering the gradient profile, though additional experiments would be required to confirm that this is truly what happened.
Figure 8.
Gradients measured by the MYG procedure (blue) and the modified conventional procedure (red) on a) instrument A in a 10 min gradient under four different flow rates, b) instrument A in a 5 min and 20 min gradient at 400 μL/min, and c) instrument B in a 5 min gradient at 200 μL/min. Dead time profiles are omitted for brevity.
The profiles were also similar when using different gradient lengths and on a different HPLC instrument. Figures 8b compares gradients that were 5 and 20 min long measured by the two procedures. Figure 8c shows a gradient measured on instrument B. This was the same gradient program as that shown in Figure 5, where the modified conventional procedure yielded a very different gradient than that measured by the conventional procedure. The gradient measured by MYG is nearly identical to that measured by the modified conventional procedure.
3.3.2 Different Column Dimensions and Stationary Phase Batches
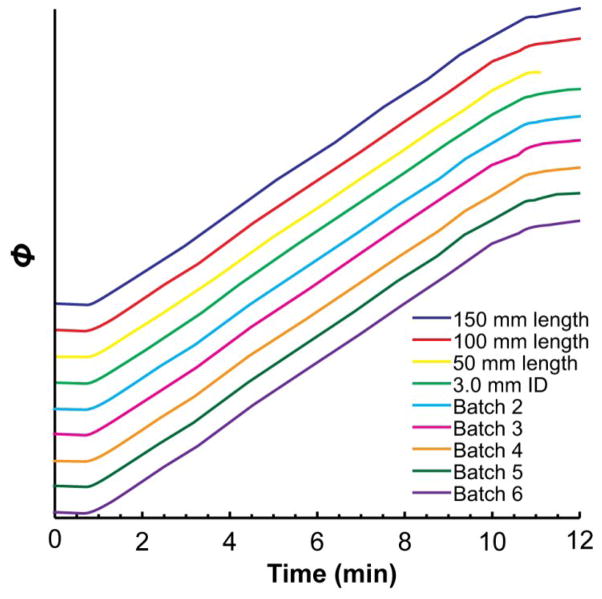
Currently, one must use the Eclipse Plus C18 stationary phase with 3.5 μm particles, but any column dimensions may be used. Figure 9 compares gradients measured by the MYG procedure with columns of different lengths (50 mm, 100 mm, and 150 mm) and inner diameters (2.1 mm, 3.0 mm). The gradients are virtually identical. A column with 4.6 mm inner diameter also worked, but it had to be run at a higher flow rate to keep the backpressure over the pump’s minimum required pressure (not shown).
Figure 9.
A 10 min, 400 μL/min gradient from 5% to 95% B, measured with three different column lengths, two different column inner diameters, and six different batches of the Eclipse Plus C18 stationary phase. The gradients are offset vertically from each other for clarity. Unless labeled otherwise, each column should be assumed to contain stationary phase from batch 1 with dimensions of 2.1 x 100 mm. Dead time profiles are omitted for brevity.
Since MYG measures the gradient chromatographically, we wondered if differences between batches of the Eclipse Plus C18 stationary phase would be enough to cause differences in the measured gradients. If the selectivity of the batches were different, or if they were more or less retentive, it would affect the shape of the back-calculated gradients. To test this, we measured the same gradient using six different batches of the Eclipse Plus C18 phase—some batches over a year old (Figure 9). Evidently, it made very little difference which batch was used – the gradients are hardly distinguishable from one another.
3.3.3 Measurement of Gradient Delay and Mixing Volume
One common use of the methodology will simply be to measure the total gradient delay volume. We found that the MYG procedure was actually a more precise way to measure the total gradient delay than the modified conventional approach. Table 2 shows the total gradient delay and the mixing volume measured under four different conditions by each procedure. The average gradient delay measured by the MYG procedure was 355 ± 13 μL while that measured under the first four conditions by the modified conventional approach was 330 ± 28 μL. Thus, the MYG approach measured total gradient delay with less than half the uncertainty.
Table 2.
Gradient Delay Volume Measured by Each Approach under Different Experimental Conditions on Instrument A
| Gradient Length (min) | Flow Rate (mL/min) | Stationary Phase Batch | Column Dimensions | Measured by MYG | Measured by Modified Conventional Procedure | ||
|---|---|---|---|---|---|---|---|
| Mixing Volume (mL) | Total Delay Volume (mL) | Mixing Volume (mL) | Total Delay Volume (mL) | ||||
| 5 | 0.4 | 2 | 2.1x100 mm | 0.158 | 0.364 | 0.066 | 0.341 |
| 10 | 0.4 | 2 | 2.1x100 mm | 0.095 | 0.356 | 0.070 | 0.360 |
| 10 | 0.1 | 2 | 2.1x100 mm | 0.161 | 0.36 | 0.073 | 0.295 |
| 10 | 0.2 | 2 | 2.1x100 mm | 0.105 | 0.355 | 0.086 | 0.322 |
| 10 | 0.4 | 1 | 2.1x150 mm | 0.045 | 0.338 | ||
| 10 | 0.4 | 1 | 2.1x100 mm | 0.087 | 0.359 | ||
| 10 | 0.4 | 1 | 2.1x50 mm | 0.08 | 0.373 | ||
| 10 | 0.4 | 1 | 3.0x100 mm | 0.068 | 0.344 | ||
| 10 | 0.4 | 3 | 2.1x100 mm | 0.055 | 0.331 | ||
| 10 | 0.4 | 4 | 2.1x100 mm | 0.092 | 0.366 | ||
| 10 | 0.4 | 5 | 2.1x100 mm | 0.095 | 0.368 | ||
| 10 | 0.4 | 6 | 2.1x100 mm | 0.057 | 0.345 | ||
|
| |||||||
| Average: | 0.092±0.037 | 0.355±0.013 | 0.074±0.009 | 0.329±0.028 | |||
Comparison of mixing volume measurements was more complicated, but first it is important to preface the comparison by noting that the mixing volume may not have direct physical significance since the model used to describe the gradient (a mixing and non-mixing volume in series) is only a very simple approximation of the true system. With that in mind, it appears that the modified conventional approach was more accurate due to its greater precision; while the MYG approach measured an average mixing volume of 91 ± 37 μL, the modified conventional approach measured an average of 74 ± 9 μL. However, a major part of the difference was caused by the fact that the conventional approach calculates mixing volume from only the very beginning of the gradient while the MYG procedure calculates it from the entire gradient. This is important because the instrument that was used for these comparisons (instrument A) showed more dispersion in the latter part of the gradient than in the first part. For example, when the conventional approach was used to calculate mixing volume in the 100 μL/min gradient, it gave 73 μL when measured from the first change in the gradient slope, but it gave 240 μL when measured from the second change in slope. On the other hand, the MYG procedure measured 160 μL mixing volume, which is close to the average of the two. Therefore, a better comparison of precision in the mixing volume measurement is made by considering only the set of nine runs in Table 2 that employed the same 10 min gradient at 0.4 mL/min. In this case, the MYG approach yielded a mixing volume with much better precision (75 ± 19 μL), but it was still twofold larger than that of the modified conventional approach.
3.4 Current Limitations of the MYG Methodology
Though MYG has a number of advantages over the conventional approach, it has some important limitations. Currently, the biggest two limitations are that the methodology requires use of the Eclipse Plus C18 stationary phase (3.5 um particles) and that it requires the mobile phases to be 0.1% formic acid in water and 0.1% formic acid in acetonitrile. We do not expect there is anything that would fundamentally limit the methodology from working with other stationary or mobile phases, but before it can be used under another set of conditions, the isocratic retention behavior of the standards would have to be measured under those conditions and entered into the source code of the MYG software. On the other hand, having to purchase an Eclipse Plus C18 column is a relatively small inconvenience when the alternative is the modified conventional approach.
Another limitation is that MYG cannot measure fine detail or high frequency components of the gradient. For example, incomplete mobile phase mixing, which would superimpose a relatively fast sinusoidal signal on the gradient, is undetectable, as are flow rate and pressure fluctuations. Thus, MYG and the conventional approach are complementary. When one is interested in relatively high frequency features or spurious changes in solvent composition, the conventional approach should be used. Otherwise, the MYG provides a more accurate overall picture of the gradient. For regular instrument performance qualification, some may find it easier to use the conventional approach, but we recommend running MYG at least once on each HPLC to get a feel for how the gradient it produces under real conditions compares with that measured by the conventional approach.
Even though MYG did not appear to be affected by use of columns over a year old, the stationary phase will eventually degrade to the point that it affects the accuracy of the back-calculated gradients. How can one know when their column has reached that point? There is currently no mechanism to detect an unsuitable column. However, in future versions of the methodology, we plan to add a set of chemically diverse test compounds into the mixture. Then, after a user back-calculates their gradient and dead time profiles, the software will attempt to calculate retention times for each of the test compounds. If error in the calculated retention times is under a certain threshold, it would indicate that the selectivity of the column is like that of a new one. We recently found that a similar strategy works well for gas chromatography [28].
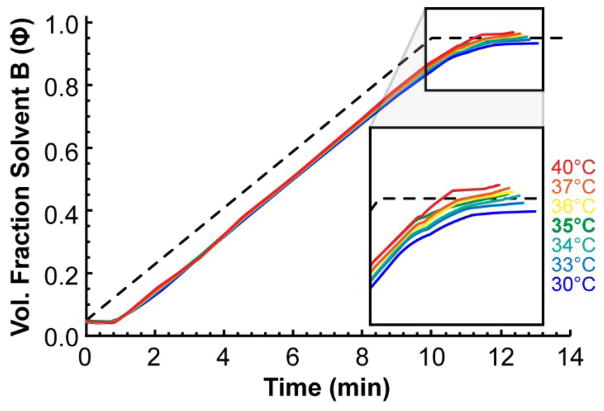
Finally, as it stands the MYG methodology does not properly take into account some of the more subtle factors affecting retention. For instance, if a column oven is incorrectly calibrated, the temperature error could erroneously alter the shape of the back-calculated gradient profile. Figure 10 shows gradients determined by MYG when the column oven was set to a range of temperatures between 30 and 40 °C to simulate a temperature calibration error. The temperature difference imparts a bias to the gradient that is strongest at the end. Temperatures warmer than 35 °C cause the gradient to be shifted upward to higher solvent compositions while cooler temperatures cause the gradient to be shifted downward to lower solvent compositions. Cooler temperatures also cause the gradient to appear more dispersed with a larger gradient delay volume and hotter temperatures cause the opposite bias. For example, at 40 °C, the gradient delay measured by MYG was 335 μL while at 30 °C the gradient delay was 398 μL. Fortunately, the effect is hardly noticeable if the temperature is kept between 34 and 36 °C. The measured gradient delay was virtually unaffected in this range as well: at 34 °C it was 368 μL and at 36 °C it was 354 μL, both being quite close to the value of 355 μL that was measured at 35 °C.
Figure 10.
A 10 min, 400 μL/min gradient from 5% to 95% B, measured by MYG when the temperature is set greater than and less than 35 °C in order to simulate a column oven calibration error. The gradients are mostly affected at the end, with hotter temperatures causing a bias toward higher solvent compositions and cooler temperatures causing a bias toward lower solvent composition. Dead time profiles are omitted for brevity.
Another subtle bias could be caused by heat generated within the column as mobile phase is forced through it (viscous frictional heating) [29–31]. Since different types of column ovens (i.e. adiabatic, forced air, water jacket, etc.) dissipate the frictionally generated heat to different extents, the back-calculated gradient could potentially be biased by the type of column oven used. In addition, the methodology does not account for the dependence of retention on pressure [32,33]. Fortunately, the effect of these factors seems to be small in this case as they did not appear to affect the gradients even when the column length was changed between 50 and 150 mm or when the flow rate was changed between 100 and 800 μL/min, both of which would have affected the amount of frictional heating and the pressure. Finally, the methodology currently does not account for distortion of the gradient caused by the preferential uptake of acetonitrile into the stationary phase [34–38] (also called “solvent demixing” [36]). This effect would be most pronounced in steep gradients, but it does not seem to have a significant effect in this work as all of the back-calculated profiles are quite similar to those measured by the modified conventional approach. Nonetheless, until it is taken into account, it would limit the MYG methodology from working under steeper gradients or step changes in solvent composition. Similarly, slow equilibration of the column to the changing mobile phase composition [16] may reduce its accuracy under very steep gradients.
4. Conclusions
The new Measure Your Gradient (MYG) methodology offers a number of advantages over the conventional approach. Most importantly, it provides a fast and easy way to measure gradients under precisely the same conditions as typical LC-MS reversed-phase runs (i.e. solvent A: 0.1% formic acid in water, solvent B: 0.1% formic acid in acetonitrile, the column left in place). Thus, it avoids bias caused by measurement under non-standard conditions (i.e. water in both solvents and no column). We also found that it measures total gradient delay volume with twice the precision of the conventional method, though it measures the portion of that delay volume that is mixing volume with half the precision.
It also provides a way for those with only an MS detector to measure their HPLC gradient. In fact, since only the retention times of the standards are needed, we expect that any type of detector should work so long as it can detect the 20 standards. An MS detector, however, is best, since it can pick out the retention times of each standard even when they overlap (such as in steep gradients). It is also the most efficient as the retention times of the 20 standards can be automatically extracted from the LC-MS data file using the online MYG software.
Another unique advantage of MYG is that it can be easily integrated into a user’s workflow and/or automated. The mobile phase solvents required for MYG are the same as those commonly used for LC-MS, so there is often no need to change solvents. Moreover, if one is using one of the standard stationary phases for their analyses (currently, the only standard phase is Eclipse Plus C18 with 3.5 μm particles), the same column could be used to measure the gradient that is used for analyses. In that case, the MYG standards could even be spiked into the sample beforehand, enabling the gradient to be measured at the same time as the sample is analyzed, requiring no additional analysis time to measure the gradient.
MYG also provides a practical way to compare chromatograms. The retention times of the 20 standards provide a critical piece of experimental information that is necessary to understand differences between chromatograms as they indicate how the HPLC actually behaved in each run. If the standards are spiked into the sample, that information is embedded directly into the chromatogram. If instead, the test mixture is run separately, the retention times of the standards could be paired with the chromatogram, along with the usual metadata (e.g. column dimensions, gradient program, flow rate, etc.), to better define the experimental conditions that were used when the chromatogram was collected. Those wishing to share chromatograms between labs, to compare chromatograms collected on different instruments, or to compare chromatograms collected over long periods of time, would benefit from spiking their samples with the MYG standards or running the MYG test mix contemporaneously and providing the retention times of the standards with their data.
In future work, we intend to further validate the methodology with more makes/models of HPLC instruments, including those with diaphragm pulse dampeners which would yield different gradients depending on the backpressure. We also plan to improve the methodology by accounting for temperature effects, frictional heating, pressure effects, and uptake of acetonitrile by the stationary phase. Step-by-step instructions for using MYG and the open-source software are available for free at www.measureyourgradient.org. The MYG test mix is also available on the site.
Supplementary Material
Highlights.
The usual approach to measure HPLC gradients yielded misleading results
A simple new approach was developed that yields more accurate gradients
The retention times of 20 standards are used to back-calculate the gradient
The methodology was accurate under a range of conditions
Software and instructions were made available online
Acknowledgments
We thank Peter W. Carr for helpful discussions, the National Institute of General Medical Sciences of the National Institutes of Health [R01GM098290], the Minnesota Agricultural Experiment Station, and we thank Agilent Technologies for generously donating the HPLC columns used in this work.
Footnotes
Contains retention time calculations, figures S-1, S-2, and S-3, and a demonstration of the effect of vacuum degassers on gradients measured by the conventional approach.
Publisher's Disclaimer: This is a PDF file of an unedited manuscript that has been accepted for publication. As a service to our customers we are providing this early version of the manuscript. The manuscript will undergo copyediting, typesetting, and review of the resulting proof before it is published in its final citable form. Please note that during the production process errors may be discovered which could affect the content, and all legal disclaimers that apply to the journal pertain.
Contributor Information
Megan H. Magee, Email: mage0112@umn.edu.
Joseph C. Manulik, Email: manu0059@umn.edu.
Brian B. Barnes, Email: bbbarnes@umn.edu.
Daniel Abate-Pella, Email: abate006@umn.edu.
Joshua T. Hewitt, Email: hewi0041@umn.edu.
References
- 1.Snyder LR, Dolan JW. High-Performance Gradient Elution: The Practical Application of the Linear-Solvent-Strength Model. John Wiley & Sons; 2007. [Google Scholar]
- 2.Quarry MA, Grob RL, Snyder LR. Measurement and use of retention data from high-performance gradient elution : Contributions from “non-ideal” gradient equipment. J Chromatogr A. 1984;285:1–18. [Google Scholar]
- 3.Snyder LR, Dolan JW. Reproducibility Problems in Gradient Elution Caused by Differing Equipment. LC GC. 1990;8:524–537. [Google Scholar]
- 4.Schellinger AP, Carr PW. A practical approach to transferring linear gradient elution methods. J Chromatogr A. 2005;1077:110–119. doi: 10.1016/j.chroma.2005.04.088. [DOI] [PubMed] [Google Scholar]
- 5.Dolan JW. Gradient Elution, Part IV: Dwell-Volume Problems. LC-GC N Am. 2013;31:456–463. [Google Scholar]
- 6.Taylor G. Dispersion of Soluble Matter in Solvent Flowing Slowly through a Tube. Proc R Soc Lond Ser Math Phys Sci. 1953;219:186–203. [Google Scholar]
- 7.Schmidtkunz C, Welsch T. The dwell volume. A hidden source of errors in gradient HPLC. GIT Spez Sep. 2008;28:46–49. [Google Scholar]
- 8.Hoff E. A biotechnology approach to assessing HPLC gradient performance. LC GC. 1989;7:320–326. [Google Scholar]
- 9.Dolan JW, Snyder LR. Maintaining fixed band spacing when changing column dimensions in gradient elution. J Chromatogr A. 1998;799:21–34. doi: 10.1016/s0021-9673(97)01045-5. [DOI] [PubMed] [Google Scholar]
- 10.Jandera P, Churáček J. J Chromatogr Libr. Elsevier; 1985. Chapter 8 Instrumentation for Production of Mobile Phase Gradients; pp. 185–242. [Google Scholar]
- 11.Dolan JW. Gradient elution separation problems. Part II. LC GC. 1987;5:466–470. [Google Scholar]
- 12.Dolan JW. Mobile phase proportioning problems. LC GC. 1988;8:572–576. [Google Scholar]
- 13.Dolan JW. Mobile phase proportioning problems; a case study. LC GC. 1989;7:18–24. [Google Scholar]
- 14.Culley T, Dolan JW. Mobile-phase proportioning problems and standard operating procedures. LC GC. 1995;13:456–458. [Google Scholar]
- 15.Gilroy JJ, Dolan JW. Gradient performance checks. LC GC Eur. 2004;17:566–572. [Google Scholar]
- 16.Pappa-Louisi A, Nikitas P, Agrafiotou P. Column equilibration effects in gradient elution in reversed-phase liquid chromatography. J Chromatogr A. 2006;1127:97–107. doi: 10.1016/j.chroma.2006.05.094. [DOI] [PubMed] [Google Scholar]
- 17.Neue UD, Marchand DH, Snyder LR. Peak compression in reversed-phase gradient elution. J Chromatogr A. 2006;1111:32–39. doi: 10.1016/j.chroma.2006.01.104. [DOI] [PubMed] [Google Scholar]
- 18.Schellinger AP, Carr PW. A practical approach to transferring linear gradient elution methods. J Chromatogr A. 2005;1077:110–119. doi: 10.1016/j.chroma.2005.04.088. [DOI] [PubMed] [Google Scholar]
- 19.Schellinger AP, Stoll DR, Carr PW. High speed gradient elution reversed-phase liquid chromatography. J Chromatogr A. 2005;1064:143–156. doi: 10.1016/j.chroma.2004.12.017. [DOI] [PubMed] [Google Scholar]
- 20.Schotten C. Ueber die Oxydation des Piperidins. Berichte Dtsch Chem Ges. 1884;17:2544–2547. [Google Scholar]
- 21.Baumann E. Ueber eine einfache Methode der Darstellung von Benzoësäureäthern. Berichte Dtsch Chem Ges. 1886;19:3218–3222. [Google Scholar]
- 22.Sharma A, Conway WD, Straubinger RM. Reversed-phase high-performance liquid chromatographic determination of taxol in mouse plasma. J Chromatogr B Biomed Sci App. 1994;655:315–319. doi: 10.1016/0378-4347(94)00117-0. [DOI] [PubMed] [Google Scholar]
- 23.Côté RG, Reisinger F, Martens L. jmzML, an open-source Java API for mzML, the PSI standard for MS data. Proteomics. 2010;10:1332–1335. doi: 10.1002/pmic.200900719. [DOI] [PubMed] [Google Scholar]
- 24.Griss J, Reisinger F, Hermjakob H, Vizcaíno JA. jmzReader: A Java parser library to process and visualize multiple text and XML-based mass spectrometry data formats. Proteomics. 2012;12:795–798. doi: 10.1002/pmic.201100578. [DOI] [PMC free article] [PubMed] [Google Scholar]
- 25.Schellinger AP, Stoll DR, Carr PW. High-speed gradient elution reversed-phase liquid chromatography of bases in buffered eluents: Part I. Retention repeatability and column re-equilibration. J Chromatogr A. 2008;1192:41–53. doi: 10.1016/j.chroma.2008.01.062. [DOI] [PMC free article] [PubMed] [Google Scholar]
- 26.Boswell PG, Schellenberg JR, Carr PW, Cohen JD, Hegeman AD. A study on retention “projection” as a supplementary means for compound identification by liquid chromatography-mass spectrometry capable of predicting retention with different gradients, flow rates, and instruments. J Chromatogr A. 2011;1218:6732–6741. doi: 10.1016/j.chroma.2011.07.105. [DOI] [PubMed] [Google Scholar]
- 27.Kessner D, Chambers M, Burke R, Agus D, Mallick P. ProteoWizard: open source software for rapid proteomics tools development. Bioinformatics. 2008;24:2534–2536. doi: 10.1093/bioinformatics/btn323. [DOI] [PMC free article] [PubMed] [Google Scholar]
- 28.Barnes BB, Wilson MB, Carr PW, Vitha MF, Broeckling CD, Heuberger AL, et al. “Retention Projection” Enables Reliable Use of Shared Gas Chromatographic Retention Data Across Laboratories, Instruments, and Methods. Anal Chem. 2013;85:11650–11657. doi: 10.1021/ac4033615. [DOI] [PMC free article] [PubMed] [Google Scholar]
- 29.Fallas MM, Hadley MR, McCalley DV. Practical assessment of frictional heating effects and thermostat design on the performance of conventional (3 μm and 5μm) columns in reversed-phase high-performance liquid chromatography. J Chromatogr A. 2009;1216:3961–3969. doi: 10.1016/j.chroma.2009.03.007. [DOI] [PubMed] [Google Scholar]
- 30.de Villiers A, Lauer H, Szucs R, Goodall S, Sandra P. Influence of frictional heating on temperature gradients in ultra-high-pressure liquid chromatography on 2.1 mm I.D. columns. J Chromatogr A. 2006;1113:84–91. doi: 10.1016/j.chroma.2006.01.120. [DOI] [PubMed] [Google Scholar]
- 31.Lin H, Horváth S. Viscous dissipation in packed beds. Chem Eng Sci. 1981;36:47–55. [Google Scholar]
- 32.McGuffin VL, Evans CE. Influence of pressure on solute retention in liquid chromatography. J Microcolumn Sep. 1991;3:513–520. [Google Scholar]
- 33.Guiochon G, Sepaniak MJ. Influence of pressure on solute retention in liquid chromatography. J Chromatogr A. 1992;606:248–250. [Google Scholar]
- 34.Gritti F, Guiochon G. The distortion of gradient profiles in reversed-phase liquid chromatography. J Chromatogr A. 2014;1340:50–58. doi: 10.1016/j.chroma.2014.03.004. [DOI] [PubMed] [Google Scholar]
- 35.Gritti F, Guiochon G. Calculated and experimental chromatograms for distorted gradients and non-linear solvation strength retention models. J Chromatogr A. 2014;1356:96–104. doi: 10.1016/j.chroma.2014.06.030. [DOI] [PubMed] [Google Scholar]
- 36.Quarry MA, Grob RL, Snyder LR. Measurement and use of retention data from high-performance gradient elution : Correction for “non-ideal” processes originating within the column. J Chromatogr A. 1984;285:19–51. [Google Scholar]
- 37.Wang M, Mallette J, Parcher JF. Interconversion of gradient and isocratic retention data in reversed-phase liquid chromatography: Effect of the uptake of eluent modifier on the retention of analytes. J Chromatogr A. 2009;1216:8630–8635. doi: 10.1016/j.chroma.2009.10.030. [DOI] [PubMed] [Google Scholar]
- 38.Martin M. On the Fundamental Retention Equation in Gradient Elution Liquid Chromatography. J Liq Chromatogr. 1988;11:1809–1826. [Google Scholar]
Associated Data
This section collects any data citations, data availability statements, or supplementary materials included in this article.


