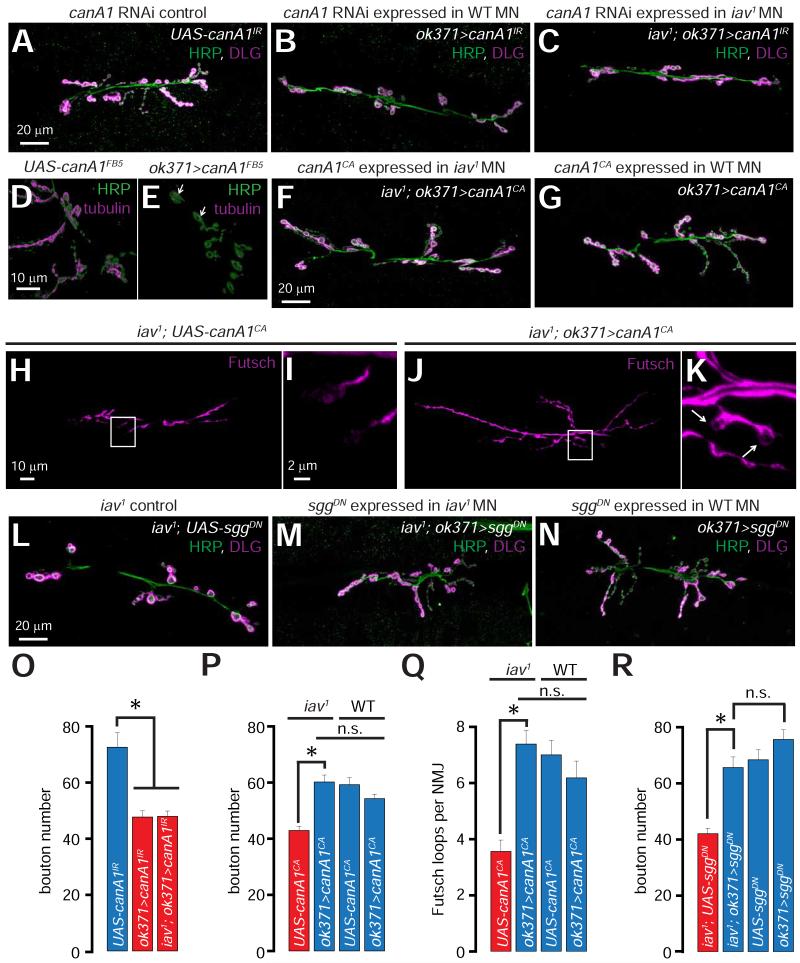
Figure 4. Role of calcineurin in the iav1 synaptic growth phenotype.
(A-C) Confocal images of NMJs from larvae of the indicated genotypes stained with antibodies against HRP (green) and DLG (magenta). Scale bar shown in (A) also applies to (B-C).
(D-E) 3-D reconstruction of synaptic boutons from larvae of the indicated genotypes stained with antibodies against HRP (green) and tubulin (magenta). Please note that only the microtubules within the NMJ boutons are shown by applying an “HRP mask” (see Experimental Procedures). Scale bar shown in (D) also applies to (E).
(F-G) Confocal images of NMJs from larvae of the indicated genotypes stained with antibodies against HRP (green) and DLG (magenta). Scale bar shown in (F) also applies to (G).
(H and J) Confocal images of NMJs from larvae of the indicated genotypes stained with antibodies against Futsch (magenta). Scale bar shown in (H) also applies to (J).
(I and K) Magnification of the boxed regions in (H) and (J) respectively. Scale bar shown in (I) also applies to (K). Arrows in (K) point to Futsch loops.
(L-N) Confocal images of NMJs from larvae of the indicated genotypes stained with antibodies against HRP (green) and DLG (magenta). Scale bar shown in (L) also applies to (M-N).
(O) Quantification of the NMJ bouton number in larvae of the indicated genotypes. *, p = 4.2×10⁻⁶, one-way ANOVA, n = 12-16 NMJs per genotype.
(P) Quantification of the NMJ bouton number in larvae of the indicated genotypes. Horizontal bars above the graph indicate data from WT and iav1. *, p = 2.9×10⁻⁶, unpaired Student’s t-test, n.s. represents p>0.05, n = 16-18 NMJs per genotype
(Q) Quantification of the number of Futsch loops per NMJ in larvae of the indicated genotypes. Horizontal bars above the graph indicate data from WT and iav1. *, p = 1.8×10⁻⁶, Student’s t-test, n.s. represents p>0.05, n = 13-16 NMJs per genotype.
(R) Quantification of the NMJ bouton number in larvae of the indicated genotypes. *, p = 1.4×10⁻⁶, Student’s t-test, n.s. represents p>0.05, n = 10-18 NMJs per genotype.
All values represent mean ±SEM. Abbreviations: MN, motor neuron; WT, wild-type; n.s., not significant.

