

Abstract
The sense of taste is often referred to as a ‘nutritional gatekeeper’, thought to have evolved to indicate energy sources and prevent ingestion of potential toxins. Fungiform papillae are structures on the anterior tongue in which taste buds are situated. They are concentrated at the tongue’s tip and they can provide a useful estimate of overall taste bud density for taste research. Some reports suggest taste perception may differ subtly across tongue regions, irrespective of FP number. Other data show an association between taste intensity perception for the bitter compound 6-n-propylthiouracil (PROP) and FP density. However, contradictions exist in the literature, with more recent, larger studies suggesting little or no association between FP number and perceived taste intensity. Much research has examined the relation between FP density and PROP perception, while other tastes have been less thoroughly studied. Here, in a cohort of mainly Caucasian individuals, aged 18-45, recruited from the campus of a large rural university, we examined regional and whole-mouth taste intensities, and FP density using an updated method of a digital still photography method first described in 2005. We found regional differences in suprathreshold intensity. Although all taste sensations were experienced all over the tongue, once again disproving the mythical tongue map, we also observed bitter and umami taste perception to be significantly greater on the posterior tongue than on the anterior tongue. In contrast, there were no regional differences observed for sweet, salty or sour tastes. The relation of FP density to whole-mouth intensity of 6-n-propylthiouracil, and to the intensity of saltiness of NaCl, sweetness from sucrose or from Acesulfame-K, bitterness of quinine, or burning from capsaicin delivered to different regions of the tongue are also discussed.
Keywords: Fungiform papilla (FP), spatial taste test, regional differences, bitter, umami, tongue map, Project GIANT-CS
Introduction
Taste buds are found on the tongue in three types of papillae: fungiform, foliate, and circumvallate (Hoon et al. 1999). Each bud consists of a bunched set of taste receptor cells and an apical taste pore, through which a trigeminal fiber, or gustatory hair, protrudes up through the epithelium, and comes into contact with tastants present in the mouth (Segovia et al. 2002). A fourth type of papillae, filiform papillae, are found on the tongue, but they do not contain taste cells. The fungiform papillae are found all over the anterior two-thirds of the tongue, and are most concentrated near the tip (Jung et al. 2004).
Due to their association with taste bud density (Miller and Reedy 1990), the measurement of fungiform papillae (FP) is often used to infer taste function, following numerous reports where FP density has been correlated with increased perception of sweet, salty and bitter tastes (e.g., (Miller and Reedy 1990)) and with the perception of fat (e.g. (Nachtsheim and Schlich 2013)). Indeed, taste thresholds may vary across the tongue (Collings 1974). Some work suggests that recognition for salt declines with age, and that in younger people, sensitivity to salt is greater on the tongue tip than the posterior region (Matsuda and Doty 1995). Whether this also applies to suprathreshold intensity is unclear. Multiple researchers have suggested umami perception is greater at the back than the front of the tongue (Yamaguchi and Ninomiya 1999). Less work has been done on other prototypical tastes but they are also thought to vary subtly in different tongue areas, at least in regard to thresholds (Collings, 1974). However, it should also be noted that thresholds and suprathreshold intensity are distinct phenotypes (e.g. (Hayes and Keast 2011; Keast and Roper 2007)) that may not generalize to each other.
Since taste buds are also innervated by trigeminal fibers (the fifth cranial nerve, CN V), FP density may be an important marker for lingual tactile acuity. This was demonstrated by Essick et al. (2003), who showed that those with more FP were able to distinguish between different shaped letters placed on the tongue. FP density has also been implicated in the liking of different bread textures (Bakke and Vickers 2007), and has putative influence in vegetable intake (e.g (Duffy et al. 2010; Feeney et al. 2014)). Given that FP density may be an important determinant of an individual’s perceived oral sensations from food, it is vital that researchers use standardized measurement techniques to facilitate comparison between studies.
Videomicroscopy is the original technique used to measure FP density in living subjects (Miller and Reedy 1990; Miller and Reedy 1990); previous research used cadaver tongues (Arvidson 1976; 1979). Videomicroscopy allows the experimenter to confirm the quality of the data in real time, which was not possible with film-based still photography. However, this method also has some drawbacks, which make it a less than ideal choice. Firstly, it requires expensive equipment that is not portable for field use. Additionally, each count is typically made by pausing the video image and counting papillae on an acetate overlay, which, in addition to being time-consuming, may not be completely replicable if the exact frame is not extracted from the video. More recently, digital still photography was introduced as an alternative to videomicroscopy (Shahbake et al. 2005). In their study, a 28mm2 area of the tongue was dyed with blue food coloring in order to distinguish the fungiform from the filiform papillae. The fungiform papillae do not absorb the blue dye to the same extent, allowing for their identification. The most relevant observations from the report of Shahbake et al., (2005) were that a) a digital camera could be used to assess the FP density and provide results comparable with videomicroscopy, and b) a 28 mm2 area of the tongue tip was representative of the density of the entire tongue. Since the publication of that method, the quality of digital still photography has greatly improved, so that greater magnification of images is possible. Further, computer software has progressed to allow the recorded images to be much more easily counted.
The goals of the present work were to examine in detail the perception of taste intensity, both whole-mouth (via a sip-and-spit method) and on different areas on the tongue (via a cotton-tipped swabs), for a range of stimuli in men and women, and to examine associations between FP density and perceived taste intensities.
Materials and Methods
Subjects
249 participants were recruited from the Penn State campus and surrounding community, from a pool of reportedly healthy, non-smoking adults aged 18-45 years with no known defects of taste or smell. Of those who completed session one, valid, complete data for the present analysis was available for 194 individuals (78 men); missing data were generally due to inability to reschedule appointments for individuals with unusable tongue photographs. The mean age of the men was 25.3 years (range 18 – 45), the mean weight was 173.6 lbs (range 93.2 – 260.2) and the mean BMI was 24.9 kg/m2 (range 21.2 – 39.6). The mean age of the women was 25.2 years (range 18 – 45), mean weight was 136.9 lbs (range 87 – 324.6) and the mean BMI was 22.7 kg/m2 (range 16 – 48.6). Of these individuals, n = 122 completed sessions 2, 3 and 4 (described below). FP counts were available for 100 of these participants (60 males). The Penn State Institutional Review Board approved all procedures, and all participants gave written, informed consent prior to the study. Participants were compensated for their time.
Photography
The researcher stained the front section of participants’ tongues using blue coloring on a clean cotton swab. The participant rested his or her chin on a table-mounted chin rest, and held their tongue between a specially-constructed apparatus. This consisted of two 25 mm × 77 mm plastic slides (VWR International), fastened together with a screw and bolt, and containing a 6mm diameter circle (Figure 1). 3-5 photographs were taken of the tongue in a flat plane. Photographs were taken with a Canon EOS Rebel T3i camera (Canon, USA). The camera was used in manual mode with the following settings : ISO 800, Aperture: 29 (F29), shutter speed: 1/200. The focus on the lens was set to automatic focus (AV). The procedure was carried out in a darkened interior room without windows or ambient light, using a macro ring light attachment, Canon MR-14 EX, which was set in ETTL mode at -1.
Figure 1.
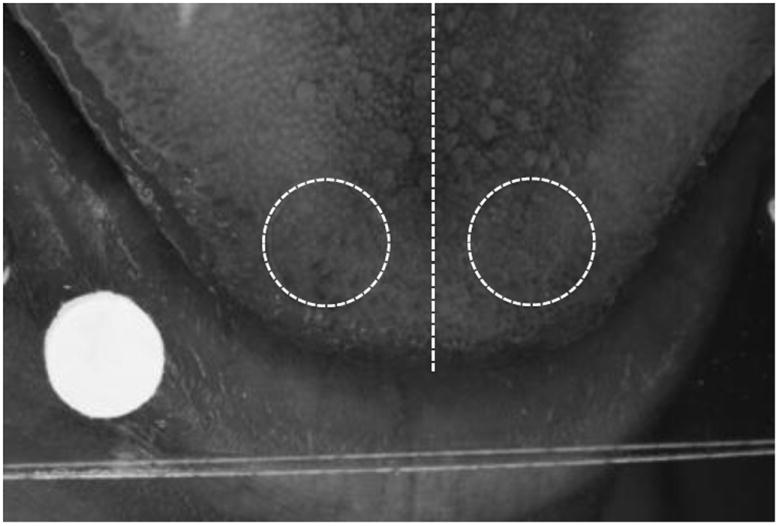
Image of blue-dyed tongue between two plastic slides and a paper circle for size indication. The approximate midline of the tongue is shown with the straight dashed white line. Two areas, 0.283 cm2, one from each side of the tongue midline, were used to count the FP number.
Counting fungiform papillae
Researchers were trained in the counting procedure prior to beginning counting, and counting was carried out blind; that is, neither the participant’s psychophysical ratings or genetic data were available to the researcher at the time of counting. Pictures were viewed in Adobe Photoshop CS5.1, extended version (Adobe, USA), and FP were counted as follows: the ‘select’ tool was used to select the white adhesive circle on the slide and this selection was moved to one of two areas - namely the left and right hand side at the tip of tongue. These areas were chosen since Shahbake et al. (2005) reported that measuring the density of FP in the small area near the tongue tip was a reliable predictor of total papillae. Here, two areas on the both the left and the right side of the tongue were counted for accuracy (Figure 1). The ‘count ’ tool was then used to count the FP within this circle (the larger pink areas which had not absorbed the blue food dye – very small structures were deemed to be filiform papillae). FP that were not completely inside the line of the circle were counted depending on where they fell within the circle. The circle was divided down the middle, and on one side of the circle only any FP that was contained more than 50% inside the line was counted. We did not apply any shape criteria in our counting protocol, although majority of the FP were round. The count tool in Photoshop allows counts to be stored in a ‘count group’ folder situated at the top of the screen. A second ‘count group’ folder was opened and the process repeated for second area (on the other side of the tongue). The resultant image of the counted areas, each containing the demarcated FP that were numbered during the count process, was saved as a separate “counted” file for future reference. A mean of the two counted areas was recorded. A total of three researchers counted the pictures, and each picture was counted separately by two different researchers. Both mean values (left and right for each researcher) were examined. Inter-rater correlations were measured using Spearmans’ Rho. There was good correlation between both FP counts, the rho values between the two sets of researchers were 0.78, p<0.001 (researchers 1 and 2) and 0.60, p<0.001 (researchers 2 and 3) at the two-tailed level. (Researchers 2 and 3 counted the majority of the FP, thus the Rho value is lower). The means of the two researcher’s independent counts were used in this analysis.
Study overview
Participants came to the test facility for 4 × 1 hour sessions, spaced a minimum of one week apart, as part of Project GIANT-CS phase I, a large study on genetics and oral sensation (e.g. (Allen et al. 2013; Byrnes and Hayes 2013; Feeney and Hayes 2014)). Each session was scheduled, where possible, for the same time of day and participants were asked to refrain from eating or drinking for 1 hour before testing.
Whole mouth Ratings
In the first session, participants were phenotyped for PROP taster status using standard methods, as described elsewhere (Dinehart et al. 2006; Hayes et al. 2008). In brief, 10 mL whole mouth solutions of salt (0.010 M, 0.032 M, 0.1 M, 0.32 M, and 1.0M) and five solutions of PROP (0.032mM, 0.1 mM, 0.32 mM, 1.0 mM and 3.2 mM) were tasted. Ratings were made on a generalized Labeled Magnitude Scale (gLMS). Participants also rated the intensity of 5 audio tones, 50, 60, 70 80 and 90 dB. One tone was played between each tastant, in balanced block order. The gLMS had a top anchor of ‘strongest sensation of any kind’, following a short training session and orientation (Hayes et al. 2013), using a range of 15 remembered and imagined sensations. Participants were also presented with 6 whole mouth samples, presented in a counterbalanced design. As previously described (Allen et al. 2013), stimuli were: 0.5 M sucrose (Spectrum); 25 mM acesulfame-K (Ace-K) (Spectrum), 0.56M potassium chloride (Spectrum), 0.41 mM quinine HCl (Sigma-Aldrich), a mixture of 200mM monosodium glutamate (MSG):100 mM inosine monophosphate (IMP) (Ajinomoto), and 25uM capsaicin. Tastants were made weekly and kept refrigerated, and allowed to come to room temperature before testing. Participants were instructed to swirl the entire sample in their mouth and then spit it out before making intensity ratings for sweetness, bitterness, salty, sourness, burning or stinging and umami/savory on a gLMS. There was a 30s interstimulus interval to rinse with 35°C (mouth temperature) RO water. Data were collected on a computer via Compusense five (Guelph, Ont., Canada).
Regional Ratings
In the remaining three sessions, regional taste intensities were measured. Suprathreshold ratings for the intensity of sweet, sour, salty, bitter and umami/savory using prototypical stimuli: sucrose (2.0 M), citric acid (112 mM), NaCl (1.12 M NaCl), quinine (2.0 mM) and a mixture of monosodium glutamate and inosine monophosphate (a mixture of 200 mM MSG and 100mM IMP), respectively. Intensity ratings were collected on four different areas of the tongue, at the front tip, left and right, and on the back circumvallate papillae, left and right (See Figure 4). The taste stimuli were presented on a cotton-tipped swab, which was dipped in the one of five taste solutions and rolled for 3 seconds over a small surface of the tongue on one of four areas in a consecutive manner. Tastants placed on these areas were presented in a balanced design over participants and sessions to minimize any order effects due to carryover or expectancies. There was a 30 second interstimulus interval for participant to rinse with water, and after this the next stimulus was presented on the next tongue region, so that the same region was never stimulated twice in a row, and allowed a minimum of a 180 second break before the area was stimulated again. The five stimuli were presented four times in each session, on different tongue regions, resulting in a total of three ratings for each stimulus at each region over the course of the three sessions. The mean of these was used to calculate intensity ratings at each region for each prototypical taste.
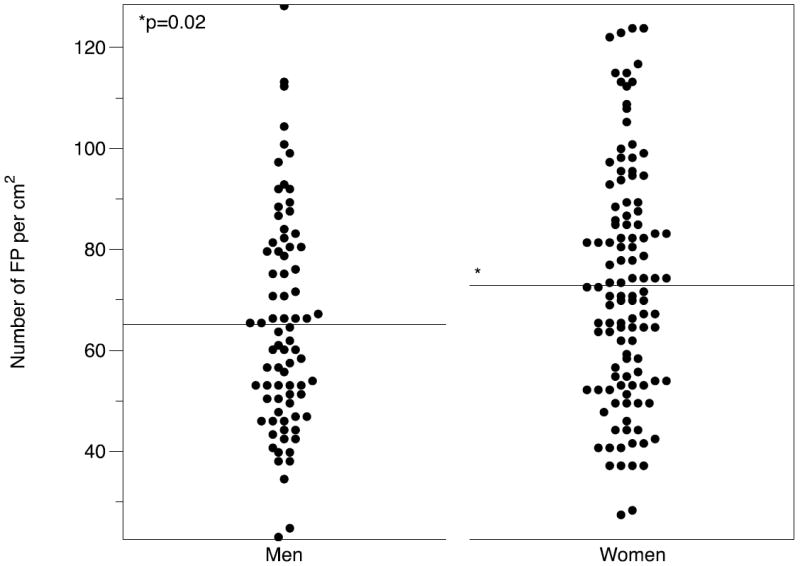
Figure 4.
Gender differences in FP density. Men had a significantly lower number of FP than women.
Statistical Analyses
Statistical analyses were performed using SPSS version 21 for Mac (Armonk, NY). Pearson’s correlation was used to examine the correlation between mean taste intensity ratings. Mean taste intensity ratings over the three different test sessions were calculated for each of the four individual tongue areas, and these were then averaged to obtain a “front” and “back” rating for each taste intensity. Pearson’s correlation was also used to examine the correlation between whole-mouth and regional taste intensity, and between these and FP number. Inter-rater correlations for FP numbers counted by different researchers were calculated using Spearman’s Rho. Students t-test was used to examine differences in FP number between men and women. A modified Pearson-Filon statistic, ZPF (Raghunathan et al. 1996) was used to examine differences between the correlations of ratings across days between different taste stimuli.
Results
Taste Intensity
Reliability of taste intensity ratings across replications
The range of Pearson’s correlation values for each taste in the four different spatial areas are shown in Table 1, averaged across the three replicates of each rating. There was no difference between men and women’s ratings on these four areas for the different taste stimuli (data not shown).
Table 1.
Pearson Correlation Ranges between replicates for each taste stimulus at each tongue region (from test sessions on three separate days, n=121)
| Taste Stimuli | Area | Correlation Ranges | p |
|---|---|---|---|
| Sweetness of Sucrose | Front Left | 0.65-0.78 | <0.001 |
| Front Right | 0.53-0.74 | <0.001 | |
| Back Left | 0.67-0.74 | <0.001 | |
| Back Right | 0.76–0.81 | <0.001 | |
| Sourness of Citric Acid | Front Left | 0.356-0.476 | <0.001 |
| Front Right | 0.405-0.617 | <0.001 | |
| Back Left | 0.315-0.604 | <0.001 | |
| Back Right | 0.542-0.602 | <0.001 | |
| Saltiness of NaCl | Front Left | 0.491-0.644 | <0.001 |
| Front Right | 0.612-0.70 | <0.001 | |
| Back Left | 0.514-0.554 | <0.001 | |
| Back Right | 0.46-0.63 | <0.001 | |
| Umami of MSG:IMP | Front Left | 0.38-0.56 | <0.001 |
| Front Right | 0.346-0.528 | <0.001 | |
| Back Left | 0.588-0.62 | <0.001 | |
| Back Right | 0.529-0.654 | <0.001 |
Replication correlations
Each taste stimulus was presented once on each area per visit, and replicated over three separate visits. The correlations between the three replications for each area for the intensity of each prototypical taste stimuli were examined. Replications over the three days were all significantly correlated (p<0.001 for all), demonstrating reliability of this method. Correlations were strongest for the ratings of the sweetness of sucrose (r ranged from 0.53 – 0.81, p<0.001), indicating that sweetness perception shows the least variability across days. To examine this further, Fisher z-score confidence intervals were calculated for each correlation, for the ratings between Days 2 and Day 4 (since these tests were spaced the furthest apart), and the correlation between the correlations was calculated for each, and the modified Pearson-Filon statistic, ZPF (Raghunathan et al. 1996) was used to determine whether these differences were significant. The correlation between sweet ratings on days 2 and 4 (r = 0.802) was significantly greater than the correlation between sour ratings (r =0.684), ZPF (121)=2.73, p = 0.006 and for umami (r = 0.626), ZPF (121)=3.12, p = 0.002. The difference between sweet (r = 0.802) and salty (r = 0.718) across days was also significant (ZPF = 2.13, p = 0.033). It should be noted that the latter comparison would no longer be significant if a Bonferroni adjustment was made for the large number of pairwise comparisons made. There was no difference between sweet and bitter on days 2 and 4, nor between any of the other correlations examined.
Regional intensity
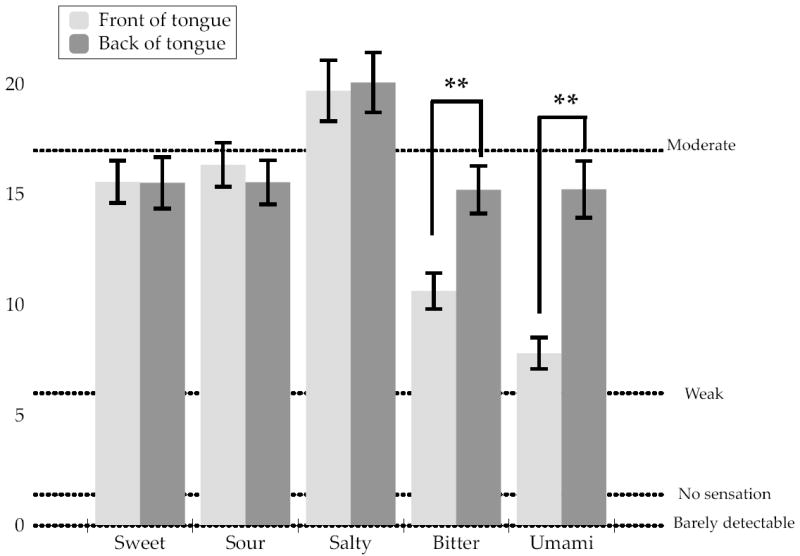
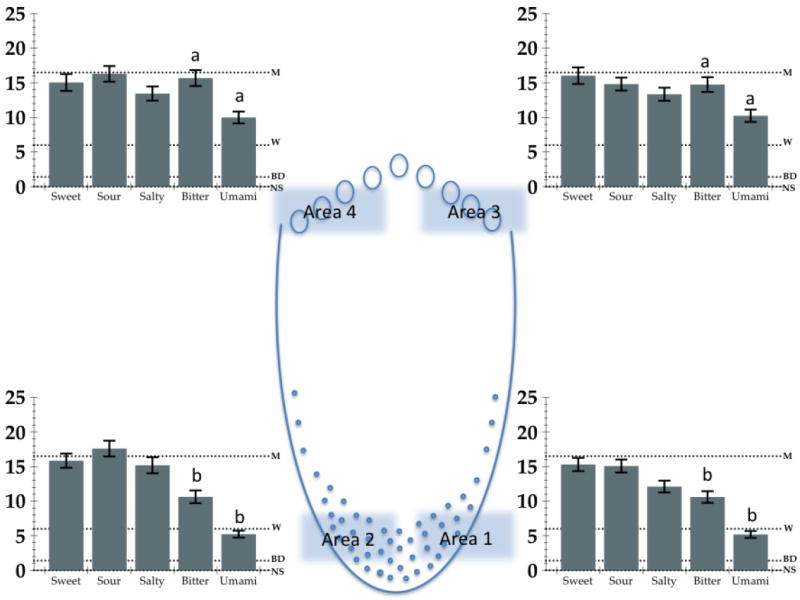
The regional intensity ratings for each taste stimulus at each of the four regions tested are shown in Figure 2. Rated intensity on the front and the back of the tongue did not differ significantly for sweet, salty or sour. Notably, ratings for bitter and umami were higher when the stimulating the back of the tongue than on the front (with the same tastant concentrations; Figure 3).
Figure 2.
Mean intensity ratings on the gLMS for sweet (2.0 M sucrose), sour (112 mM citric acid), salty (1.12 M NaCl), bitter (2mM quinine) and umami (50:50 mixture of 200mM monosodium glutamate and 100 mM inosine monophosphate). Solutions were swabbed on four areas of the tongue, front tip, left and right (Areas 1 and 2) and back circumvallate papillae, left and right (Areas 3 and 4). The graphs show the mean ratings for each taste on each of the four areas. Dotted lines depict gLMS labels; NS = no sensation, BD = barely detectable, W = weak, M = moderate.
Figure 3.
Mean intensity ratings on the front and the back of the tongue for sweet (2.0 M sucrose), sour (112 mM citric acid), salty (1.12 M NaCl), bitter (2mM quinine) and umami (50:50 mixture of 200mM monosodium glutamate and 100 mM inosine monophosphate). Dotted lines show the relative positions of the labeled descriptors on the gLMS. Significantly different mean values (p < 0.001) between the front and back areas for a taste are denoted with **.
Taste intensity perception ratings for taste stimuli (the mean for all four areas) were all strongly significantly correlated between stimuli, Pearson’s r ranged from 0.556 −0.872 (p<0.0001 for all taste stimuli) (Table 2). The lowest correlations were for umami and the other tastes, while the highest were for salt and sweet perception.
Table 2. Correlation co-efficients (r) between the different taste qualities - overall mean taste intensities (mean spatial ratings averaged within an individual over the four areas).
| Sweet | Sour | Salty | Bitter | Umami | |
|---|---|---|---|---|---|
| Sweet | - | 0.780** | 0.872** | 0.735** | 0.502** |
| Sour | - | 0.748** | 0.750** | 0.594** | |
| Salty | - | 0.705** | 0.472** | ||
| Bitter | - | 0.556** |
indicates that p<0.001.
Whole mouth vs regional intensity perception
Generally, there was good correlation of whole mouth versus regional intensity perception within a stimulus, although this decreased as the tastant concentrations were reduced (Table 3).
Table 3. Correlation of wholemouth taste intensity to regional taste intensity with different taste stimuli.
| Whole Mouth Salt (Day 1) | Front (1.12 M NaCl; days 2-4) | Back (1.12 M NaCl; days 2-4) | ||
|---|---|---|---|---|
| r | p | r | p | |
| 1.00 M NaCl | 0.472 | < 0.001 | 0.504 | < 0.001 |
| 0.32 M NaCl | 0.372, | < 0.001 | 0.346 | < 0.001 |
| 0.10 M NaCl | 0.337 | < 0.001 | 0.268 | 0.003 |
| 0.032 M NaCl | 0.255 | 0.005 | 0.158 | 0.082 |
| 0.01 M NaCl | 0.218 | 0.017 | 0.081 | 0.374 |
|
| ||||
| Whole Mouth (Day 1) | Front (2mM QHCl; days 2-4) | Back (2mM QHCl; days 2-4) | ||
|
| ||||
| r | p | r | p | |
|
| ||||
| 1mM Quinine | 0.454 | 0.001 | 0.533 | 0.001 |
|
| ||||
| Whole Mouth (Day 1) | Front (2.0 M Sucrose; days 2-4) | Back (2.0 M Sucrose; days 2-4) | ||
|
| ||||
| r | p | r | p | |
|
| ||||
| 0.5M Sucrose | 0.405 | < 0.001 | 0.486, | <0.001 |
|
| ||||
| Whole Mouth (Day 1) | Front (200mM MSG/100mM IMP; days 2-4) | Back (200mM MSG / 100mM IMP; days 2-4) | ||
|
| ||||
| r | p | r | p | |
|
| ||||
| 200mM MSG and 100mM IMP | 0.529 | <0.001 | 0.617 | <0.001 |
Fungiform Papillae Density
The FP number in this cohort ranged from 7 - 36 FP per 28.3 mm2 area. This approximates to a density of 23 – 123 FP per cm2. The mean FP density was 69.7, ± 22.6 S.D per cm2. The distribution of density per cm2 is shown in Figure 4. There was a small gender difference; men had a mean number of 65.12 per cm2, ± 2.42 S.E.M versus 72.8, S.E.M ± 2.14 per cm2 in women, (F = 5.49, 1, p = 0.02). There was no association between number of FP and participant age in this cohort (Figure 5).
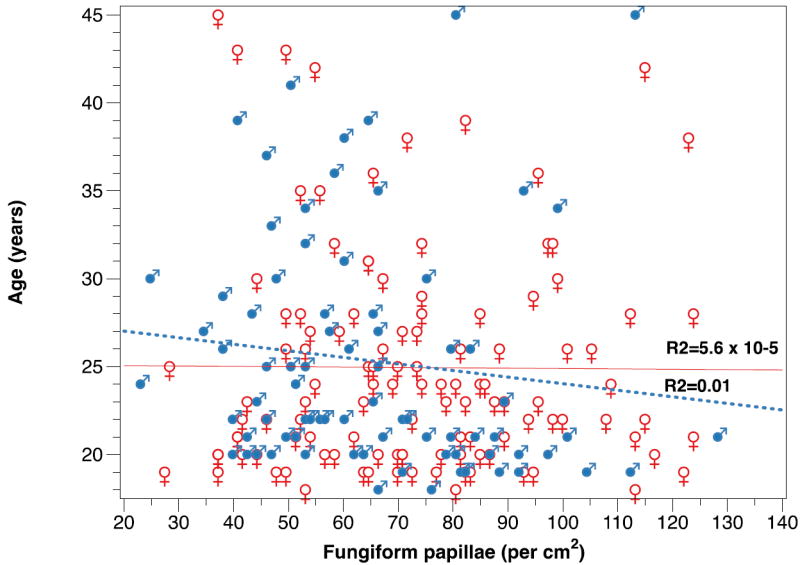
Figure 5.
FP across age in men (blue) and women (red). The regression line for men is denoted by the dotted line, the solid line denotes women. There was no association between age and FP in men or in women in this cohort.
FP and taste intensity
There was no correlation between FP density and PROP bitterness for any of the 5 PROP concentrations collected on day 1. In addition, FP number was not directly correlated with the intensity of other whole mouth taste stimuli from day 1 – sweetness from either sucrose or Ace-K, saltiness from KCl, bitterness from quinine, burning/stinging from capsaicin, nor the perception of umami from a mixture of MSG and IMP. Further, there was no correlation between FP density and overall taste intensity perception for the swabbed stimuli in any of the different regions.
The median number of FP per area was 18.8 (20.0 in women and 17.4 in men). This median FP count was then used as a basis for a cut-off for high and low FP (in a similar manner to Nachtsheim and Schlich (2013)), such that anyone with an FP of greater than 18.8 was categorized into “High FP”. We examined intensity perception in the high and low FP groups for a range of oral sensations: sweetness from sucrose and from Ace-K, bitterness from quinine and PROP, saltiness from NaCl and KCl, burning or stinging from capsaicin and the umami perception from IMP:MSG. This showed a trend in the expected direction generally, with slight differences when the group was examined by sex (Table 4). Because dichotomizing groups this way may cost power (Gelman and Park, 2009), we also examined this data in the highest and lowest FP quartiles (using the top and bottom 25%). The results from the data analyzed in this way did not reveal anything different from the median splits, thus we chose to report median splits to be comparable with other recent reports (e.g. (Nachtsheim and Schlich 2013)).
Table 4. Relation between fungiform papilla (FP) number and chemosensory sensations rated on the gLMS in men and women (Session 1).
| Oral Sensation | Men (n 78) | Women (n 116) | ||||||||
|---|---|---|---|---|---|---|---|---|---|---|
| Low FP | High FP | p | Low FP | High FP | p | |||||
|
|
||||||||||
| Mean | S.E. | Mean | S.E. | Mean | S.E. | Mean | S.E. | |||
|
| ||||||||||
| Umami (MSG and IMP) | 17.47 | 2.35 | 15.62 | 3.27 | 0.64 | 11.98 | 1.67 | 21.9 | 2.06 | 0.001 |
| Sweet (sucrose) | 29.9 | 2.25 | 27.8 | 2.99 | 0.575 | 26.9 | 1.56 | 29.9 | 1.78 | 0.028 |
| Salty (KCl) | 31.5 | 3.2 | 19.2 | 3.5 | 0.015 | 31.58 | 2.18 | 29.31 | 2.39 | 0.608 |
| Bitter (quinine) | 27.5 | 2.92 | 24.8 | 3.4 | 0.552 | 25.8 | 1.9 | 28.0 | 1.9 | 0.132 |
| Burning/Stinging (capsaicin) | 34.53 | 2.6 | 37.45 | 3.91 | 0.520 | 34.05 | 3.17 | 36.14 | 2.63 | 0.611 |
Discussion
Reliability of regional intensity ratings across days
There was significant correlation across the three replications between taste intensity ratings on the four different areas demonstrating good reliability across test sessions separated by a week or more, using the gLMS to rate intensity. Sweetness intensity was the most strongly correlated across repeated sessions.
Taste perception varies from front to back in a stimulus-dependent manner
Sweet, sour and salty tastes were equally intense across all four tested regions of the tongue, while bitter and umami intensity ratings were significantly higher at the back. Few previous reports list individual ratings in different tongue regions. Green and George (2004) previously examined taste perception in thermal tasters and nontasters (groups of people who perceive a taste when the tongue is rapidly re-warmed after being cooled – see Cruz and Green (2000)). A range of taste stimuli was tested for differences between the front tongue and back tongue. Although a significant effect of spatial area by taster group was not observed, they did report that “TTs showed a slight tendency to rate the weak taste of MSG as higher on the back tongue than did TnTS.” However, in that report, ratings for quinine, PROP and MSG all appear to be perceived as more intense at the back of the tongue than at the front for both TTs and TnTs. The present study has a much larger number of participants (n = 42 versus n = 100+) as well as having 3 replicates of each taste sensation at each spatial area. From the present data, which did not measure thermal taster status, individuals perceive bitter and umami more strongly on the back than on the front tongue. Further, Green and George (2004) did not ask “umami” specifically for MSG, as they felt that it would difficult for North American subjects to understand the concept of umami. Here, we specifically asked umami, and we explained to participants prior to tasting that umami described was a “savory” or “meaty” taste. We also noted a significant difference between front and back tongue for the perceived saltiness from the MSG:IMP mixture, even though there was no difference between front and back from perceived saltiness from NaCl. Whether this is due to “dumping” of umami into salt for those who may not have recognized the taste of umami from MSG, even with training, is not presently clear. Work in Asian populations familiar with umami suggest that the recognition at least is better at the back (Yamaguchi and Ninomiya 1999), which is likely due to a greater perception at the back. Since MSG elicits both salty and savory tastes, it is possible that the participants were experiencing an increased perception of salt. 5 different scales were provided, which should minimize dumping, nonetheless it cannot be ruled out. Further work is necessary to clarify this.
Regarding bitter taste perception, Collings (1974) also reported that the slope of the graph for the area stimulated and the intensity of the bitterness is significantly steeper at back of the tongue than the front. In other words, increasing concentrations of bitter compounds causes a greater increase in bitterness perception at the back than at the front on the tongue. The front and back regions of the tongue are innervated by different cranial nerves (the anterior tongue is innervated by cranial nerve VII, while the posterior third (approximately) is innervated by cranial nerve IX, the glossopharyngeal nerve. Thus, it is possible that the difference in taste perception could be due to differential innervation; however this would not explain why some (bitter and umami) but not all of the prototypical tastes are differentially perceived. Although one possibility is that here we used a high concentration of sucrose (2.0M), which could simply have saturated the sweet receptors, Green and George (2004) used a much lower (0.18M) sucrose concentration, and also observed no difference between front and back tongue ratings. Yamaguchi and Ninomiya (1999) reported a somewhat similar finding for the perception of umami for MSG, IMP and a mixture of both, whereby subjects were asked to rate their perception of each taste in different regions as none or uncertain, likely, fairly or absolutely. All three of these umami stimuli were perceived more with the most certainty on the circumvallate papillae. In Rhesus monkeys and in mice, umami responses are greater in the glossopharyngeal nerve (Ninomiya et al. 2000) (which innervates the posterior third of the tongue, where the CV papillae are located) than in the chorda tympani nerve (CN VII), which innervates the anterior 2/3, since the glossopharyngeal nerve has more MSG-sensitive fibers (Ninomiya et al. 2000). It is possible that some sort of common mechanism involved in bitter and umami signaling transduction is also greater on the posterior tongue, since it appears that multiple receptors may exist for umami (Chaudhari et al. 2009; Damak et al. 2003). Although speculative, it seems possible that a subset of these receptors may be more concentrated on the posterior tongue.
Other evidence suggests that the normally-functioning chorda tympani nerve may also inhibit nerve signaling within the oral cavity through central signaling inhibition (Bartoshuk et al. 2012), and that when this nerve is damaged (or when damage is simulated via anesthesia), sensations such burn from capsaicin and pain can be heightened (Lehman et al. 1995). Interestingly, work by Green and Schullery (2003) examined bitterness elicited by capsaicin and menthol in four regions of the tongue, and found that bitterness from both compounds was stronger at the back than at the front of the tongue. The burning sensation from capsaicin on the other hand, was higher at the front of the tongue, while cooling from menthol was perceived more strongly at the back. It has been suggested that tongue regions innervated by the glossopharengeal nerve might contain a greater number of receptor-gated ion channels such as those found in trigeminal ganglion cells (Green and Schullery 2003), which could possibly explain the difference observed here in umami perception, which is thought to have multiple receptors. However, this seems unlikely to explain the difference in bitter perception observed in this study, unless there are also multiple modes of bitterness transduction.
A greater perception of bitter and umami tastes at the back of the tongue is hard to explain from an evolutionary perspective. Bitterness is believed to signal potential toxins, and thus a stronger perception at the back of the mouth could be nature’s way of providing a final effort to identify poisonous substances before ingestion. Bitter taste is well-documented as an aversive taste which leads to ingestion avoidance, as demonstrated by the innate rejection response of bitterness in infants (Steiner, 1974), and by the large number of bitter taste receptor genes which have arisen through multiple gene duplication events to allow us to detect a wide range of potentially toxic substances at a very low levels (Meyerhof et al. 2010). In contrast, umami is not as well-documented as being aversive. Steiner (1987) reported that MSG alone is not preferred over water by infants, as judged by facial expression, although MSG did appear to be appetitive when added to soups. Beauchamp and colleagues (1979 unpublished work, cited in Beauchamp, 2009) noted that solutions of both MSG and casein hydrolysate (both of which elicit umami sensations) were rejected by infants relative to water. Some have suggested that umami is indicative of protein sources (Temussi 2009), although again studies in children have been mixed, with protein malnourished children preferring soup with added casein hydrolysate over regular soup, but not preferring soup with added MSG (Beauchamp 2009). Thus it is still unclear whether umami taste does indicate protein sources. It may also signal fermentation (Breslin 2013) since the quality is stronger in aged meats compared to fresh meats, and could be a cue to food that is no longer fresh. Why the prototypical tastes bitter and umami would be more protected from loss of signaling via nerve damage compared to sweet, sour and salty is unclear.
FP across age and gender
We found a small but significant gender difference in the number of FP, with women having significantly more FP than men, on average, 7 more per cm2. We did not observe a difference in FP across age. Although the age of the participants here was relatively narrow, this finding is in agreement with a recent assessment of FP number in children and adults (Correa et al. 2013). Correa and colleagues observed that FP number on the anterior tongue, as well as size and distribution, stabilizes by approximately age 11-12 although a gender difference in FP number was not observed in that study. Gender differences have generally been reported in adults rather than children e.g. (Duffy et al. 2004; Prutkin et al. 2000) – in the study by Correa and colleagues, 21 of the 30 adults tested were female, which may have accounted for this, since many of the children tested were younger than 12, so their FP would not be expected to have stabilized yet. Notably, none of these studies attempt to control for tongue size, oral cavity volume or body size. Accordingly, such sex differences may be artifacts due to body size; future work should explore this possibility.
FP and taste intensity were not correlated
The finding that PROP bitterness was not correlated with FP density here was surprising initially, since it is often reported that number of FP associates with perceived taste intensity, (e.g. (Bajec and Pickering 2008; Correa et al. 2013; Zuniga et al. 1993); although not all studies have shown this correlation (Fischer et al. 2013; Garneau and Derr 2013)). In 83 individuals, Duffy et al. (2004) reported FP number was correlated with intensity of 6-n-propylthiouracil but not with whole-mouth citric acid or NaCl intensity. Duffy’s group also measured chorda tympani nerve (CTN) function, via a ratio of average taste intensity of all tastes applied directly to areas on the tongue to the whole-mouth taste intensity of the same taste qualities. No correlation was observed between CTN function and FP number. Other groups have observed an association with FP and taste intensity, for some taste sensations, but the results are often mixed. In a small pilot study of 16 individuals (12 men) Miller and Reedy (1990) reported sucrose, salt and PROP intensity were all higher in those with a greater number of FP, but no relationship was observed with the intensity of quinine or citric acid. In agreement with that citric acid finding, Zuniga et al. (1993) found no correlation with whole mouth citric acid intensity and FP in 84 subjects, although spatially-matched detection threshold was correlated with FP. Tepper and Nurse (1997) counted FP in relation to PROP bitterness and observed that number of FP differed significantly between PROP taster groups, although a direct correlation was not reported in that publication. Later, Prutkin et al. (2000) observed a correlation between FP density and taste intensity in women (n=71), but not in men (n=51). Delwiche et al. (2001), in 16 individuals, counted the FP in five circles of increasing area, and found that number of FP correlated to PROP intensity in three of these areas, but no relationship was observed for two, the largest and the smallest areas. They noted that the association between FP and taste intensity was ‘highly variable’ and only observed in those sensitive to PROP (i.e. tasters), while the number of FP did not appear to be associated with quinine intensity.
More recently, larger studies of FP and taste intensity have been carried out. Hayes et al. (2008) examined FP and PROP bitterness in a cohort of 198 individuals, reporting a small but significant semipart correlation (sr = 0.17, p = 0.027) between FP and the intensity of 3.2mM PROP. Notably, when examined in the different TAS2R38 genotype groups, the correlation remained significant only for homozygotes, but not heterozygotes. A later study by Duffy et al. (2010) in 59 adults reported an r value of 0.27, p <0.05 between FP and PROP bitterness. Nachtsheim and Schlich (2013) report a similar correlation of 0.2 between bitterness of 3.2 mM PROP and number of FP, in 116 subjects, although they found no difference in FP between the three different PROP taster groups. The largest study to date is the Beaver Dam Offspring Study, where taste intensity perception and FP density was measured in over 2000 individuals, male and female, across all age ranges (Fischer et al. 2013). In that study, no association was observed between FP number and the intensity of sweetness of sucrose, bitterness of PROP and of quinine, or the sourness from citric acid. Unusually, a small, inverse relation was noted between salt intensity and FP number, with those who had fewer FP perceiving it as more intense. Recently emerging data from another epidemiologically-sized study at the Denver Museum of Nature and Science, using similar methodology to that used in the present report, and to that used in the Beaver Dam Offspring Study, also failed to find an association between FP number and PROP intensity perception (Garneau and Derr 2013).
In summary, a substantial number of reports (albeit in smaller cohorts than the sample examined here) suggest that FP and taste intensity are linked. However, a variety of methods were used, and some of those studies used areas of the tongue that were later shown not to give the best estimate of overall papillae (Correa et al. 2013; Shahbake et al. 2005). More recently, independent data from larger cohorts agree with the work presented here. We added to this body of work by investigating taste intensity for a range of other prototypical taste stimuli, for both whole-mouth taste intensity, and regional intensity. We did not find evidence for a strong association between FP number and taste intensity, suggesting that FP density may have limited utility as a marker of taste intensity perception in large samples.
One limitation of the present study that must be noted is that participants in our cohort were not screened for otitis media (Bartoshuk et al. 1996; Peracchio et al. 2012), which can damage the chorda tympani nerve and decouple taste phenotype from measures of oral anatomy; nor did we have information on medication or alcohol intake. It is possible that the previously reported FP–intensity relationships may be stronger when examining only those without a history of ear infections. However, we believe that it is unlikely that the lower ratings on the front of the tongue are due to a lower perception from chorda tympani damage, as the differences observed are limited to only two of the taste qualities examined here.
Summary and Conclusions
The intensities of the different tastes were all highly correlated, and taste perception was stable across different test days, with sweet ratings being the most consistent. Whole mouth taste intensity perception was correlated with regional intensity perception of the same stimuli. Bitter and umami tastes were more strongly perceived on the circumvallate regions than on the fungiform regions of the tongue, while sweet, sour and salty were perceived at similar intensities in both regions. The reason for this is unclear, and further work is needed to verify this finding and to determine the underlying cause of these differences. The present study failed to confirm the association between FP number and the intensity of whole mouth taste sensations reported previously in smaller studies. Nor did this appear to be a function of the region stimulated, as the intensity of taste solutions delivered to small regions of the tongue using a cotton-tipped swab did not associate with FP number. Considering the large variation in taste pore density within the FP, it is not surprising that FP is not strongly correlated to taste intensity. Previously reported associations between taste intensity and FP number may have over-estimated the relation between FP number and taste intensity, due to the use of small sample sizes, the use of different areas of the tongue and differing methods to visualize FP.
Acknowledgments
The authors would also like to Alissa L. Allen and Amanda Hofstaedter for counting papillae, Alissa L. Allen, Nadia K. Byrnes, and Meghan Kane for psychophysical data collection, and Samantha M. Bennett for assistance with protocol development. We also thank our study participants for their time and participation.
Funding
This work was supported by funds from Pennsylvania State University, United States Department of Agriculture Hatch Project PEN04332 funds, and a National Institutes of Health grant from the National Institute National of Deafness and Communication Disorders [DC010904].
Footnotes
Compliance with Ethics Requirements
All procedures followed were in accordance with the ethical standards of the responsible committee on human experimentation (institutional and national) and with the Helsinki Declaration of 1975, as revised in 2008. Informed consent was obtained from all participants included in the study.
Conflict of Interest Disclosures
Dr. Emma L. Feeney declares she has no conflict of interest. Dr. John E. Hayes has previously accepted speaking and/or consulting fees from Tate & Lyle PLC, Symrise AG, Pepisco, and General Mills, Inc. for unrelated work. He has also served on the Scientific Advisory Board of Medifast, Inc. His laboratory conducts routine taste tests for industrial clients to facilitate practical student training. None of these organizations have had any influence over study conception, design or interpretation, or the decision to publish these data.
References
- Allen AL, McGeary JE, Knopik VS, Hayes JE. Bitterness of the Non-nutritive Sweetener Acesulfame Potassium Varies With Polymorphisms in TAS2R9 and TAS2R31. Chemical Senses. 2013;38(5):379–89. doi: 10.1093/chemse/bjt017. [DOI] [PMC free article] [PubMed] [Google Scholar]
- Arvidson K. Scanning electron microscopy of fungiform papillae on the tongue of man and monkey. Acta Otolaryngol. 1976;81(5-6):496–502. doi: 10.3109/00016487609107506. [DOI] [PubMed] [Google Scholar]
- Arvidson K. Location and Variation in Number of Taste-Buds in Human Fungiform Papillae. Scandinavian Journal of Dental Research. 1979;87(6):435–442. doi: 10.1111/j.1600-0722.1979.tb00705.x. [DOI] [PubMed] [Google Scholar]
- Bajec M, Pickering G. Thermal taste, PROP responsiveness, and perception of oral sensations. Physiology & Behavior. 2008;95(4):581–590. doi: 10.1016/j.physbeh.2008.08.009. [DOI] [PubMed] [Google Scholar]
- Bakke A, Vickers Z. Consumer liking of refined and whole wheat breads. J Food Sci. 2007;72(7):S473–80. doi: 10.1111/j.1750-3841.2007.00440.x. [DOI] [PubMed] [Google Scholar]
- Bartoshuk LM, Catalanotto F, Hoffman H, Logan H, Snyder DJ. Taste damage (otitis media, tonsillectomy and head and neck cancer), oral sensations and BMI. Physiology & Behavior. 2012;107(4):516–526. doi: 10.1016/j.physbeh.2012.06.013. [DOI] [PubMed] [Google Scholar]
- Bartoshuk LM, Duffy VB, Reed D, Williams A. Supertasting, earaches and head injury: Genetics and pathology alter our taste worlds. Neuroscience & Biobehavioral Reviews. 1996;20(1):79–87. doi: 10.1016/0149-7634(95)00042-d. [DOI] [PubMed] [Google Scholar]
- Beauchamp GK. Sensory and receptor responses to umami: an overview of pioneering work. Am J Clin Nutr. 2009;90(3):723S–727S. doi: 10.3945/ajcn.2009.27462E. [DOI] [PubMed] [Google Scholar]
- Breslin PAS. An Evolutionary Perspective on Food and Human Taste. Current Biology. 2013;23(9):R409–R418. doi: 10.1016/j.cub.2013.04.010. [DOI] [PMC free article] [PubMed] [Google Scholar]
- Byrnes NK, Hayes JE. Personality factors predict spicy food liking and intake. Food Qual Prefer. 2013;28(1):213–221. doi: 10.1016/j.foodqual.2012.09.008. [DOI] [PMC free article] [PubMed] [Google Scholar]
- Chaudhari N, Pereira E, Roper SD. Taste receptors for umami: the case for multiple receptors. American Journal of Clinical Nutrition. 2009;90(3):738S–742S. doi: 10.3945/ajcn.2009.27462H. [DOI] [PMC free article] [PubMed] [Google Scholar]
- Collings VB. Human Taste Response as a Function of Locus of Stimulation on Tongue and Soft Palate. Perception & Psychophysics. 1974;16(1):169–174. [Google Scholar]
- Correa M, Hutchinson I, Laing DG, Jinks AL. Changes in fungiform papillae density during development in humans. Chem Senses. 2013;38(6):519–27. doi: 10.1093/chemse/bjt022. [DOI] [PubMed] [Google Scholar]
- Cruz A, Green BG. Thermal stimulation of taste. Nature. 2000;403(6772):889–92. doi: 10.1038/35002581. [DOI] [PubMed] [Google Scholar]
- Damak S, Rong MQ, Yasumatsu K, Kokrashvili Z, Varadarajan V, Zou SY, Jiang PH, Ninomiya Y, Margolskee RF. Detection of sweet and umami taste in the absence of taste receptor T1r3. Science. 2003;301(5634):850–853. doi: 10.1126/science.1087155. [DOI] [PubMed] [Google Scholar]
- Delwiche JF, Buletic Z, Breslin PAS. Relationship of papillae number to bitter intensity of quinine and PROP within and between individuals. Physiology & Behavior. 2001;74(3):329–337. doi: 10.1016/s0031-9384(01)00568-6. [DOI] [PubMed] [Google Scholar]
- Dinehart ME, Hayes JE, Bartoshuk LM, Lanier SL, Duffy VB. Bitter taste markers explain variability in vegetable sweetness, bitterness, and intake. Physiol Behav. 2006;87(2):304–13. doi: 10.1016/j.physbeh.2005.10.018. [DOI] [PubMed] [Google Scholar]
- Duffy VB, Hayes JE, Davidson AC, Kidd JR, Kidd KK, Bartoshuk LM. Vegetable Intake in College-Aged Adults Is Explained by Oral Sensory Phenotypes and TAS2R38 Genotype. Chemosensory Perception. 2010;3(3-4):137–148. doi: 10.1007/s12078-010-9079-8. [DOI] [PMC free article] [PubMed] [Google Scholar]
- Duffy VB, Peterson JM, Bartoshuk LM. Associations between taste genetics, oral sensation and alcohol intake. Physiology & Behavior. 2004;82(2-3):435–45. doi: 10.1016/j.physbeh.2004.04.060. [DOI] [PubMed] [Google Scholar]
- Essick GK, Chopra A, Guest S, McGlone F. Lingual tactile acuity, taste perception, and the density and diameter of fungiform papillae in female subjects. Physiology & Behavior. 2003;80(2-3):289–302. doi: 10.1016/j.physbeh.2003.08.007. [DOI] [PubMed] [Google Scholar]
- Feeney EL, Hayes JE. Exploring associations between taste perception, oral anatomy and polymorphisms in the carbonic anhydrase (gustin) gene CA6. Physiol Behav. 2014 doi: 10.1016/j.physbeh.2014.02.013. [DOI] [PMC free article] [PubMed] [Google Scholar]
- Feeney EL, O’Brien SA, Scannell AGM, Markey A, Gibney ER. Genetic and environmental influences on liking and reported intakes of vegetables in Irish children. Food Quality and Preference. 2014;32(Part C(0)):253–263. [Google Scholar]
- Fischer ME, Cruickshanks KJ, Schubert CR, Pinto A, Klein R, Pankratz N, Pankow JS, Huang G-H. Factors Related to Fungiform Papillae Density: The Beaver Dam Offspring Study. Chemical Senses. 2013 doi: 10.1093/chemse/bjt033. [DOI] [PMC free article] [PubMed] [Google Scholar]
- Garneau NL, Derr T. Statistical Analysis of Factors Previously Described as Significant in the Ability to Taste Propylthiouracil Yields Roles for Age, Sex, and TAS2R38 Haplotype, but not Fungiform Papillae Density. AChems. 2013;XXXV:P235. [Google Scholar]
- Green BG, George P. ‘Thermal taste’ predicts higher responsiveness to chemical taste and flavor. Chemical Senses. 2004;29(7):617–628. doi: 10.1093/chemse/bjh065. [DOI] [PubMed] [Google Scholar]
- Green BG, Schullery MT. Stimulation of bitterness by capsaicin and menthol: Differences between lingual areas innervated by the glossopharyngeal and chorda tympani nerves. Chemical Senses. 2003;28(1):45–55. doi: 10.1093/chemse/28.1.45. [DOI] [PubMed] [Google Scholar]
- Hayes JE, Allen AL, Bennett SM. Direct comparison of the generalized Visual Analog Scale (gVAS) and general Labeled Magnitude Scale (gLMS) Food Qual Prefer. 2013;28(1):36–44. doi: 10.1016/j.foodqual.2012.07.012. [DOI] [PMC free article] [PubMed] [Google Scholar]
- Hayes JE, Bartoshuk LM, Kidd JK, Duffy VB. Supertasting and PROP Bitterness Depends on More Than the TAS2R38 Gene. Chem Senses. 2008;33(3):255–265. doi: 10.1093/chemse/bjm084. Epub 21 January 2008. [DOI] [PubMed] [Google Scholar]
- Hayes JE, Keast RSJ. Two decades of supertasting: where do we stand? Physiology & Behavior. 2011;104(5):1072–4. doi: 10.1016/j.physbeh.2011.08.003. [DOI] [PMC free article] [PubMed] [Google Scholar]
- Hoon MA, Adkler E, Lindemeier J, Battery JF, Ryba NY, Zuker CS. Putative mammalian taste receptors: a class of taste-specific GPCRs with distinct topographic selectivity. Cell. 1999;96(4):541–51. doi: 10.1016/s0092-8674(00)80658-3. [DOI] [PubMed] [Google Scholar]
- Jung HS, Akita K, Kim JY. Spacing patterns on tongue surface-gustatory papilla. International Journal of Developmental Biology. 2004;48(2-3):157–161. doi: 10.1387/ijdb.15272380. [DOI] [PubMed] [Google Scholar]
- Keast RS, Roper J. A complex relationship among chemical concentration, detection threshold, and suprathreshold intensity of bitter compounds. Chem Senses. 2007;32(3):245–53. doi: 10.1093/chemse/bjl052. [DOI] [PubMed] [Google Scholar]
- Lehman CD, Bartoshuk LM, Catalanotto FC, Kveton JF, Lowlicht RA. Effect of Anesthesia of the Chorda Tympani Nerve on Taste Perception in Humans. Physiology & Behavior. 1995;57(5):943–951. doi: 10.1016/0031-9384(95)91121-r. [DOI] [PubMed] [Google Scholar]
- Matsuda T, Doty RL. Regional taste sensitivity to NaCl: relationship to subject age, tongue locus and area of stimulation. Chem Senses. 1995;20(3):283–90. doi: 10.1093/chemse/20.3.283. [DOI] [PubMed] [Google Scholar]
- Meyerhof W, Batram C, Kuhn C, Brockhoff A, Chudoba E, Bufe B, Appendino G, Behrens M. The molecular receptive ranges of human TAS2R bitter taste receptors. Chem Senses. 2010;35(2):157–70. doi: 10.1093/chemse/bjp092. [DOI] [PubMed] [Google Scholar]
- Miller IJ, Reedy FE. Quantification of fungiform papillae and taste pores in living human subjects. Chemical Senses. 1990;15(3):281–294. [Google Scholar]
- Miller IJ, Reedy FE. Variations in human taste bud density and taste intensity perception. Physiology & Behavior. 1990;47(6):1213–1219. doi: 10.1016/0031-9384(90)90374-d. [DOI] [PubMed] [Google Scholar]
- Nachtsheim R, Schlich E. The influence of 6-n-propylthiouracil bitterness, fungiform papilla count and saliva flow on the perception of pressure and fat. Food Quality and Preference. 2013;29(2):137–145. [Google Scholar]
- Ninomiya Y, Nakashima K, Fukuda A, Nishino H, Sugimura T, Hino A, Danilova V, Hellekant G. Responses to umami substances in taste bud cells innervated by the chorda tympani and glossopharyngeal nerves. J Nutr. 2000;130(4S Suppl):950S–3S. doi: 10.1093/jn/130.4.950S. [DOI] [PubMed] [Google Scholar]
- Peracchio HL, Henebery KE, Sharafi M, Hayes JE, Duffy VB. Otitis media exposure associates with dietary preference and adiposity: A community-based observational study of at-risk preschoolers. Physiology & Behavior. 2012;106(2):264–271. doi: 10.1016/j.physbeh.2012.01.021. [DOI] [PubMed] [Google Scholar]
- Prutkin J, Duffy V, Etter L, Fast K, Gardner E, Lucchina L, Snyder D, Tiea K, Weiffenbach J, Bartoshuk L. Genetic variation and inferences about perceived taste intensity in mice and men. Physiology & Behavior. 2000;69:161–173. doi: 10.1016/s0031-9384(00)00199-2. [DOI] [PubMed] [Google Scholar]
- Raghunathan TE, Rosenthal R, Rubin DB. Comparing correlated but nonoverlapping correlations. Psychological Methods. 1996;1(2):178–183. [Google Scholar]
- Segovia C, Hutchinson I, Laing D, Jinks A. A quantitative study of fungiform papillae and taste pore density in adults and children. Dev Brain Res. 2002;138(2):135–46. doi: 10.1016/s0165-3806(02)00463-7. [DOI] [PubMed] [Google Scholar]
- Shahbake M, Hutchinson I, Laing DG, Jinks AL. Rapid quantitative assessment of fungiform papillae density in the human tongue. Brain Research. 2005;1052(2):196–201. doi: 10.1016/j.brainres.2005.06.031. [DOI] [PubMed] [Google Scholar]
- Steiner J. What the neonate can tell us about umami. In: Kawamura Y, Kare M, editors. Umami: a basic taste. New York, NY: Marcel Dekker; 1987. pp. 97–123. [Google Scholar]
- Temussi PA. Sweet, bitter and umami receptors: a complex relationship. Trends in Biochemical Sciences. 2009;34(6):296–302. doi: 10.1016/j.tibs.2009.02.005. [DOI] [PubMed] [Google Scholar]
- Tepper BJ, Nurse RJ. Fat Perception is Related to PROP Taster Status. Physiology & Behaviour. 1997;61(6):949–954. doi: 10.1016/s0031-9384(96)00608-7. [DOI] [PubMed] [Google Scholar]
- Yamaguchi S, Ninomiya K. Umami and Food Palatability. In: Teranishi R, Wick E, Hornstein I, editors. Flavor Chemistry. Springer; US: 1999. pp. 423–431. [Google Scholar]
- Zuniga JR, Davis SH, Englehardt RA, Miller IJ, Schiffrman SS, Phillips C. Taste performance on the anterior human tongue varles with fungiform taste bud density. Chemical Senses. 1993;18(5):449–460. [Google Scholar]