

Abstract
Affective instability is a core feature of borderline personality disorder (BPD). The use of advanced assessment methodologies and appropriate statistical analyses has led to consistent findings that indicate a heightened instability in patients with BPD compared with healthy controls. However, few studies have investigated the specificity of affective instability among patients with BPD with regard to relevant clinical control groups. In this study, 43 patients with BPD, 28 patients with posttraumatic stress disorder (PTSD), 20 patients with bulimia nervosa (BN), and 28 healthy controls carried e-diaries for 24 hours and were prompted to rate their momentary affective states approximately every 15 minutes while awake. To quantify instability, we used 3 state-of-the-art indices: multilevel models for squared successive differences (SSDs), multilevel models for probability of acute changes (PACs), and aggregated point-by-point changes (APPCs). Patients with BPD displayed heightened affective instability for emotional valence and distress compared with healthy controls, regardless of the specific instability indices. These results directly replicate earlier studies. However, affective instability did not seem to be specific to patients with BPD. With regard to SSDs, PACs, and APPCs, patients with PTSD or BN showed a similar heightened instability of affect (emotional valence and distress) to that of patients with BPD. Our results give raise to the discussion if affective instability is a transdiagnostic or a disorder-specific mechanism. Current evidence cannot answer this question, but investigating psychopathological mechanisms in everyday life across disorders is a promising approach to enhance validity and specificity of mental health diagnoses.
Keywords: borderline personality disorder, affective instability, ambulatory assessment, ecological momentary assessment, e-diary
Affective dysregulation is hypothesized to be the core pathology in patients with borderline personality disorder (BPD) and the driving force behind the severe clinical manifestations of BPD symptoms (Linehan, 1993; Siever, Torgersen, Gunderson, Lives-ley, & Kendler, 2002; Tragesser, Solhan, Schwartz-Mette, & Trull, 2007). Several theories consider other BPD criteria, such as self-injury or substance abuse, to be maladaptive strategies for emotion regulation (e.g., Linehan, 1993). Affective dysregulation is related to the frequency with which patients use maladaptive affect regulation strategies (Anestis et al., 2009; Gratz & Tull, 2010) and predicts other BPD behaviors (Tragesser et al., 2007), including suicidal ideation and suicide attempts (Links et al., 2007; Yen et al., 2004), maladaptive interpersonal behaviors, and impulsive coping behaviors (Conklin, Bradley, & Westen, 2006) such as alcohol consumption (Jahng et al., 2011). The significance of affective dysregulation is delineated in the DSM-5 (American Psychiatric Association, 2013) and the ICD-10 (World Health Organization, 1992), which both highlight affective instability as an essential criterion for BPD. The ICD-10 even lists BPD under the category of emotionally unstable personality disorders. Thus, affective dysregulation, or more specifically affective instability, is obviously of central importance in this disorder.
Measuring and quantifying affective instability has proved challenging in the past and has led to inconsistent findings (Ebner-Priemer, Kuo et al., 2007). Fortunately, great progress in assessment methodologies and statistical analyses has been made in recent years. Currently, Ambulatory Assessment (AA) is the favored assessment methodology to track the ups and downs of symptoms over time (Ebner-Priemer & Trull, 2009b; Santangelo, Bohus, & Ebner-Priemer, 2012). In the past, several terms have been used for the assessment methodology that we call AA (Fahrenberg & Myrtek, 1996; Fahrenberg, Myrtek, Pawlik, & Perrez, 2007; Trull & Ebner-Priemer, 2013), including Ecological Momentary Assessment (Stone & Shiffman, 1994), the Experience Sampling Method (Larson & Csikszentmihalyi, 1983), and RealTime Data Capture (Stone, Shiffman, Atienza, & Nebeling, 2007). The major advantage that AA offers in examining instability is its ability to investigate within-person processes with high ecological validity by repeatedly assessing the variable of interest in real time and in the real world. AA is advantageous because the congruence between the actual ebb and flow of affect and retrospective assessments of affective instability (by using interviews or questionnaires) is limited. Solhan, Trull, Jahng, and Wood (2009) showed only low to moderate relationships between retrospective self-report measures and repeated AA in patients with BPD. Even worse, the participants' abilities to recall their most extreme changes in affect were largely unrelated to changes in affect observed by repeated assessments, regardless of whether the previous month or the immediately preceding week was addressed. In a similar vein, other studies on BPD and affective instability showed that unstable symptoms are more difficult to remember than stable symptoms (Ebner-Priemer, Bohus, & Kuo, 2007; Links, Heisel, & Garland, 2003).
The second major development was the establishment of mathematical methods suitable for calculating instability. Conceptually, instability covers the components frequency, amplitude and timely order, whereas variability is the general dispersion of scores, combining frequency and amplitude but without considering temporal order (see Jahng, Wood, & Trull, 2008; Ebner-Priemer, Kuo et al., 2007; or Ebner-Priemer & Trull, 2009a). A classic example may be helpful to understand the difference between the two concepts. Imagine being at a 2-week conference. During the first week, the weather is fine (sunshine), whereas it rains every day during the second week. Your colleague attended a different conference and experienced both sunshine and rain but in an alternating order for the entire two weeks (rain, sun, rain, rain, sun, sun, rain, sun …). Although you might call the weather during your own stay stable, in comparison to the unstable weather your colleague experienced, the variability in weather was actually the same for both of you. Variability, which is traditionally measured using standard deviation, does not take temporal order, from one occasion to the next (in this case, days), into account (based on Ebner-Priemer, Eid, Kleindienst, Stabenow, & Trull, 2009). In recent years, mathematical indices have been proposed that fully model the temporal order of the data (Ebner-Priemer, Kuo et al., 2007; Jahng et al., 2008; Trull et al., 2008): (mean) squared successive differences (SSDs), adjusted successive differences, the probability of acute change index (PACs), and aggregated point-by-point changes (APPCs).
The SSD index represents instability as an overall measure. SSDs are calculated as squared successive differences between consecutive assessments (i.e., ti – ti-1). SSDs cover decreases and increases alike but, by squaring, give more weight to larger differences. Group differences regarding SSDs can be investigated by either calculating mean SSDs per person (Ebner-Priemer, Kuo et al., 2007) or using multilevel models with SSDs as a level 1 variable (Jahng et al., 2008; Trull et al., 2008). The PAC index represents instability as the likelihood or occurrence of extreme changes. Successive differences between assessments are calculated, and differences above the 90th percentile of the distribution of all differences over all persons are defined as acute changes. Group differences are expressed as the number of acute changes divided by the total number of changes, and in multilevel models, acute changes are modeled as events in level 1 (Jahng et al., 2008). Whereas the PACs focus on dramatic changes, the APPC index distinguishes between increases and decreases in relation to the affective state in which they occurred. Ebner-Priemer, Kuo et al. (2007) proposed this procedure to examine patterns in affective instability. It is computed by calculating successive differences between assessments, classifying differences as increases or decreases, and then aggregating increases or decreases that start at similar baseline values. The resulting aggregated point-by-point changes allow the determination of a) whether instability is mainly driven by increases (ups) or decreases (downs) in affect and b) whether it is particularly prevalent in certain affective states, that is, whether instability is stable across the whole affective spectrum or if decreases (or increases) are related to specific states (Ebner-Priemer, Kuo et al., 2007). For example, it might be the case that some patient groups have dramatic changes especially when feeling very good.
Among the published studies, those that used AA to obtain data and analytical techniques to account for temporal dependency yielded consistent findings of heightened affective instability in patients with BPD compared to healthy controls (for an overview, see Santangelo et al., 2012). Both Ebner-Priemer, Kuo et al. (2007), comparing 50 patients with BPD with 50 healthy controls, and Woyshville, Lackamp, Eisengart, and Gilliland (1999), comparing 36 patients with affective instability (including 27 patients with BPD) and 27 control participants, found heightened instability in the BPD group. In both studies, indices were used that accounted for the temporal order of assessments (mean SSDs, APPCs). The findings were independent of the diary method used (e-diaries vs. paper-and-pencil diaries), the time-sampling strategy (prompts every 10 to 20 minutes during a 24-hr period vs. daily assessments over 90 days), and the method of assessing affective states (basic emotions and a single distress item vs. a single visual analogue scale on mood). In contrast, Farmer, Nash, and Dance (2004) and Russell, Moskowitz, Zuroff, Sookman, and Paris (2007), who used non-time-sensitive measures to determine instability, largely failed to show a heightened instability of negative affect in BPD compared to healthy controls. Whereas both studies utilized paper-and-pencil diaries, they varied widely regarding the sampling strategy (time-sampling vs. event-sampling) and regarding items used to assess affective states (20 bipolar adjective pairs vs. nine bipolar items).
Although the results of Ebner-Priemer, Kuo et al. (2007) and Woyshville et al. (1999) match the diagnostic criteria of BPD, they do not prove that affective instability is specific for BPD because they lacked clinical control groups. To our knowledge, only four AA studies compared affective instability between BPD and clinical control groups, and their findings are inconsistent. Trull et al. (2008) compared patients with BPD (n = 34) to those with a depressive disorder (n = 26), while Cowdry, Gardner, O'Leary, Leibenluft, and Rubinow (1991) compared patients with BPD (n = 16) to those with major depression (n = 10) or premenstrual dysphoric syndrome (n = 15), and healthy controls (n = 24). Both studies used time-sensitive instability indices (SSDs, PACs) and showed more affective instability in patients with BPD compared to those with depressive disorder, at least for certain affective states. No differences were observed in comparison to patients with premenstrual dysphoric syndrome. Studies differed in the diary method used (e-diaries vs. paper-and-pencil diaries), the time-sampling strategy (six times a day over a 28-day period vs. twice a day over 2 weeks), and the items used to assess the affective states (items from the Positive and Negative Affect Schedule vs. a single visual analogue scale on mood). The other two existing studies did not use a time-sensitive index. Stein (1996) compared 15 patients with BPD, four patients with anorexia nervosa, and 10 asymptomatic controls, while Farmer et al. (2004) compared 57 persons with personality disorders (17 of whom were diagnosed with BPD). The findings were mixed, as more affective variability in patients with BPD was only shown in comparison to an asymptomatic control group but not compared to anorexia nervosa or other personality disorders. Moreover, the within-subject standard deviation used is an inappropriate index for instability because it does not cover temporal dependency. Both studies utilized paper-and-pencil diaries with programmed wrist-watches or beepers, but they differed in their time-sampling strategy (five times a day over 10 days vs. eight times a day for 4 days) and in the items used to assess affective states (adjectives from the Self-Report Affect Circumplex Scale vs. 20 bipolar adjective pairs).
In the above studies, findings regarding instability in BPD using AA are mixed, as is the methodological quality. Overall, using mathematical indices that account for the temporal dependency revealed favorable results (Cowdry et al., 1991; Ebner-Priemer, Kuo et al., 2007; Trull et al., 2008; Woyshville et al., 1999), which is in line with recent theoretical considerations (Ebner-Priemer et al., 2009; Jahng et al., 2008). The same is true for using electronic diaries (Ebner-Priemer & Trull, 2009b). This finding is not surprising because only e-diaries provide absolute certainty about participants' compliance and prevent back-filling (Stone, Shiff-man, Schwartz, Broderick, & Hufford, 2002), both crucial points when modeling symptoms over time. Time-based designs differed largely in the discussed studies, but their benefits are less clear. Until now, only one study empirically tested a time-based design (Ebner-Priemer & Sawitzki, 2007). The items used to assess affective states varied tremendously, which is not surprising because there is an ongoing debate on how best to assess affective states (e.g., Schimmack, Oishi, Diener, & Suh, 2000). In summary, there is a dearth of studies assessing instability in BPD in comparison to clinical controls and healthy controls using state-of-the art methodology (e-dairies) and statistics (SSD, PAC, and APPC indices) and a proven time-based design.
Though BPD is the only disorder with “affective instability” as a classification criterion, this feature has also been investigated in several Axis I disorders. In the following we will report two studies on bulimia nervosa (BN) and one study on posttraumatic stress disorder (PTSD) because we used these disorders as clinical control groups. Vansteelandt, Probst, and Pieters (2013) reported higher affective variability in patients with BN compared to those with anorexia nervosa of the restricting type, while those with anorexia nervosa of the binge-purging type did not differ. Even more interestingly, Selby et al. (2012) investigated affective variability in BN with and without comorbid diagnosis of BPD. Whereas global comparisons did not result in significant differences, BN patients with comorbid BPD did report significantly elevated variability of negative affect on days with binge eating and/or vomiting events. Both studies used e-diaries, but they differed widely in their sampling strategies (time-sampling vs. combined time- and event-sampling) and the items used (a 2-dimensional valence and activation affect model vs. items from the Positive and Negative Affect Schedule). For PTSD, Kashdan, Uswatte, Steger, and Julian (2006), using paper-and-pencil diaries and non-time-sensitive measures, revealed higher variability in negative affect in veterans with PTSD compared to those without PTSD.
Hypotheses
The aims of this study were twofold. First, this study sought to replicate the findings of previous studies with regard to affective instability in patients with BPD compared with healthy controls. Second, this study examined the specificity of affective instability in patients with BPD by comparing the affective instability of patients with BPD to that in relevant clinical controls (i.e., patient groups with other diagnoses associated with affective disturbance). Specifically, we investigated affective instability in three groups: a) patients with BPD, b) healthy controls, and c) clinical controls, namely, patients with PTSD and patients with BN. We hypothesized that a heightened affective instability would exist in patients with BPD compared with the other groups. To assess instability, we used a high-sampling-frequency approach and e-diaries. To analyze instability, we used three time-sensitive instability indices: a) a multilevel model for SSDs, b) a multilevel model for PACs, and c) APPCs.
Method
Participants
The participant group (N = 119) comprised 43 patients with BPD, 28 patients with PTSD, 20 patients with BN, and 28 healthy controls. Only female participants between 18 and 48 years of age were included. All patients in the BPD group met the DSM-IV diagnostic criteria for BPD. In the BPD group, all possible comorbidities were allowed. The PTSD and BN groups included psychiatric patients who met the criteria for either a current DSM-IV PTSD diagnosis or a current DSM-IV BN diagnosis but did not have a BPD diagnosis. Patients with histories of schizophrenia or bipolar disorder or current substance abuse were excluded from this study. Table 1 presents the most frequent Axis I and II comorbidity rates by group (rarer comorbidities are available upon request). Most of the PTSD patients had a history of childhood sexual abuse and thus PTSD Type II (Terr, 1991). As Table 1 shows, patients with BPD showed high rates of current Axis I disorders (particularly anxiety disorder, PTSD, and eating disorders). In the PTSD group, anxiety disorders, depressive disorder, and eating disorders were among the most common comorbid Axis I disorders. In the BN group, depressive disorder and anxiety disorders were the most frequently diagnosed Axis I comorbidities. The exclusion criteria for the healthy control group included any current or past Axis I or Axis II disorder diagnoses, self-reported current psychotherapy, or the current use of psychotropic medications.
Table 1. Demographic Characteristics and Affective Lability Scale (ALS) Scores for Borderline Personality Disorder (BPD), Posttraumatic Stress Disorder (PTSD), Bulimia Nervosa (BN) Participants, and Healthy Controls (HC).
| Variable | BPD (n = 43) | CC = PTSD + BN (n = 48) | PTSD (n = 28) | BN (n = 20) | HC (n = 28) | p |
|---|---|---|---|---|---|---|
| Age in years | ||||||
| M (SD) | 26.72 (7.07) | 30.44 (8.95) | 35.25 (7.53) | 23.70 (5.97) | 28.82 (7.47) | n.s. |
| Psychotropic medication | ||||||
| n (%) | 16 (37%) | 22 (46%) | 17 (60%) | 5 (25%) | — | n.s. |
| Hospitalization | ||||||
| Outpatients n (%) | 26 (60%) | 17 (35%) | 8 (29%) | 9 (45%) | ||
| Inpatients n (%) | 17 (40%) | 31 (65%) | 20 (71%) | 11 (55%) | ||
| Current Axis I diagnoses n (%) | ||||||
| Major depression | 9 (21%) | 15 (54%) | 10 (50%) | |||
| Anxiety disorders | 27 (63%) | 19 (68%) | 10 (50%) | |||
| Generalized anx. | 6 (14%) | 1 (4%) | 1 (5%) | |||
| Social phobia | 16 (37%) | 12 (43%) | 8 (40%) | |||
| Panic disorder | 14 (33%) | 10 (35%) | 2 (10%) | |||
| Agora phobia | 3 (7%) | 0 (0%) | 2 (10%) | |||
| Specific phobia | 8 (19%) | 4 (14%) | 4 (20%) | |||
| PTSD | 22 (51%) | 28 (100%) | 3 (15%) | |||
| Obs-Compulsive | 5 (11%) | 0 (0%) | 1 (5%) | |||
| Eating disorders | 14 (33%) | 8 (29%) | 20 (100%) | |||
| Anorexia | 0 (0%) | 1 (4%) | 0 (0%) | |||
| Bulimia | 9 (21%) | 2 (7%) | 20 (100%) | |||
| Binge eating | 5 (12%) | 5 (18%) | 0 (0%) | |||
| Current Axis II disorders n (%) | ||||||
| Borderline | 43 (100%) | exclusion criterion | ||||
| Avoidant | 24 (25%) | 6 (21%) | 3 (15%) | |||
| Obs-Compulsive | 7 (16%) | 3 (11%) | 2 (10%) | |||
| Dependent | 7 (16%) | 0 (0%) | 1 (5%) | |||
| Paranoid | 7 (16%) | 3 (11%) | 1 (5%) | |||
| ALS total score: Sum scores | p < .001 (F-test) | |||||
| M (SD) | 17.33 (3.11) | 12.49 (4.56) | 12.21 (5.10) | 12.90 (3.78) | 2.27 (2.33) | BPD > HC (p < .001, G-H) BPD > CC (p < .001, G-H) |
Note. n.s. = no significance; G-H = Games-Howell.
Baseline Assessment
Psychiatric diagnoses
In the patient groups, Axis I disorders were assessed using the German version of the Structured Clinical Interview for DSM-IV Axis I Disorders (SCID-I: Wittchen, Wun-derlich, & Gruschwitz, 1997), and Axis II disorders were assessed using the German version of the International Personality Disorder Examination (IPDE: Mombour et al., 1996). In the healthy control group, the exclusion of any current or past Axis I or Axis II disorder diagnoses was confirmed by the German version of the SCID-I (Wittchen et al., 1997) or SCID-II (Fydrich, Renneberg, Schmitz, & Wittchen, 1997). Postgraduate psychologists administered all diagnostic instruments at the two assessment clinics, with a substantial concordance on diagnoses between the raters (IPDE: κ = 0.77; SCID-I: κ = 0.69). The SCID-I is a well-validated assessment of Axis I disorders with very good psychometric properties (κs > .70, First, Spitzer, Gibbon, & Williams, 1996). Regarding the assessment of Axis II disorders, both the IPDE and the SCID-II have shown similar good interrater reliability (IPDE: κs > .70, Loranger et al., 1994; SCID-II: κs > .65, First, Spitzer, Gibbon, Williams, & Benjamin, 1997).
Questionnaire measures
In addition to the AA assessment, participants completed the Affective Lability Scale (ALS: Harvey, Greenberg, & Serper, 1989), which is a self-reported trait measure of affective instability (i.e., the subjective fluctuation of one's affective states). Participants rated their self-perceived affective state fluctuations on 54 items on a 4-point anchored rating scale, ranging from being (0) very undescriptive to (3) very descriptive of the person. These 54 items were used to generate six subscale scores of affective instability: labile anger, labile depression, labile elation, labile anxiety, depression/elation oscillation, and depression/anxiety oscillation. The total score (i.e., the sum score of the six subscales) was used in the analyses. The ALS showed very good psychometric characteristics with Cronbach's alpha for the total score, corresponding to α = .98, and Cronbach's alpha for the six subscales, ranging from .88 to .95 (labile anger α = .92, labile elation α = .88, labile anxiety α = .89, labile depression α = .91, depression/elation oscillation α = .88, and depression/anxiety oscillation α = .95).
The Borderline Symptom List (Bohus et al., 2007) is a self-rating instrument with 98 items to quantify BPD-typical symptomatology. A total score, as well as seven subscales (self-perception, affect regulation, self-destruction, dysphoria, loneliness, intrusions, and hostility), can be generated. This instrument has shown very good psychometric properties and a high validity (Bohus et al., 2007). Cronbach's alpha in our sample corresponded to α = .98 for the total score, and Cronbach's alpha for the seven sub-scales ranged from .79 to .97.
The Posttraumatic Stress Diagnostic Scale (Foa, Cashman, Jay-cox, & Perry, 1997) consists of 49 items and assesses symptom severity and functioning with regard to PTSD. It can be used to generate a symptom severity score ranging from 0 to 51. It has a high reliability, with an excellent internal consistency and very high test–retest reliability, and a highly satisfactory validity (Foa et al., 1997). Cronbach's alpha in our sample corresponded to α = .90 for the total score.
The Childhood Trauma Questionnaire (Bernstein et al., 1994) is a 28-item self-reported measure of childhood maltreatment. It assesses five types of adverse childhood events (emotional, physical, and sexual abuse, as well as emotional and physical neglect), and a total score as well as five subscales, that is, one for each type of childhood maltreatment, can be generated. The questionnaire has demonstrated adequate psychometric properties with good reliability, as well as good convergent and discriminant validity (Bernstein et al., 1994). Cronbach's alpha in our sample corresponded to α = .93 for the total score and ranged from .88 to .98 for the subscales.
Electronic Diary Assessment
To assess participants' current emotions (“Do you feel any of the following emotions right now?”), participants chose their (predominant) emotion from the list of happy, anxious, angry, shame, disgust, sad, guilt, interest, envy/jealousy, emotion but cannot name it, and no emotion. After selecting a current emotional state, participants rated the intensity of this emotion on an 11-point Likert scale ranging from 1 to 11. In the event that “emotion but cannot name it” was chosen, an additional question was added concerning the pleasantness of the current emotion. Specifically, the participant was asked, “How does this emotion that you cannot name feel?” Two possible answers were provided (pleasant or unpleasant) followed by the intensity rating of this unnamable emotion. In addition, participants were queried about the occurrence of any second emotion, that is, the simultaneous experience of a further emotion besides the already reported (first) emotion. Patients reported whether a second emotion was present by marking the specific emotion on the same list above (with the first reported emotion left out). This second emotion was also rated for intensity on an 11-point Likert scale ranging from 1 to 11. Participants rated their current intensity of distress on a single 11-point Likert scale from 0 to 10. In addition, patients were asked disorder-specific questions (data not reported).
Procedures
Study Procedure
Data were collected at two sites in Germany: the Central Institute of Mental Health Mannheim and the Psychosomatic Clinic St. Franziska-Stift Bad Kreuznach. Outpatients and inpatients were recruited from their outpatient clinics or wards or via advertisements in local newspapers and on the Internet. A big effort was put into recruiting outpatients and inpatients in the very beginning of the treatment (up to the first 4 weeks after admission to therapy). Most of the patients were referred from their local psychiatrists to our specialized treatment programs to confirm the diagnoses and to provide state-of-the-art treatment. After the initial diagnostic procedure, patients were carefully instructed and trained regarding the use of the e-diary and carried a palmtop computer for 24 hours to provide the AA data of affective instability. When the e-diaries were returned, the data were downloaded from the e-diaries, and a detailed feedback sheet of the personal data of every participant was created. Per a standard rule of the two assessment sites, patients admitted to treatment (73%) were not compensated financially. However, patients not in treatment (27%) received financial compensation (up to 50€). All patients received feedback on their personal data after data collection. The local ethics committee approved the study, and all participants provided written informed consent before participating.
Electronic Diary Procedure
Each participant received a palmtop computer (Tungsten E, Palm Inc., Milpitas, CA) as an e-diary. The DialogPad software (Gerhard Mutz, Cologne University, Germany) was used to program the palmtop computers to function as e-diaries with a time-based sampling protocol. The e-diary emitted a prompting signal every 15 minutes (± 1 minute). Each response was automatically time-stamped by the e-diary software program. Participants freely chose when to begin their e-diary assessment; the only requirement was that they carried the e-diary for 24 hours. Thus, the assessment period usually occurred over 2 days, including one night. No inquiries occurred at night because participants were instructed to deactivate the e-diary before going to sleep. Participants simply reactivated the e-diary the next morning to continue the assessment. However, one patient with PTSD and one patient with BN started their e-diaries in the course of the morning and switched it off when going to bed without reactivating their palmtop computers the next morning. After 24 hours, participants finished the e-diary assessment and returned the e-diaries.
Data Preprocessing and Statistical Analyses
Data Preprocessing
To aggregate the separate assessments of emotion and intensity into a single valence index, the intensities of negative emotions (i.e., anxious, angry, shame, disgust, sad, guilt, envy/jealousy, and unpleasant unnamable emotion) were multiplied by −1, and the intensities of the positive emotions (i.e., happy, interest, and pleasant unnamable emotion) retained positive values. This method resulted in valence scores with a range of −11 to + 11. Ratings of “no emotion” were given valence scores of zero. This constitutes a common method (e.g., Eaton & Funder, 2001; Ebner-Priemer, Kuo et al., 2007; Zelenski & Larsen, 2000). Thus, the two dependent variables used in the statistical analyses were a) valence (with possible values ranging from −11 to + 11) and b) distress (with possible values ranging from 0 to 10).
Statistical Analyses
Sample characteristics, mean group differences, correlations, and frequency distributions
To analyze the mean differences, we first aggregated momentary data on a subject level and then used ANOVAs to compare the independent groups using Scheffé or Games-Howell (in case the data did not meet the homogeneity of variances assumption) post hoc analyses. To test the associations between the demographic variables and (mean individual) instability, Pearson's correlation coefficients and non-parametric Kendall-Tau correlation coefficients were calculated. Pearson's χ2 test was used to assess whether the observed frequency distributions differed from a theoretical distribution. Non-parametric alternatives were used when the requirements for a parametric analysis were not met.
Analyses of instability
For the statistical analyses of instability, we employed a procedure proposed by Jahng et al. (2008). They presented a multilevel model for analyzing level 1 SSDs (a gamma model with a log link) and level 1 PACs (a logistic model with a logit link) in a 2-level model. We used the SAS procedure GLIMMIX to estimate these models. GLIMMIX relies on linearization and Taylor-series techniques to construct Wald-type test statistics and confidence intervals. Because these types of generalized linear mixed models involve an optimization problem, which must be solved by an approximation of the marginal likelihood, we confirmed the results by replicating the analyses using the older SAS procedure NLMIXED, which uses an integral approximation via a Gaussian quadrature; the NLMIXED procedure was used in the original article by Jahng et al. (2008). Because this procedure led to the same qualitative conclusions and similar estimates (results available upon request), we present the results of the GLIMMIX procedure only. The equation for comparing SSDs returns the following (for reasons of simplicity, we demonstrate the multilevel model comparing two groups, BPD vs. healthy controls; the full model just adds additional dummy variables for diagnostic groups):
Level 1 link function: çj = log (1`j)
Level 1 structural model: çj = b0j
Level 2 model: b0j = ã00 + ã01Groupj + u0j, u0j ~ N(0, ô2),
where SSDij is the square of the successive difference at the ith occasion for the jth individual. γ01 is the log transformed group difference in the overall mean of SSD and Groupj is a dummy variable, coding for patients with BPD (Groupj = 1) or healthy controls (Groupj = 0). When comparing BPD versus healthy controls versus clinical controls further dummy variables are introduced. Given a significant group difference (as shown by a significant F test), one can conduct contrast analyses to investigate differences between BPD patients and healthy controls and between BPD and clinical controls.
The multilevel model for PACs is as follows (again for the comparison of BPD vs. healthy controls):
Level 1 link function:
Level 1 structural model: çj = b0j
Level 2 model: b0j = ã00 + ã01 Groupj + u0j, u0j ~ N(0, ô2),
where AC(i + 1)j = 1, if SDij is equal to or greater than c ≥ 3 for distress and c ≥ 9 for valence (corresponding to the 90th percentiles from the preliminary analysis), and AC(i + 1)j = 0, otherwise. ã01 is the logit transformed group difference in the overall probability of acute change (with an extension to more dummies as above). Again, after a significant F test for group, contrast analyses were conducted to reveal whether the significant differences exist between BPD patients and healthy controls, clinical controls, or both.
In addition to the multilevel analyses of SSDs and PACs, we calculated aggregated point-by-point changes (APPCs). APPCs examine decreases (and increases) in relation to the starting point of the decreases (or increases). Thus, APPCs more descriptively describe a) whether instability is mainly characterized by increases (ups) or decreases (downs) in affect and b) whether changes (ups, downs) are related to specific states (e.g., only during highly positive valence). By disentangling the time series and decomposing them into point-by-point changes, we obtained multiple decreases and increases in valence for each participant. We aggregated the decreases and increases by their momentary valence into five momentary valence bins from low to high valence, where low valence = −11 to −7, mid-low valence = − 6 to −3, midva-lance = − 2 to + 2, mid-high valence = +3 to + 6, and high valence = +7 to + 11. This procedure was similar to that used by Ebner-Priemer, Kuo et al. (2007). Similar to the original paper, we conducted t tests to analyze the aggregated between-groups changes among the five valence bins to compare the results of the two studies. In addition, we used multilevel analyses to confirm the results.
Results
Sample Characteristics
A total of 119 female participants, comprising 43 patients with BPD, 28 patients with PTSD, 20 patients with BN, and 28 healthy controls, took part in the study. Table 1 presents the demographic characteristics of the sample. The participant age ranged from 18 to 48 years, with an average age of 28.71 years (SD = 8.07). Patients in the PTSD group were, on average, somewhat older than those with BPD, those with BN, and the healthy controls. However, the differences among the three tested groups (BPD, clinical controls, and healthy controls) were not significant (Kruskal-Wallis-X2 = 4.15, df = 2; p = .16). In addition, age was not correlated with instability (mean SSDs) in distress or valence (Kendall-Tau, n = 119: τvalence = −.04, p = .51; τdistress = −.01, p = .84). During the assessment, 37% of patients with BPD, 61% of patients with PTSD, and 25% of patients with BN were using psychotropic medications. The difference between the BPD and the clinical control groups in the numbers of patients on psychotropic medication was not significant (X2 = 0.69, n = 91, p = .41). Furthermore, psychotropic medication during the assessment period was not associated with instability (mean SSDs) in valence or distress in the patient groups (Kendall-Tau, n = 91: τvalence = −.03, p = .70; τdistress = −.04, p = .64). The three patient groups differed in their hospitalization rates. To address potential differences in symptom severity between hospitalized and nonhospitalized patients, we investigated symptom severity in each patient group using three relevant scales for symptom severity: the Posttraumatic Stress Diagnostic Scale (Foa et al., 1997), the Borderline Symptom List (Bohus et al., 2007), and the Childhood Trauma Questionnaire (Bernstein et al., 1994). There was no evidence of severity differences between hospitalized and nonhospitalized patients: in all three groups on all three scales, no differences emerged between the hospitalized and the nonhospitalized patients. Furthermore, patients with BPD reported the highest overall scores of affective instability as assessed by the ALS questionnaire.
Electronic Diary Assessment: Preliminary Considerations
As shown in Table 2, the average shutdown periods at night were comparable across patient groups and healthy controls. The mean shutdown period at night did not differ among the BPD, clinical control, and healthy control groups (F(2, 112) = .923; p = .40). The average number of self-reports during the 24-hr assessment period ranged from 56.68 to 58.50 self-reports in the investigated groups. We calculated compliance rate per participant by dividing the number of responses by the total number of beeps. This resulted in an overall compliance rate of 94%. The three examined groups did not differ with regard to either the mean number of responded prompts, F(2, 116) = .23, p = .79 or the compliance rate ((F(2, 116) = .46, p = .63). Furthermore, there was no association between either instability and compliance (Kendall-Tau, n = 119: τvalence = −.06, p = .38; τdistress = −.05, p = .48) or the duration of assessment and compliance, that is, the percentage of missing data did not change over the course of the assessment period (Kendall-Tau, n = 119: τ = .04). Thus, the datasets upon which the statistical analyses are based are comparable across groups.
Table 2. E-Diary Data of Patients With Borderline Personality Disorder (BPD), Posttraumatic Stress Disorder (PTSD), or Bulimia Nervosa (BN), and Healthy Controls (HC).
| Variable | BPD (n = 43) | CC = PTSD + BN (n = 48) | PTSD (n = 28) | BN (n = 20) | HC (n = 28) | p |
|---|---|---|---|---|---|---|
| Period of shut-down during night (h)# | ||||||
| M (SD) | 8.50 (2.34) | 8.02 (2.18) | 7.68 (2.30) | 8.51 (1.95) | 8.14 (1.88) | n.s. |
| Total number of self-reports | ||||||
| M (SD) | 57.91 (7.68) | 57.75 (8.29) | 58.50 (8.76) | 56.70 (7.69) | 56.68 (7.14) | n.s. |
| Min/Max | 42/80 | 38/75 | 38/75 | 40/71 | 44/71 | |
| Compliance rate % | 94 | 93 | 93 | 93 | 94 | n.s. |
| Average mood states: e-diary data | p < .001 (F-test) | |||||
| Valence M (SD) | −2.55 (2.76) | −1.73 (3.12) | —2.12 (3.28) | −1.19 (2.88) | 1.51 (1.19) | BPD < HC (p < .001, Scheffé) |
| Distress M (SD) | 4.85 (1.83) | 4.54 (2.16) | 4.78 (2.18) | 4.19 (2.12) | 0.34 (0.48) | BPD > HC (p < .001, Scheffé) |
Note.
n = 27 patients with PTSD and n = 19 patients with BN; n.s. = no significance.
Differences in Valence and Distress Among Patients With BPD, Clinical Controls, and Healthy Controls
First, we graphed the data to obtain a visual representation of mood and distress intensity, as proposed by Ebner-Priemer and Sawitzki (2007); we used the R implementation “Bertin matrices” (Sawitzki, 2012) (for details on Bertin's suggestions on graphical data analysis, see de Falguerolles, Friedrich, & Sawitzki, 1997). Color-coding the intensity of each e-diary rating of each participant allows for the visualization of the full 3-dimensional data set (covering subject, time and intensity). Specifically, each horizontal line in Figure 1a (valence) and 1b (distress) represents a subject. Each square represents a self-report, and the color of the squares represents the valence intensity (Figure 1a) or distress intensity (Figure 1b). White squares indicate missing data.
Figure 1.
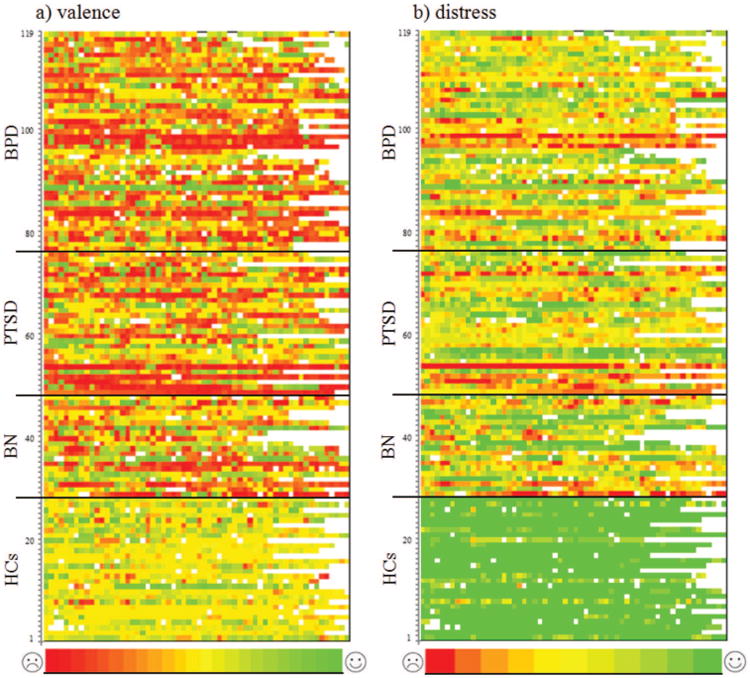
Color-coded (a) valence and (b) distress ratings of patients with borderline personality disorder (BPD), patients with posttraumatic stress disorder (PTSD), patients with bulimia nervosa (BN), and healthy controls (HC) over the 24-hr assessment period. Each row represents a subject (HC = Rows 1–28; BN = Rows 29–48; PTSD = Rows 49–76; BPD = Rows 77–119), and each square represents a 15-min self-report interval. The color denotes the level of valence and distress (valence ratings: −11 to 11, i.e., 23 categories that range from red to green, where red represents negative affective states, yellow represents neutral affect, and green represents positive affective states; distress ratings: 0 to 10, i.e., 11 categories that range from red to green, where red represents high distress and green represents low distress). White squares represent missing data. a: The upper portion of the figure from Lines 29 to 119 is mostly red, orange, and yellow, which represents the medium and negative valence ratings in the three investigated patients groups. However, different shades of green are also represented. Thus, patients' ratings varied over the full range of valence states. In contrast, the lower portion of the figure is mostly yellow and green, which depicts the medium to positive valence ratings of the healthy controls. The frequent and fast changes in color in the upper two thirds of the figure represent the instability of the patient groups. b: The colors of the figure from Lines 29 to 119 largely vary across red, orange, yellow, and green tones. Thus, the ratings in the three patient groups again varied over the full range of distress. The lower portion of the figure is mostly green, which depicts the low distress self-reports of the healthy controls. Again, the frequent and fast changes of color in the upper two thirds of the figure represent the instability of the patient groups.
These figures reveal obvious differences among the patient groups and healthy controls. All three patient groups showed more negative values (i.e., more red squares) and more changes over time (i.e., more color changes across ratings) than healthy controls. However, the patient groups were not clearly distinguishable with regard to the frequency of negative values (i.e., the number of red squares) or changeability (i.e., the color changes).
Mean Differences in Valence and Distress Among Patients With BPD, Clinical Controls, and Healthy Controls
Next, we analyzed the mean differences in valence and distress among the groups (see Table 2). Patients with BPD showed a negative mean valence and a high mean level of distress. These values differed substantially from those reported by the healthy controls. However, the clinical controls reported similar average levels of valence and distress to those of patients with BPD, with comparable negative mean valence and high levels of distress. The statistical analyses revealed a significant difference between groups for the average valence level, F(2, 116) = 21.17, p < .001. Group differences were evident for the comparison of the average valence levels between the BPD and healthy control groups (p < .001) but not between the BPD group and the clinical controls (p = .35), which is supported in Figures 1a and 1b. The same pattern was found with regard to the mean differences of distress levels: an overall significant difference was found among the three groups, F(2, 116) = 64.73, p < .001; however, only the difference between the BPD group and the healthy controls was significant (p < .001). No significant differences were found between the patients with BPD and the clinical controls (p = .70).
Squared Successive Differences in Valence and Distress Among Patients With BPD, Clinical Controls, and Healthy Controls
The multilevel analysis of SSDs as an overall measure of instability revealed significant group effects regarding both valence (F(3, 115.5) = 12.46;p < .001) and distress (F(3, 114.8) = 28.52; p < .001). As indicated in Table 3, patients with BPD showed higher squared successive differences in valence compared with healthy controls (p < .001). However, patients with BPD did not show higher squared successive differences in valence compared with clinical controls (p = .72). The same results applied to distress: patients with BPD showed a significantly elevated instability in momentary distress ratings over time compared with healthy controls (p < .001), but there was no difference between patients with BPD and clinical controls (p = .61). The contrast estimates in Table 3 are raw estimates on a log scale.
Table 3. Raw Estimates of Contrasts for Squared Successive Difference (SSD) Scores Using SAS Procedure GLIMMIX for the Outcome Variables Valence and Distress.
| Estimate | SE | Df | t | p | ||
|---|---|---|---|---|---|---|
| Valence | BPD vs. HC | 1.08 | 0.20 | 115.6 | 5.55 | <.001 |
| BPD vs. CC | 0.06 | 0.17 | 115.6 | 0.37 | .72 | |
| Distress | BPD vs. HC | 1.10 | 0.14 | 114.9 | 7.97 | <.001 |
| BPD vs. CC | −0.06 | 0.12 | 115 | —0.51 | .61 |
The Probability of Acute Change Differences in Valence and Distress Among Patients With BPD, Clinical Controls, and Healthy Controls
Addressing the occurrence of extreme changes, the multilevel analysis of PACs revealed significant group effects for both valence (F(3, 98.16) = 8.63; p < .001) and distress (F(3, 113.2) = 20.96; p < .001). The estimates of the contrasts and their standard errors are shown in Table 4. These results show a significantly higher probability of acute changes in valence among patients with BPD compared with healthy controls (p < .001). However, the BPD group did not produce a greater PAC score than clinical controls, and no significant differences were found between these groups (p = .79). Similar results were found for the PACs of distress: patients with BPD showed significantly higher PACs in distress ratings compared with the healthy control group (p < .001), but no such differences were found between patients with BPD and clinical controls (p = .82). The contrast estimates in Table 4 are raw estimates on a logit scale.
Table 4. Raw Estimates of Contrasts for Acute Change (PAC) Scores Using SAS Procedure GLIMMIX for the Outcome Variables Valence and Distress.
| Estimate | SE | Df | t | p | ||
|---|---|---|---|---|---|---|
| Valence | BPD vs. HC | 1.41 | 0.30 | 121.1 | 4.70 | <.001 |
| BPD vs. CC | 0.06 | 0.24 | 86.06 | 0.26 | .79 | |
| Distress | BPD vs. HC | 2.41 | 0.32 | 188.6 | 7.47 | <.001 |
| BPD vs. CC | 0.05 | 0.22 | 89.07 | 0.23 | .82 |
Aggregated Point-by-Point Changes in Valence and Distress Among Patients With BPD, Clinical Controls, and Healthy Controls
Figure 2 illustrates the average decreases (Figure 2a) and average increases (Figure 2b) in valence in relation to the respective starting point in momentary valence. Replicating our earlier findings, patients with BPD showed significantly greater decreases in the high valence bins (i.e., good moods) compared with healthy controls (Figure 2a): high valence bin t(47.52) = −2.96, p < .01; mid-high valence bin t(50.33) = −7.59, p < .001; midvalence bin t(61) = −7.13, p < .001. No comparisons could be conducted for the mid-low and low valence bins (i.e., bad mood) because these decreases occurred in only two healthy controls in each bin. We used multilevel analyses to verify these group differences and confirmed our findings (high valence bin: p < .01; mid-high valence bin: p < .001; midvalence bin: p < .001; mid-low and low valence bin: too few subjects for comparison). However, as shown in Figure 2a, decreases in patients with BPD were similar to those in clinical controls (patients with PTSD and BN), revealing no significant differences (high valence bin: t(70) = 1.39, p = .17; mid-high valence bin: t(82) = 1.29, p = .20; midvalence bin: t(82) = 1.05, p = .30; mid-low valence bin: t(75.65) = −0.81, p = .42; low valence bin: t(62) = −0.91, p = .37). Again, the multilevel analyses confirmed these findings (high valence bin: p = .20; mid-high valence bin: p = .06; midvalence bin: p = .70; mid-low valence bin: p = .25; low valence bin: p = .62).
Figure 2.
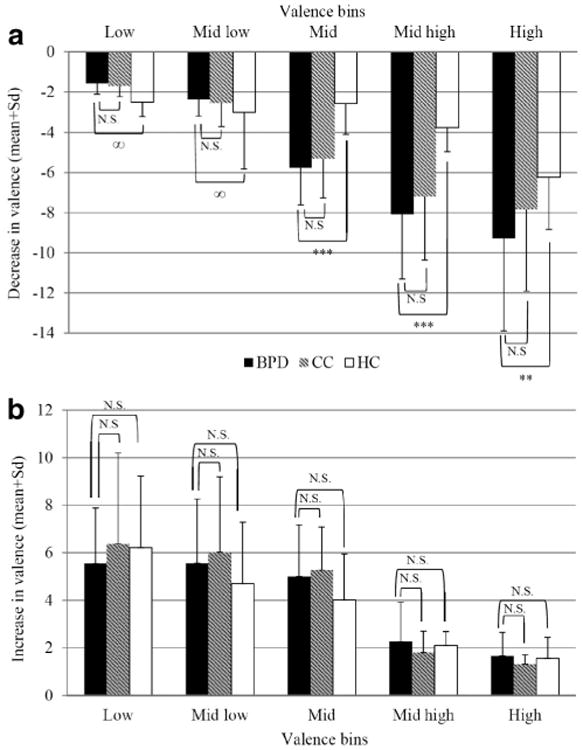
Changes in valence with respect to momentary valence. a: Decreases in valence in relation to each previous corresponding valence rating across patients with BPD, clinical controls (CC), and healthy controls (HC). b: Increases in valence in relation to each previous corresponding valence rating across patients with BPD, clinical controls (CC), and healthy controls (HC). ∞ - due to the low number of recorded decreases from low and mid-low affective states in the healthy control group (ns = 2), statistical analyses were not conducted. *** p < .01; N.S.: no significance
Regarding increases in valence, no significant differences between patients with BPD and healthy controls emerged (Figure 2b; data available upon request). This is consistent with the findings described in the original paper (see Ebner-Priemer, Kuo et al., 2007). Thus, though patients with BPD reported greater decreases in valence compared to healthy controls, these groups did not differ with regard to increases in valence. Furthermore, these results do not support differences in the patterns between BPD patients and clinical controls (Figure 2b; data available upon request).
In summary, the APPCs analyses indicate that heightened instability is a) mainly characterized by decreases (drops) in affect and b) related to highly positive valence. Patients with BPD reported significantly larger decreases from the positive valence states compared with healthy controls, while the mood increases were similar in both groups and showed no significant differences. These results suggest that a positive mood is less stable in BPD patients in comparison with healthy controls. In contrast, there are no differences between patients with BPD and clinical controls with regard to patterns of decreases or increases in mood.
Comorbidity
Comorbidity systematically differed between groups because clinical controls were not allowed to have a comorbid BPD diagnosis, whereas BPD patients were allowed to have a comorbid PTSD or BN diagnosis. We used three approaches to statistically address this issue. First, we generated the new variable comorbidity, adding up the total number of Axis I and Axis II diagnoses other than the primary diagnosis; this variable was included as a level 2 predictor in addition to the four diagnoses variables in the multilevel model described in the statistical analyses section. Comorbidity showed no significant effect in predicting instability (SSD) of valence (p = .98) or distress (p = .07); in addition, the inclusion of this variable did not change the results. Second, we separated the BPD group into “pure” patients with BPD (i.e., those without comorbid PTSD; n = 21) and those BPD patients with comorbid PTSD (n = 22) to compensate for the high comorbidity of PTSD in the BPD group. However, similar to the comparison with all BPD patients, we did not find any significant difference in instability (SSD) when comparing “pure” patients with BPD to clinical controls (results available upon request). Third, we used three dummy-coded “diagnosis” variables coding separately for BPD, PTSD, and BN. The results favor our initial interpretation of our data, indicating that all three patient groups are associated with heightened affective instability because nearly all diagnoses significantly predict the instability of distress and valence (distress SSD: BPD p < .01, PTSDp < .05, BN p < .01; valence SSD: BPD p < .01, BN p < .01). The PTSD diagnosis missed significance only for valence (p = .22). Taken together, comorbidity cannot explain the missing specificity in affective instability in BPD.
Discussion
To investigate the hypothesized heightened affective instability in patients with BPD, we used state-of-the-art methodology, including e-diaries, high-frequency sampling, and time-sensitive instability indices. Compared to healthy controls, heightened instability in BPD was found consistently across different concepts of affect (valence and distress) and across multiple statistical indices (SSDs: squared successive differences, PACs: probability of acute changes, APPCs: aggregated point-by-point changes). These findings replicated and extended earlier results (SSDs: Ebner-Priemer, Kuo et al., 2007; Woyshville et al., 1999; PACs: Jahng et al., 2008; APPCs: Ebner-Priemer, Kuo et al., 2007). However, our findings do not support the hypothesis that heightened affective instability is specific to patients with BPD. Compared to patients with PTSD and BN, patients with BPD did not show a heightened affective instability using either squared successive changes (SSDs), probability of acute changes (PACs), or aggregated point-by-point changes (APPCs). This lack of differences applied to both valence and distress. In sum, our findings were consistent across indices and concepts but were contrary to expectations: patients with BPD did not show more affective instability than clinical controls.
Although this study is the first to use e-diaries to directly compare the affective instability of patients with BPD to those with PTSD or BN, this lack of specificity does not contradict other studies; nevertheless, it is surprising. BPD is the only disorder for which affective instability is a diagnostic criterion; BPD is even defined as “emotionally unstable personality disorder” in the ICD-10 (World Health Organization, 1992). However, the advent of e-diaries has led to multiple reports of heightened instability in disorders for which instability is not a classification criterion, such as bulimia nervosa (Anestis et al., 2010; Selby et al., 2012; Vansteelandt et al., 2013), posttraumatic stress disorder (Kashdan et al., 2006), depression (Peeters, Berkhof, Delespaul, Rottenberg, & Nicolson, 2006; Thompson et al., 2012), anxiety disorders (Pfaltz, Michael, Grossman, Margraf, & Wilhelm, 2010), and bipolar disorder (Jones, Hare, & Evershed, 2005). One might speculate that psychiatric research has neglected instability due to a paucity of appropriate assessment strategies and adequate mathematical indices; therefore, true instability has gone unobserved in several disorders. Before discussing the implications of our findings, we want to present several methodological considerations and possible alternative explanations. With regard to the former, we address real-time assessment, the valence calculation algorithm, the mathematical dependency of instability and intensity, and the sampling design. With regard to the latter, we investigated both the effect of the affective instability diagnostic criterion and adverse childhood events as an underlying condition that predicts instability.
Methodological Considerations
Real-time assessment
In contrast to the AA findings, the ALS revealed a heightened intensity in the BPD group. Discrepancies between these methods can be discussed on both empirical and conceptual levels. Empirically (and as described in the introduction), Solhan et al. (2009) compared the retrospective questionnaires of affective instability with the instability indices of realtime data (i.e., AA); the relationships were modest at best and not satisfactory at all. In addition, these authors examined whether patients were able to remember their most pronounced mood changes. However, retrospective ratings of the occurrence of extreme mood changes were largely unrelated to real affective changes. These findings are similar to those of Ebner-Priemer, Bohus et al. (2007) and Links et al. (2003). Although extreme mood changes should be remembered more easily, according to Kahneman, Fredrickson, Schreiber, and Redelmeier's (1993) peak-end rule, remembering and aggregating the continuous instability among affective states is difficult. Conceptually, several authors (e.g., Fahrenberg et al., 2007) have argued that retrospective questionnaires access subjective (i.e., mental) representations of experience but not the experience itself. In contrast, AA can indeed track experience. Accordingly, theoretical models such as the accessibility model (Conner & Barrett, 2012; Kahneman & Riis, 2005; Robinson & Clore, 2002) claim that different assessment methods access disparate types of knowledge bases (i.e., selves): the experiencing self and the believing self.
Valence calculation algorithm
To create a valence index, we multiplied the intensity of negative emotions by −1 and positive emotions by + 1. However, because we also collected second emotion ratings, two other ways to calculate momentary valence are possible: using a sum score of the first and second emotions' intensities or using a mean score of the first and second emotions' intensities. However, analyses using these alternative valence indices produced the same results. The use of a categorical approach to assess emotions may be criticized given the possibility that applying a dimensional approach might have led to different findings. However, we assessed distress using a dimensional approach, and the results did not differ from those regarding valence, which confirmed the heightened instability among individuals with BPD compared with healthy controls but not compared with clinical controls. Nonetheless, a shortcoming of our assessment of affective state is that we did not assess valence in a way in which it would be possible to distinguish positive and negative valence over time. It might be useful to run analyses separately for affective instability for negative affect and affective instability for positive affect because the patterns may be distinct. However, there is an ongoing discussion regarding the dimensionality of affect (e.g., Leue & Beauducel, 2011; Schimmack & Grob, 2000), with cross-Atlantic differences between North America (favoring 2-dimensional models) and Europe (favoring 3-dimensional models). Although 3-dimensional models appear to out-perform 2-dimensional models with regard to data fit (Leue & Beauducel, 2011; Schimmack & Grob, 2000), even 3-dimensional models are not sufficient to distinguish between specific basic emotions (Schimmack & Grob, 2000). Furthermore, opinions differ as to whether trait measures can be used to assess state affect because they are thought to differ in their structure, which may preclude their mutual use (Schimmack & Grob, 2000; Schimmack et al., 2000). Future research is clearly needed to develop items for AA and address the data fit of these items and to develop time-based designs for different purposes, such as investigations of affective instability.
Mathematical dependency of instability and intensity
Unfortunately, a mathematical dependency exists between instability and the mean level of affect. This relationship has a sort of inverse U shape, with floor and ceiling effects of instability at low and high mean levels of valence. In contrast, medium mean values of valence might be related to high, medium, or low levels of instability. In other words, if one's mood is down all day, thereby resulting in the lowest mean mood possible, no instability remains; the same result is true for the best mood possible. However, tremendous changes in mood can occur at a medium average mood level. Accordingly, Ebner-Priemer et al. (2009) and Russell et al. (2007) proposed comparing groups with similar mean levels of mood or integrating the mean level as a covariate in the analyses. Although patients with BPD and clinical controls did not differ with regard to their mean levels of valence and distress (see the results section above and Table 2), we used these mean levels as covariates to err on the side of caution. However, this additional analysis did not change our findings with regard to the group differences in SSDs or PACs for distress or valence (results available upon request).
Sampling design
The time-sampling strategy is defined by the sampling rate (e.g., once daily, five times daily, or every quarter of an hour during waking time), the sampling strategy (i.e., fixed or random intervals), and the duration of the sampling episode (e.g., 24 hours, 1 week, or 1 month; for details, see Santangelo, Ebner-Priemer, & Trull, 2013). When investigating symptom dynamics, it is of primary importance that the sampling rate matches the temporal dynamics of the underlying target process (Ebner-Priemer & Sawitzki, 2007). For example, a sampling rate that is too infrequent might miss the dynamics of interest. Our study applied a high-frequency sampling rate with 15-min intervals. Unfortunately, virtually no empirical studies exist with regard to choosing an appropriate time-sampling strategy. One noteworthy exception is the paper by Ebner-Priemer and Sawitzki (2007), which addresses the influence of different time intervals on the affective instability among patients with BPD. The authors showed that high-frequency sampling rates (15 minutes and 30 minutes) track a specific process, whereas the data yielded by low-frequency sampling rates (1 hour, 2 hours, and 4 hours) cannot be distinguished from random data. Given this information and the general notion that, when in doubt, it is better to use shorter intervals (Bolger, Davis, & Rafaeli, 2003), we assume that our sampling frequency was appropriate.
Alternative Explanations
Affective instability diagnostic criterion
To investigate whether the missing specificity of affective instability in our BPD group was caused by clinical controls who met the IPDE criterion of affective instability or patients with BPD who did not meet this criterion, we reanalyzed the dataset using the 41 patients with BPD who met the DSM–IV affective instability criterion and the 19 clinical controls (11 patients with PTSD and eight patients with BN) who did not meet this criterion. This new analysis yielded the same results: no differences in the SSDs and PACs of valence or distress were found between the investigated groups (results available upon request). Therefore, our data do not support the hypothesis that clinical controls who met the IPDE criterion of affective instability can explain our findings.
Adverse childhood events
Finally, we investigated whether the high rate of adverse childhood events present across all patient groups influenced the missing specificity of affective instability in the BPD group. As such, we analyzed type of abuse or neglect (physical, sexual, and emotional) and time of occurrence. We hypothesized that adverse childhood events were an underlying condition for affective instability. However, neither the type of abuse or neglect nor the time of occurrence predicted affective instability.
Affective Instability: A Transdiagnostic or a Disorder-Specific Mechanism?
In summary, using state-of-the-art methodology, we were unable to demonstrate that global affective instability is specific to patients with BPD compared with clinical controls (i.e., patients with PTSD or those with BN). On the one hand, this result is surprising, given that the affective instability criterion is specific to BPD; on the other hand, emotion regulation strategies are included as treatment modules across numerous disorders (e.g., Courbasson, Nishikawa, & Dixon, 2012; Harley, Sprich, Safren, Jacobo, & Fava, 2008; Roosen, Safer, Adler, Cebolla, & van Strien, 2012; Steil, Dyer, Priebe, Kleindienst, & Bohus, 2011). This finding suggests that affective instability might be an important clinical characteristic of several disorders, such as a transdiagnostic symptom or risk factor (for details on the ongoing discussion of trans-diagnostic symptoms and its research implications see, e.g., Aldao, Nolen-Hoeksema, & Schweizer, 2010; Buckholtz & Meyer-Lindenberg, 2012; Hyman, 2010; Nolen-Hoeksema & Watkins, 2011).
Although global affective instability was not specific to the patients with BPD in our sample, we assume that differences exist in the emotional processes between patients with BPD and clinical controls. Differences might exist regarding 1) the events and triggers of emotional episodes; 2) the subcomponents of the dynamic processes (e.g., sensitivity, reactivity, and slow return to baseline); and 3) the appraisal of affective instability.
Events and triggers of emotional episodes
We did not assess emotionally relevant events or triggers (e.g., interpersonal events, traumatic memories or tempting food) during the 24-hr assessment period. Because events or triggers might differ between groups, this construct should be investigated in future studies.
Subcomponents of dynamic processes
Several theoretical models of affective instability specify distinct subcomponents. For example, Linehan's (1993) biosocial theory addresses the high sensitivity to emotional stimuli, intense responses to emotional stimuli, and the slow return to baseline. More recently, Kuppens, Oravecz, and Tuerlinckx (2010) proposed a theoretical and statistical model (DynAffect) to divide global affective instability into three components: affective home base, affective variability, and attractor strength. Future studies should address the subcomponents of affective instability to investigate their potential to reveal group specificities.
Appraisal of affective instability
Patients with BPD and those with other clinical disorders might differ with regard to the appraisal of affective instability. In addition to affective instability, self-esteem instability is an important BPD feature. Affective changes that are accompanied by changes in self-esteem might be experienced as more threatening. For example, a sudden valence drop from a positive (e.g., +8) to a negative state (e.g., −2) in a patient with BPD, accompanied by a similar drop in self-esteem, might be experienced and reported as more significant than a similar valence drop in a patient with PTSD but a stable self-esteem. Although this theory has not yet been investigated in patients with BPD, these speculations would match the findings showing that individuals with unstable self-esteem are more reactive to daily events (Greenier et al., 1999; Kernis et al., 1998; Meier, Semmer, & Hupfeld, 2009). Thus, the association between affective instability and self-esteem instability in patients with BPD and those with other psychiatric disorders should be investigated in future studies.
In summary, our study revealed three major points. First, affective instability is evident in patients with BPD and in patients with several other psychiatric disorders, including PTSD and BN. Second, a state-of-the-art methodology revealed a consistent pattern of affective instability, regardless of the specific statistical indices or the concepts of instability or affect used. Third, our findings highlight the importance of multiple sampling approaches in the study of psychopathology. Only studies with clinical and healthy controls allow for valid conclusions regarding the specificity or the transdiagnostic nature of psychopathological symptoms.
Contributor Information
Philip Santangelo, Department of Sport and Sport Science, Karlsruhe Institute of Technology, Karlsruhe, Germany.
Lutz Mussgay, Psychosomatic Clinic St. Franziska-Stift, Bad Kreuznach, Germany.
Günther Sawitzki, Statlab, Institute for Applied Mathematics, University of Heidelberg, Germany.
Timothy J. Trull, Department of Psychological Sciences, University of Missouri-Columbia
Iris Reinhard, Department of Biostatistics, Central Institute of Mental Health Mannheim, Germany.
Regina Steil, Department of Psychology and Sports Sciences, Johann Wolfgang Goethe University, Frankfurt, Germany.
Christoph Klein, Department of Child and Adolescent Psychiatry and Psychotherapy, Freiburg University, Germany and School of Psychology, Bangor University, United Kingdom.
Martin Bohus, Central Institute of Mental Health, Medical Faculty Mannheim, Heidelberg University, Germany.
Ulrich W. Ebner-Priemer, Department of Sport and Sport Science, Karlsruhe Institute of Technology, Karlsruhe, Germany and Central Institute of Mental Health, Mannheim, Germany
References
- Aldao A, Nolen-Hoeksema S, Schweizer S. Emotion-regulation strategies across psychopathology: A meta-analytic review. Clinical Psychology Review. 2010;30:217–237. doi: 10.1016/j.cpr.2009.11.004. [DOI] [PubMed] [Google Scholar]
- American Psychiatric Association. Diagnostic and statistical manual of mental disorders. 5th. Arlington, VA: American Psychiatric Publishing; 2013. [Google Scholar]
- Anestis MD, Peterson CB, Bardone-Cone AM, Klein MH, Mitchell JE, Crosby RD, et al. Joiner TE. Affective lability and impulsivity in a clinical sample of women with bulimia nervosa: The role of affect in severely dysregulated behavior. International Journal of Eating Disorders. 2009;42:259–266. doi: 10.1002/eat.20606. [DOI] [PMC free article] [PubMed] [Google Scholar]
- Anestis MD, Selby EA, Crosby RD, Wonderlich SA, Engel SG, Joiner TE. A comparison of retrospective self-report versus ecological momentary assessment measures of affective lability in the examination of its relationship with bulimic symptomatology. Behaviour Research and Therapy. 2010;48:607–613. doi: 10.1016/j.brat.2010.03.012. [DOI] [PMC free article] [PubMed] [Google Scholar]
- Bernstein DP, Fink L, Handelsman L, Foote J, Lovejoy M, Wenzel K, et al. Ruggiero J. Initial reliability and validity of a new retrospective measure of child abuse and neglect. The American Journal of Psychiatry. 1994;151:1132–1136. doi: 10.1176/ajp.151.8.1132. [DOI] [PubMed] [Google Scholar]
- Bohus M, Limberger M, Frank U, Chapman A, Kühler T, Stieg-litz RD. Psychometric properties of the Borderline Symptom List (BSL) Psychopathology. 2007;40:126–132. doi: 10.1159/000098493. [DOI] [PubMed] [Google Scholar]
- Bolger N, Davis A, Rafaeli E. Diary methods: Capturing life as it is lived. Annual Review of Psychology. 2003;54:579–616. doi: 10.1146/annurev.psych.54.101601.145030. [DOI] [PubMed] [Google Scholar]
- Buckholtz JW, Meyer-Lindenberg A. Psychopathology and the human connectome: Toward a transdiagnostic model of risk for mental illness. Neuron. 2012;74:990–1004. doi: 10.1016/j.neuron.2012.06.002. [DOI] [PubMed] [Google Scholar]
- Conklin CZ, Bradley R, Westen D. Affect regulation in borderline personality disorder. Journal of Nervous and Mental Disease. 2006;194:69–77. doi: 10.1097/01.nmd.0000198138.41709.4f. [DOI] [PubMed] [Google Scholar]
- Conner TS, Barrett LF. Trends in ambulatory self-report: The role of momentary experience in psychosomatic medicine. Psychosomatic Medicine. 2012;74:327–337. doi: 10.1097/PSY.0b013e3182546f18. [DOI] [PMC free article] [PubMed] [Google Scholar]
- Courbasson C, Nishikawa Y, Dixon L. Outcome of dialectical behaviour therapy for concurrent eating and substance use disorders. Clinical Psychology & Psychotherapy. 2012;19:434–449. doi: 10.1002/cpp.748. [DOI] [PubMed] [Google Scholar]
- Cowdry RW, Gardner DL, O'Leary KM, Leibenluft E, Rubinow DR. Mood variability: A study of four groups. The American Journal of Psychiatry. 1991;148:1505–1511. doi: 10.1176/ajp.148.11.1505. [DOI] [PubMed] [Google Scholar]
- de Falguerolles A, Friedrich F, Sawitzki G. A Tribute to J. Bertin's graphical data analysis. In: Bandilla W, Faulbaum F, editors. SoftStat '97 Advances in statistical software. Vol. 6. Heidelberg, Germany: Lucius & Lucius; 1997. pp. 11–20. [Google Scholar]
- Eaton LG, Funder DC. Emotional experience in daily life: Valence, variability, and rate of change. Emotion. 2001;1:413–421. doi: 10.1037/1528-3542.1.4.413. [DOI] [PubMed] [Google Scholar]
- Ebner-Priemer UW, Bohus M, Kuo J. Can retrospective interviews assess instability? A comparison of ambulatory assessment and expert interviews regarding DSM–IV criteria for borderline personality disorder. In: Sorbi MJ, Rüddel H, Bühring M, editors. Frontiers in stepped eCare–eHealth methods in behavioural and psychosomatic medicine. Utrecht, Netherlands: Utrecht University; 2007. pp. 25–37. [Google Scholar]
- Ebner-Priemer UW, Eid M, Kleindienst N, Stabenow S, Trull TJ. Analytic strategies for understanding affective (in)stability and other dynamic processes in psychopathology. Journal of Abnormal Psychology. 2009;118:195–202. doi: 10.1037/a0014868. [DOI] [PubMed] [Google Scholar]
- Ebner-Priemer UW, Kuo J, Kleindienst N, Welch SS, Reisch T, Reinhard I, Bohus M. State affective instability in borderline personality disorder assessed by ambulatory monitoring. Psychological Medicine. 2007;37:961–970. doi: 10.1017/S0033291706009706. [DOI] [PubMed] [Google Scholar]
- Ebner-Priemer UW, Sawitzki G. Ambulatory assessment of affective instability in borderline personality disorder - the effect of the sampling frequency. European Journal of Psychological Assessment. 2007;23:238–247. doi: 10.1027/1015-5759.23.4.238. [DOI] [Google Scholar]
- Ebner-Priemer UW, Trull TJ. Ambulatory assessment: An innovative and promising approach for clinical psychology. European Psychologist. 2009a;14:109–119. doi: 10.1027/1016-9040.14.2.109. [DOI] [Google Scholar]
- Ebner-Priemer UW, Trull TJ. Ecological momentary assessment of mood disorders and mood dysregulation. Psychological Assessment. 2009b;21:463–475. doi: 10.1037/a0017075. [DOI] [PubMed] [Google Scholar]
- Fahrenberg J, Myrtek M. Ambulatory assessment Computer-assisted psychological and psychophysiological methods in monitoring and field studies. Seattle, WA: Hogrefe & Huber; 1996. [Google Scholar]
- Fahrenberg J, Myrtek M, Pawlik K, Perrez M. Ambulatory assessment: Monitoring behavior in daily life settings. European Journal of Psychological Assessment. 2007;23:206–213. doi: 10.1027/1015-5759.23.4.206. [DOI] [Google Scholar]
- Farmer RF, Nash HM, Dance D. Mood patterns and variations associated with personality disorder pathology. Comprehensive Psychiatry. 2004;45:289–303. doi: 10.1016/j.comppsych.2004.03.009. [DOI] [PubMed] [Google Scholar]
- First MB, Spitzer RL, Gibbon M, Williams JB. User's guide for the structured clinical interview for DSM–IV personality disorders (SCID-II) Washington, DC: American Psychiatric Press; 1996. [Google Scholar]
- First MB, Spitzer RL, Gibbon M, Williams JB, Benjamin LS. User's guide for the structured clinical interview for DSM–IV Axis I disorders (SCID-I) - clinical version. Washington, DC: American Psychiatric Press; 1997. [Google Scholar]
- Foa EB, Cashman L, Jaycox L, Perry K. The validation of a self-report measure of posttraumatic stress disorder: The Posttraumatic Diagnostic Scale. Psychological Assessment. 1997;9:445–451. doi: 10.1037/1040-3590.9.4.445. [DOI] [Google Scholar]
- Fydrich T, Renneberg B, Schmitz B, Wittchen HU. SKID-II Strukturiertes klinisches Interview für DSM–IV Achse II: Persönlichkeitsstörungen. Göttingen, Germany: Hogrefe; 1997. Structured clinical interview for DSM-IV. Axis II: personality disorders. [Google Scholar]
- Gratz KL, Tull MT. Emotion regulation as a mechanism of change in acceptance- and mindfulness-based treatments. In: Bear RA, editor. Assessing mindfulness and acceptance processes in clients. Oakland, CA: New Harbinger Publications; 2010. pp. 107–133. [Google Scholar]
- Greenier KD, Kernis MH, McNamara CW, Waschull SB, Berry AJ, Herlocker CE, Abend TA. Individual differences in reactivity to daily events: Examining the roles of stability and level of self-esteem. Journal of Personality. 1999;67:187–208. doi: 10.1111/1467-6494.00052. [DOI] [PubMed] [Google Scholar]
- Harley R, Sprich S, Safren S, Jacobo M, Fava M. Adaptation of dialectical behavior therapy skills training group for treatment-resistant depression. Journal of Nervous and Mental Disease. 2008;196:136–143. doi: 10.1097/NMD.0b013e318162aa3f. [DOI] [PubMed] [Google Scholar]
- Harvey PD, Greenberg BR, Serper MR. The Affective Lability Scales: Development, reliability, and validity. Journal of Clinical Psychology. 1989;45:786–793. doi: 10.1002/1097-4679(198909)45:5<786::aid-jclp2270450515>3.0.co;2-p. doi:10.1002/1097-4679(198909)45: 5<786::AID-JCLP2270450515>3.0.CO;2-P. [DOI] [PubMed] [Google Scholar]
- Hyman SE. The diagnosis of mental disorders: The problem of reification. Annual Review of Clinical Psychology. 2010;6:155–179. doi: 10.1146/annurev.clinpsy.3.022806.091532. [DOI] [PubMed] [Google Scholar]
- Jahng S, Solhan MB, Tomko RL, Wood PK, Piasecki TM, Trull TJ. Affect and alcohol use: An ecological momentary assessment study of outpatients with borderline personality disorder. Journal of Abnormal Psychology. 2011;120:572–584. doi: 10.1037/a0024686. [DOI] [PMC free article] [PubMed] [Google Scholar]
- Jahng S, Wood P, Trull TJ. Analysis of affective instability in ecological momentary assessment: Indices using successive difference and group comparison via multilevel modeling. Psychological Methods. 2008;13:354–375. doi: 10.1037/a0014173. [DOI] [PubMed] [Google Scholar]
- Jones SH, Hare DJ, Evershed K. Actigraphic assessment of circadian activity and sleep patterns in bipolar disorder. Bipolar Disorders. 2005;7:176–186. doi: 10.1111/j.1399-5618.2005.00187.x. [DOI] [PubMed] [Google Scholar]
- Kahneman D, Fredrickson BL, Schreiber C, Redelmeier D. When more pain is preferred to less: Adding a better end. Psychological Science. 1993;4:401–405. doi: 10.1111/j.1467-9280.1993.tb00589.x. [DOI] [Google Scholar]
- Kahneman D, Riis J. Living, and thinking about it: Two perspectives on life. In: Huppert FA, Baylis N, Neverne B, editors. The science of wellbeing. Oxford, UK: Oxford University Press; 2005. pp. 285–304. [DOI] [Google Scholar]
- Kashdan TB, Uswatte G, Steger MF, Julian T. Fragile self-esteem and affective instability in posttraumatic stress disorder. Behaviour Research and Therapy. 2006;44:1609–1619. doi: 10.1016/j.brat.2005.12.003. [DOI] [PubMed] [Google Scholar]
- Kernis MH, Whisenhunt CR, Waschull SB, Greenier KD, Berry AJ, Herlocker CE, Anderson CA. Multiple facets of self-esteem and their relations to depressive symptoms. Personality and Social Psychology Bulletin. 1998;24:657–668. doi: 10.1177/0146167298246009. [DOI] [Google Scholar]
- Kuppens P, Oravecz Z, Tuerlinckx F. Feelings change: Accounting for individual differences in the temporal dynamics of affect. Journal of Personality and Social Psychology. 2010;99:1042–1060. doi: 10.1037/a0020962. [DOI] [PubMed] [Google Scholar]
- Larson R, Csikszentmihalyi M. The experience sampling method. New Directions for Methodology of Social & Behavioral Science. 1983;15:41–56. [Google Scholar]
- Leue A, Beauducel A. The PANAS structure revisited: On the validity of a bifactor model in community and forensic samples. Psychological Assessment. 2011;23:215–225. doi: 10.1037/a0021400. [DOI] [PubMed] [Google Scholar]
- Linehan MM. Cognitive-behavioral treatment of borderline personality disorder. New York, NY: The Guilford Press; 1993. [Google Scholar]
- Links PS, Eynan R, Heisel MJ, Barr A, Korzekwa M, McMain S, Ball JS. Affective instability and suicidal ideation and behavior in patients with borderline personality disorder. Journal of Personality Disorders. 2007;21:72–86. doi: 10.1521/pedi.2007.21.1.72. [DOI] [PubMed] [Google Scholar]
- Links PS, Heisel MJ, Garland A. Affective instability in personality disorders. The American Journal of Psychiatry. 2003;160:394–395. doi: 10.1176/appi.ajp.160.2.394-a. [DOI] [PubMed] [Google Scholar]
- Loranger AW, Sartorius N, Andreoli A, Berger P, Buchheim P, Channabasavanna SM, Regier DA. The International Personality Disorder Examination. Archives of General Psychiatry. 1994;51:215–224. doi: 10.1001/archpsyc.1994.03950030051005. [DOI] [PubMed] [Google Scholar]
- Meier LL, Semmer NK, Hupfeld J. The impact of unfair treatment on depressive mood: The moderating role of self-esteem level and self-esteem instability. Personality and Social Psychology Bulletin. 2009;35:643–655. doi: 10.1177/0146167208331337. [DOI] [PubMed] [Google Scholar]
- Mombour W, Zaudig M, Berger P, Gutierrez K, Berner W, Berger K, von Bose M. International Personality Disorder Examination (IPDE) Bern, Germany: Huber; 1996. [Google Scholar]
- Nolen-Hoeksema S, Watkins ER. A heuristic for developing transdiagnostic models of psychopathology: Explaining multifinality and divergent trajectories. Perspectives on Psychological Science. 2011;6:589–609. doi: 10.1177/1745691611419672. [DOI] [PubMed] [Google Scholar]
- Peeters F, Berkhof J, Delespaul P, Rottenberg J, Nicolson NA. Diurnal mood variation in major depressive disorder. Emotion. 2006;6:383–391. doi: 10.1037/1528-3542.6.3.383. [DOI] [PubMed] [Google Scholar]
- Pfaltz MC, Michael T, Grossman P, Margraf J, Wilhelm FH. Instability of physical anxiety symptoms in daily life of patients with panic disorder and patients with posttraumatic stress disorder. Journal of Anxiety Disorders. 2010;24:792–798. doi: 10.1016/j.janxdis.2010.06.001. [DOI] [PubMed] [Google Scholar]
- Robinson MD, Clore GL. Belief and feeling: Evidence for an accessibility model of emotional self-report. Psychological Bulletin. 2002;128:934–960. doi: 10.1037/0033-2909.128.6.934. [DOI] [PubMed] [Google Scholar]
- Roosen MA, Safer D, Adler S, Cebolla A, van Strien T. Group dialectical behavior therapy adapted for obese emotional eaters: A pilot study. Nutrición Hospitalaria. 2012;27:1141–1147. doi: 10.3305/nh.2012.27.4.5843. [DOI] [PubMed] [Google Scholar]
- Russell JJ, Moskowitz DS, Zuroff DC, Sookman D, Paris J. Stability and variability of affective experience and interpersonal behavior in borderline personality disorder. Journal of Abnormal Psychology. 2007;116:578–588. doi: 10.1037/0021-843X.116.3.578. [DOI] [PubMed] [Google Scholar]
- Santangelo P, Bohus M, Ebner-Priemer UW. Ecological momentary assessment in borderline personality disorder: A review of recent findings and methodological challenges. Journal of Personality Disorders. 2012 doi: 10.1521/pedi_2012_26_067. Advance online publication. [DOI] [PubMed] [Google Scholar]
- Santangelo P, Ebner-Priemer UW, Trull TJ. Experience sampling methods in clinical psychology. In: Comer J, Kendall P, editors. The Oxford handbook of research strategies for clinical psychology. New York, NY: Oxford University Press; 2013. pp. 188–210. [Google Scholar]
- Sawitzki G. Bertin Plots R package (version 0.1-60) 2012 Retrieved from http://bertin.r-forge.r-project.org/
- Schimmack U, Grob A. Dimensional models of core affect: A quantitative comparison by means of structural equation modeling. European Journal of Personality. 2000;14:325–345. doi: 10.1002/1099-0984(200007/08)14:4<325::AID-PER380>3.0.CO;2-I. [DOI] [Google Scholar]
- Schimmack U, Oishi S, Diener E, Suh M. Facets of affective experiences: A new look at the relation between pleasant and unpleasant affect. Personality and Social Psychology Bulletin. 2000;26:655–668. doi: 10.1177/0146167200268002. [DOI] [Google Scholar]
- Selby EA, Doyle P, Wonderlich S, Crosby R, Engel S, Mitchell J. Momentary emotion surrounding bulimic behaviors in women with bulimia nervosa and borderline personality disorder. Journal of Psychiatric Research. 2012;46:1492–1500. doi: 10.1016/j.jpsychires.2012.08.014. [DOI] [PMC free article] [PubMed] [Google Scholar]
- Siever LJ, Torgersen S, Gunderson JG, Livesley WJ, Kendler KS. The borderline diagnosis III: Identifying endophenotypes for genetic studies. Biological Psychiatry. 2002;51:964–968. doi: 10.1016/S0006-3223(02)01326-4. [DOI] [PubMed] [Google Scholar]
- Solhan MB, Trull TJ, Jahng S, Wood PK. Clinical assessment of affective instability: Comparing EMA indices, questionnaire reports, and retrospective recall. Psychological Assessment. 2009;21:425–436. doi: 10.1037/a0016869. [DOI] [PMC free article] [PubMed] [Google Scholar]
- Steil R, Dyer A, Priebe K, Kleindienst N, Bohus M. Dialectical behavior therapy for posttraumatic stress disorder related to childhood sexual abuse: A pilot study of an intensive residential treatment program. Journal of Traumatic Stress. 2011;24:102–106. doi: 10.1002/jts.20617. [DOI] [PubMed] [Google Scholar]
- Stein KF. Affect instability in adults with a borderline personality disorder. Archives of Psychiatric Nursing. 1996;10:32–40. doi: 10.1016/S0883-9417(96)80084-7. [DOI] [PubMed] [Google Scholar]
- Stone AA, Shiffman SS. Ecological momentary assessment (EMA) in behavorial medicine. Annals of Behavioral Medicine. 1994;16:199–202. [Google Scholar]
- Stone AA, Shiffman S, Atienza AA, Nebeling L. The science of real-time data capture: Self-reports in health research. New York, NY: Oxford University Press; 2007. [Google Scholar]
- Stone AA, Shiffman SS, Schwartz JE, Broderick JE, Hufford MR. Patient non-compliance with paper diaries. British Medical Journal. 2002;324:1193–1194. doi: 10.1136/bmj.324.7347.1193. [DOI] [PMC free article] [PubMed] [Google Scholar]
- Terr LC. Childhood trauma: An outline and overview. The American Journal of Psychiatry. 1991;148:10–20. doi: 10.1176/ajp.148.1.10. [DOI] [PubMed] [Google Scholar]
- Thompson RJ, Mata J, Jaeggi SM, Buschkuehl M, Jonides J, Gotlib IH. The everyday emotional experience of adults with major depressive disorder: Examining emotional instability, inertia, and reactivity. Journal of Abnormal Psychology. 2012;121:819–829. doi: 10.1037/a0027978. [DOI] [PMC free article] [PubMed] [Google Scholar]
- Tragesser SL, Solhan M, Schwartz-Mette R, Trull TJ. The role of affective instability and impulsivity in predicting future BPD features. Journal of Personality Disorders. 2007;21:603–614. doi: 10.1521/pedi.2007.21.6.603. [DOI] [PubMed] [Google Scholar]
- Trull TJ, Ebner-Priemer UW. Ambulatory assessment. Annual Review of Clinical Psychology. 2013;9:151–176. doi: 10.1146/annurev-clinpsy-050212-185510. [DOI] [PMC free article] [PubMed] [Google Scholar]
- Trull TJ, Solhan MB, Tragesser SL, Jahng S, Wood PK, Piasecki TM, Watson D. Affective instability: Measuring a core feature of borderline personality disorder with ecological momentary assessment. Journal of Abnormal Psychology. 2008;117:647–661. doi: 10.1037/a0012532. [DOI] [PubMed] [Google Scholar]
- Vansteelandt K, Probst M, Pieters G. Assessing affective variability in eating disorders: Affect spins less in anorexia nervosa of the restrictive type. Eating Behaviors. 2013;14:263–268. doi: 10.1016/j.eatbeh.2013.03.004. [DOI] [PubMed] [Google Scholar]
- Wittchen HU, Wunderlich U, Gruschwitz S. Struk-turiertes klinisches Interview für DSM–IV Achse I. Göttingen, Germany: Hogrefe; 1997. SKID. SCID: Structured clinical interview for DSM–IV Axis I. [Google Scholar]
- World Health Organization. The ICD-10 Classification of Mental and Behavioural Disorders Clinical descriptions and diagnostic guidelines. Geneva, Switzerland: World Health Organization; 1992. [Google Scholar]
- Woyshville MJ, Lackamp JM, Eisengart JA, Gilliland JA. On the meaning and measurement of affective instability: Clues from chaos theory. Biological Psychiatry. 1999;45:261–269. doi: 10.1016/S0006-3223(98)00152-8. [DOI] [PubMed] [Google Scholar]
- Yen S, Shea MT, Sanislow CA, Grilo CM, Skodol AE, Gunderson JG, Morey LC. Borderline personality disorder criteria associated with prospectively observed suicidal behavior. The American Journal of Psychiatry. 2004;161:1296–1298. doi: 10.1176/appi.ajp.161.7.1296. [DOI] [PubMed] [Google Scholar]
- Zelenski JM, Larsen RJ. The distribution of basic emotions in everyday life: A state and trait perspective from experience sampling data. Journal of Research in Personality. 2000;34:178–197. doi: 10.1006/jrpe.1999.2275. [DOI] [Google Scholar]