

Abstract
A surface EMG signal represents the linear transformation of motor neuron discharge times by the compound action potentials of the innervated muscle fibers and is often used as a source of information about neural activation of muscle. However, retrieving the embedded neural code from a surface EMG signal is extremely challenging. Most studies use indirect approaches in which selected features of the signal are interpreted as indicating certain characteristics of the neural code. These indirect associations are constrained by limitations that have been detailed previously (Farina D, Merletti R, Enoka RM. J Appl Physiol 96: 1486–1495, 2004) and are generally difficult to overcome. In an update on these issues, the current review extends the discussion to EMG-based coherence methods for assessing neural connectivity. We focus first on EMG amplitude cancellation, which intrinsically limits the association between EMG amplitude and the intensity of the neural activation and then discuss the limitations of coherence methods (EEG-EMG, EMG-EMG) as a way to assess the strength of the transmission of synaptic inputs into trains of motor unit action potentials. The debated influence of rectification on EMG spectral analysis and coherence measures is also discussed. Alternatively, there have been a number of attempts to identify the neural information directly by decomposing surface EMG signals into the discharge times of motor unit action potentials. The application of this approach is extremely powerful, but validation remains a central issue.
Keywords: surface EMG, motor unit, motor neuron, neural drive to muscle, amplitude cancellation, coherence, rectification, spectral analysis, decomposition
the surface emg signal represents the electrical activity generated in muscle fibers in response to the activation provided by innervating motor neurons. The information contained in the EMG signal comprises a mixture of details about the synaptic inputs received by the motor neurons and the muscle fiber electrical properties, as indicated by the following description of a surface EMG signal:
| (1) |
where M is the number of active motor units, s(t) is the recorded EMG signal, tij is the j-th time at which the i-th motor unit discharges action potentials, φi(t) is the shape of the action potential for the i-th motor unit, and δ(t − tij) is the delta function representing a motor unit discharge at time tij.
In the model depicted by Eq. 1, which for simplicity does not include additive noise, the discharge times tij of the motor neurons are determined by the convergence of synaptic inputs from multiple sources within the central nervous system. The set of discharge times for the activated motor neurons, often referred to as the neural drive to muscle, contains information about a variety of synaptic inputs received by the motor neurons. These inputs are characterized and can be identified by their frequency bandwidths.
The influence of the electrical properties of the muscle fiber membranes on the EMG signal is expressed by the shapes of the motor unit action potentials φi(t) (Eq. 1). The EMG signal is often analyzed as an interference signal and mathematical descriptors provide information about the global characteristics of the signal. The generative model of the EMG in Eq. 1 indicates that it is not possible to extract physiological information from an interference EMG signal that is solely related either to the neural drive [δ(t − tij)] or to the muscle properties [φi(t)]. The measurement of EMG amplitude, for example, is frequently used to infer the intensity of the neural drive to the muscle even though it also depends on the properties of the muscle fiber membranes. Because the distribution of the shapes of action potentials varies across conditions, the amplitude-based estimate of neural drive to muscle contains some uncertainty. Similarly, the estimation of mean muscle fiber conduction velocity (33), a muscle fiber property, from the interference EMG signal is influenced by the discharge characteristics of the active motor units (31, 39, 77, 95), which are neural properties.
In general, the distribution of the energies and shapes of the motor unit action potentials will compromise any method that attempts to extract information about the neural drive from an interference EMG signal. This constraint limits the use of the surface EMG for assessing the neural information because the distribution of motor unit action potentials depends on factors that cannot be controlled or determined in experimental conditions. These factors include the thickness of subcutaneous tissues, the spatial distribution of muscle fibers, the distribution of muscle fiber conduction velocities, and the electrode location (13, 28, 31, 91).
In our previous review on this topic (31), the main emphasis was on amplitude cancellation and on the use of the frequency analysis of the EMG for studying motor unit recruitment strategies. Many of the problems we identified have been progressively acknowledged over the last 10 yr, sometimes after further discussion (34, 35, 102, 103). The present review provides an update on the extraction of information about the neural drive to muscle from EMG signals. As in our previous article (31), the current review focuses on selected issues and does not provide an extensive review of the methods for information extraction and processing from the EMG signal.
Indirect Analysis of Neural Strategies from the Interference EMG
As discussed in our previous review (31), the amplitude and spectral properties of a surface EMG signal have often been used to provide indirect measures of neural activation, such as details about the intensity of the neural drive or motor unit recruitment strategies. In the following, we provide an update on these practices and then broaden the discussion to the use of coherence methods for studying neural connectivity.
Amplitude cancellation.
The most basic approach to extract information from an EMG signal is to estimate its amplitude. Because the EMG signal has random components, its amplitude cannot be defined on the basis of specific waveform features, such as the peak value, but rather needs statistical estimators. In signal processing terminology, the EMG is a colored stochastic process, a random signal with limited bandwidth, and its amplitude is its standard deviation, which is the square root of the power (8). Given the EMG signal model of Eq. 1 and assuming the trains of action potentials discharged by the active motor neurons are not correlated, the standard deviation (amplitude) σEMG of the EMG signal is theoretically obtained with the following expression:
| (2) |
where σi and Pi are the amplitude and power for the train of the action potentials discharged by the i-th motor unit (σi2 = Pi), DRi is the average discharge rate of the i-th motor unit, and Ei is the energy of the action potential of the i-th motor unit. In Eq. 2, DRi represents the influence of the neural drive and Ei denotes the contribution of action potential shapes to the estimate of signal amplitude. Equation 2 indicates that the EMG amplitude 1) increases monotonically when either the discharge rates or the number of active motor units increase; thus it is directly associated with the neural drive to muscle; and 2) depends on both the neural drive (discharge rates, DRi) and the properties (energy, Ei) of the action potentials, without the possibility of distinguishing between the two effects. Normalization methods, such as dividing an EMG signal by the amplitude recorded at the maximal force (73), attempt to reduce the influence of the distribution of action potential energies in the right-hand side of Eq. 2. However, Eq. 2 indicates that complete elimination of the influence of action potential energies is only possible when all motor unit action potentials have the same energy.
Equation 2 also indicates that the estimation of EMG amplitude from an interference signal is less than that obtained by summing the amplitudes of the individual motor unit action potentials, which is a phenomenon referred to as amplitude cancellation (11, 61). Formally, amplitude cancellation is due to the following inequality:
| (3) |
The amplitude cancellation term corresponds to the difference between the sum of the amplitudes of the action potential trains σi and the amplitude of the EMG, σEMG. Because the difference between the two estimates of EMG amplitude depends on the number of activated motor units (Eq. 3), amplitude cancellation increases monotonically with an increase in the neural drive to muscle. Moreover, amplitude cancellation is greatest when the action potential shapes are the same for all motor units (36), and in this instance EMG amplitude is proportional to the square root of the neural drive to muscle (Eq. 3).
Amplitude cancellation differs among motor units and depends on the ratio between the amplitude of the motor unit action potential and the amplitude of the EMG signal (36). For example, motor unit action potentials with a root mean square amplitude less than that for the interference EMG are cancelled by >60% (see Fig. 2 in Ref. 36). Because surface-recorded action potentials of low-threshold motor units tend to be smaller, amplitude cancellation generally reduces the contribution of low-threshold motor units to the estimate of EMG amplitude derived from an interference signal. Consequently, estimates of surface EMG amplitude can be relatively insensitive to changes in the activity of low-threshold motor units. For example, Mottram et al. (78) found that the discharge rate of low-threshold motor units decreased more rapidly during one type of fatiguing contraction compared with another type, whereas the change in the amplitude of the surface EMG was similar during the two tasks. Due to this effect, indexes of neural drive to the muscle based on EMG amplitude, such as the concept of neuromuscular efficiency (18), largely reflect the activity of high-threshold motor units.
Fig. 2.

Sensitivity of surface EMG power spectral frequencies to motor unit activity. An integrated model developed by Dideriksen et al. (19) was used to simulate a fatiguing contraction. The model includes the modulation of motor unit activity and the electrophysiological and contractile properties of the muscle fibers by feedback derived from metabolic factors. The simulated protocol included an up-down ramp contraction to 30% of maximal voluntary contraction (MVC) force, a 140-s contraction sustained at 30% MVC force, and a final ramp contraction similar to the 1st one (A). The model predicted a decrease in peak force for the 2nd ramp contraction after the fatiguing contraction (B). The motor units were recruited and derecruited during the up and down phases of the ramp contractions. Discharge times are shown for every 10th motor unit (C). There was more motor unit activity during the 2nd ramp contraction. A bipolar surface EMG signal (D) was simulated with the volume conductor model proposed in Farina et al. (32), with parameters described by Keenan et al. (63). The instantaneous mean frequency (IMF) was computed from the spectrogram of the surface EMG signals simulated during the 2 ramp contractions (E). There was no association between the estimates of instantaneous mean frequency and the recruitment and derecruitment of motor units during the ramp contractions. Moreover, the estimated mean frequency was less during the 2nd ramp despite greater motor unit activity, indicating that the approach cannot detect the recruitment of motor units during fatiguing contractions.
The influence of amplitude cancellation on the representation of motor unit activity in the surface EMG is shown in Fig. 1. In this simulation, 300 motor units were active during a sustained muscle contraction in which the discharge rates of 50 low-threshold motor units decreased progressively over time during a fatiguing contraction to half of their initial values. Despite the decrease in discharge rate for 17% of the activated motor units, the estimated EMG amplitude remained relatively constant during the simulated 5-s contraction due to the small influence of these motor units on the overall signal amplitude. This example illustrates the tendency of amplitude cancellation to reduce the relative contribution of individual or groups of motor units to estimates of EMG amplitude.
Fig. 1.
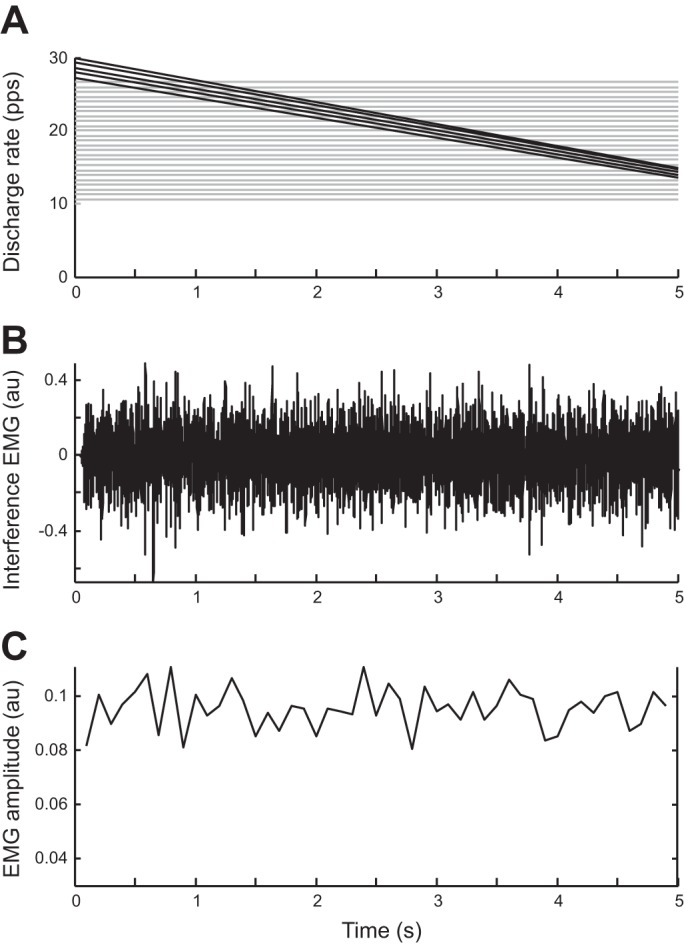
The influence of amplitude cancellation on the contribution of low-threshold motor units to EMG amplitude estimated from an interference signal. The activities of 300 motor units were simulated during a 5-s contraction. The motor unit sizes (number of muscle fibers) were distributed exponentially (44). The discharge rates of the 300 motor units were uniformly distributed between 10 pulses per second (pps) (high-threshold units) and 30 pps (low-threshold units) in inverse order of size. A: average discharge rates are shown for every 10th motor unit as a function of time. The lines indicate the discharge rates of every 10th motor unit. In this simulation, discharge rates were inversely related to recruitment threshold (15). The 50 motor units with the lowest recruitment thresholds (thicker lines) experienced a 50% linear decrease in discharge rate during the simulated contraction. Discharge rate did not change for the other 250 motor units. B: bipolar surface EMG signal has been simulated with a cylindrical volume conductor model (32). The motor unit territories were distributed randomly in the simulated muscle tissue, with simulation parameters for the volume conductor identical to Keenan et al. (63). Average discharge rates were similar to those described in A. C: amplitude of the simulated surface EMG signal was estimated for 100-ms intervals as average of the EMG after rectification (average rectified value). EMG amplitude remained relatively constant during the simulated contraction indicating that it is insensitive to significant changes in discharge rates of the low-threshold units; au, arbitrary units.
Moreover, rectification of an EMG signal does not eliminate the influence of amplitude cancellation (11, 61). A rectified EMG signal has the same amount of amplitude cancellation as an interference EMG signal. Consequently, the amplitude of a spike-triggered average derived from a rectified EMG signal depends on the amount of amplitude cancellation (36, 62).
In contrast to the effect of amplitude cancellation on estimates of EMG amplitude, the square of each term in Eq. 2 indicates that the power of an interference EMG signal is the sum of the powers of the trains of motor unit action potentials (provided the trains of motor unit action potentials are uncorrelated). Amplitude cancellation indeed does not influence the power spectrum (i.e., the distribution of signal power across frequencies) of an interference EMG signal: the power spectra of uncorrelated trains of motor unit action potentials add linearly to generate the power spectrum of the interference EMG signal. Similarly, EMG rectification does not influence the total signal power, which is obtained by integrating the squared signal and dividing by the time interval of the integral. Thus the power of the rectified EMG is equal to the power of the interference EMG. Nonetheless, the distribution of power across frequencies (power spectrum) changes with rectification because it is a nonlinear operator and is influenced by cancellation: the power spectrum of a rectified EMG signal is not equal to the sum of the power spectra of the rectified trains of motor unit action potentials (41). Due to this effect, the spectral peak of an interference EMG signal corresponding to the average motor unit discharge rate is not consistently augmented by rectification (31). Claims to the contrary (79) are based on neglecting the cancellation term in the power spectrum of the rectified EMG (see also EMG rectification and coherence analysis).
These observations lead to several conclusions, some of which were partially presented in our previous review (31) and discussed in subsequent work (36, 41, 59, 61, 62). First, EMG amplitude derived from a global measure of muscle activity underestimates the sum of the amplitudes of the trains of motor unit action potentials, and the magnitude of the deficit cannot be predicted or compensated (61). Consequently, EMG amplitude provides only a crude estimate of the neural drive to muscle (31). Second, because amplitude cancellation increases monotonically with the level of muscle activity, the intensity of the neural drive to muscle is the main determinant of the degree of amplitude cancellation (36, 61). Third, the amount of amplitude cancellation differs across motor units and is greatest for small surface-recorded action potentials, which usually are associated with low-threshold motor units (36). Fourth, the rectified EMG has the same degree of amplitude cancellation as an interference EMG, but amplitude cancellation only influences the power spectrum of a rectified EMG signal and not an interference EMG signal (41). The latter conclusion is critical for the use of signal rectification in coherence analysis (see EMG rectification and coherence analysis).
EMG spectral analysis and motor unit type.
In our previous review (31), we criticized the use of spectral properties extracted from a surface EMG signal for inferring details about the recruitment of motor units. This practice is based on the observation that muscle fiber conduction velocity, which sometimes is associated with different motor unit properties, scales the EMG power spectrum (69, 94): slower conduction velocities are associated with lower frequencies in the power spectrum. This approach is compromised, however, by the absence of a physiological distinction between purported motor unit types (25, 31, 34, 35, 100) and the influence of the intracellular action potential shape and of the volume conductor on the surface action potential power spectra (28, 30). For example, the difference between a surface action potential generated by a motor unit with relatively high conduction velocity (high threshold) and that generated by a motor unit with lower conduction velocity (lower threshold) may be compensated by a different average distance between the two motor units and the recording electrodes (volume conductor effect) (see Fig. 3 in Ref. 31). Following our previous review (31), there was a more detailed discussion of this issue (34, 35, 102, 103) and it is now recognized that these limitations render the approach meaningless for the vast majority of situations. The number of studies that have used this approach has decreased over the last 10 yr, although inappropriate interpretations of EMG power spectra are still being published (e.g., Ref. 89).
Fig. 3.

Transformation of synaptic input received by a motor neuron into an output signal. A: train of delta functions modulated at a frequency of 20 Hz is convolved by an excitatory postsynaptic potential (EPSP) to simulate the input to a motor neuron (the convolution by the EPSP is not shown). The motor neuron (grey circle) is simulated as a perfect integrate-and-fire neuron. The output of the motor neuron contains the spectral component of the input at 20 Hz as well as additional harmonics that were not present in the input signal. Serial transmission of the output signal from the 1st neuron to a 2nd neuron will distort the original input signal (20 Hz) even more. B: distribution of the same (common) input to multiple neurons will preserve the original information in the average output signal of the involved neurons. In the absence of noise, in this example, 3 neurons are sufficient for an accurate transmission of a 20-Hz oscillation in the input signal into the average output signal.
The use of EMG spectra to infer information about motor unit activity is even more compromised during sustained contractions when the neural drive and muscle properties vary over time. As an example of these complications, Fig. 2A shows the results of simulated ramp contractions performed before (left) and after (right) a fatiguing contraction with the model proposed by Dideriksen et al. (19). The ramp contractions involved a gradual increase in the simulated force and then a gradual decrease (Fig. 2B). The simulated EMG signals were analyzed with a time-frequency method (spectrogram) (66). In this simulation, motor units were recruited and derecruited according to the size principle (44) during each ramp (Fig. 2C), which resulted in progressive increases and decreases in the amplitude of the interference EMG signal (Fig. 2D). The recruitment and derecruitment were also related to the conduction velocity of the innervated muscles fibers in that higher threshold motor units had greater conduction velocities (1). Moreover, conduction velocity decreased during the sustained contraction and there was a greater amount of motor unit activity during the ramp contraction after the fatiguing contraction (Fig. 2, C and D). Despite significant modulation of motor unit activity during the ramp contractions, the instantaneous mean frequency of the EMG remained relatively constant (Fig. 2E). Moreover, the instantaneous mean frequency was lower after the fatiguing contraction despite the greater amount of motor unit activity.
Neural connectivity.
EMG signals are also often analyzed to extract information about the synaptic input received by the motor neurons and thereby to derive an indirect measure of the excitation signal received by motor neurons. These approaches are frequently used to quantify the strength of connections between different parts of the nervous system. For example, the linear correlation in the frequency domain (coherence) between EEG (or other cortical signals) and concurrently recorded EMG has been extensively used to quantify the strength of corticospinal input to motor neurons (2, 9, 47, 92). The connection is indicated by the value of EEG-EMG coherence in the beta band (15–30 Hz). Similarly, the coherence between EMG signals recorded from two muscles has been used to assess the strength and frequency of the common synaptic input received by the motor neurons innervating the two muscles (6, 10, 24). The same approach has been applied to EMG signals measured from two locations over the same muscle to estimate the common input to the motor neuron pool (48).
Because coherence methods are based on the assumption of a linear association between signals, it may seem inappropriate for them to be used to estimate the strength of association between signals derived from the nonlinear transformation of inputs into outputs by motor neurons. Subsequent sections indicate how this limitation is attenuated by the parallel distribution of common input to multiple motor neurons.
Linear transmission of common input by motor neurons.
Oscillatory inputs arising from either cortical or peripheral sources are transmitted to the motor neuron output via a nonlinear transformation that distorts the input signal when it is processed by a motor neuron. Figure 3 shows this property by simulating neurons as perfect integrate-and-fire systems. When a simple sinusoidal input is transformed by a motor neuron into a train of motor unit action potentials (Fig. 3A), the output signal is modulated at both the frequency present in the input signal and other frequencies (harmonics) not present in the input signal. The additional harmonics in the output signal can be seen as noise with respect to the linear transmission of the input harmonic. The noise increases progressively when the signal is processed by a series of neurons in a pathway (Fig. 3A). The frequency and phase of the added harmonics differ for each motor neuron (80, 82). The frequencies added to the output signal by the nonlinearity of the motor neurons are equivalent to independent components across the motor neuron outputs. Because the cumulative output signal produced by a set of motor neurons, neural drive to the muscle, represents an average output signal of the motor neurons, the common components are augmented relative to the independent components derived from the nonlinearity (Fig. 3B). Transmission of an oscillatory signal by the central nervous system, therefore, is most effectively accomplished by distributing the input signal to sets of neurons.
The transmission of oscillations embedded in synaptic input into the neural drive to muscle is approximately linear when a sufficient number of motor neurons receive the input concurrently. Relatively few motor neurons need to receive the common input to achieve linear transmission of oscillations (82). Moreover, the averaging in the cumulative output train of action potentials enhances the common input against both the components introduced by the nonlinearity of the motor neurons (Fig. 3) and the components in the input to the motor neurons that are independent across motor neurons. The results of a simulation shown in Fig. 4 indicate how the number of motor neurons influences the transmission of the spectral characteristics of a common input signal into those of the cumulative output signal when both nonlinearities and independent input components are present. The progressive distribution of a common input signal is able to attenuate the influence of independent inputs and nonlinearity on the characteristics of the output signal (43). At low forces, however, there may be too few active motor neurons to ensure exact transmission of common input to the neural drive to muscle, which would influence the precision of the force generated by a muscle. For example, at forces less than ∼10% of maximum, but not at higher forces, synaptic noise (independent input) can have an influence on force steadiness (20, 85).
Fig. 4.

Transmission of common synaptic input by a set of motor neurons. Motor neurons were simulated as perfect integrate-and-fire neurons that received a common input signal, whose spectral representation is shown at left. Each motor neuron also received an independent input (indicated by the top and bottom traces at left) with a larger bandwidth (0–50 Hz). The signal-to-noise ratio (SNR) between the common input and the independent input was 0.08, so that the power of the common input was only 8% of the power of the independent input for each motor neuron (note the different scales for the common and independent inputs). The cumulative output of the motor neurons, neural drive to the muscle, has a spectral representation (right; solid line) that converges to that for the common input (dashed line) as the number of motor neurons (MN) receiving the common input increases from 1 to 100.
The above considerations lead to the following fundamental observations when discussing the use of EMG for studying neural connectivity (42). First, the common input received by a set of motor neurons is transmitted linearly into the cumulative output (neural drive to the muscle), despite the nonlinearity of the transformation by individual motor neurons. Second, the inputs that are independent across motor neurons are also attenuated in the neural drive to muscle due to the averaging process. Third, the linearity in the transmission and the degree of attenuation of independent inputs depend on the number of motor neurons that receive the common input. Although these observations justify the use of coherence (linear) methods when investigating neural connectivity with EMG signals, the approach should be used with caution given the limitations described in the following sections.
EEG-EMG coherence and the strength of corticospinal input.
Oscillations at ∼20 Hz that are present in EEG signals in humans (9, 87) are coherent with the surface EMG activity during sustained contractions (47, 92). It has been suggested that this observation, so-called corticomuscular coherence, indicates the effective transmission of cortical oscillations along the corticospinal tract and through the monosynaptic connections between cortical neurons and spinal motor neurons into trains of motor unit action potentials (2). The amount of significant coherence between cortical and muscular activity is assumed to indicate the strength of the supraspinal contributions to the output generated by spinal motor neuron. Accordingly, abnormal corticomuscular coupling has been found in pathological conditions (46), such as stroke (26, 98) and tremor (93, 104), and in healthy subjects during fatiguing contractions (99), peripheral nerve stimulation (50), and manipulation of afferent pathways (88, 90).
The observation of significant EEG-EMG coherence is explained by the linear transmission of synaptic input received by an adequate number of motor neurons. However, the use of EEG-EMG coherence to quantify the strength of corticospinal input is constrained by at least two factors. First, the neural drive to muscle is filtered by the motor unit action potentials (Eq. 1) and their shapes will confound the estimated coherence. This influence can be readily appreciated by comparing the coherence estimated between an EEG signal and EMG signals recorded from different electrode locations over the same muscle, which comprised different action potential shapes (Fig. 5). The comparison of EEG-EMG coherence across conditions in which the action potential shapes change substantially, such as fatiguing contractions (21, 23), exercise, or differences in subcutaneous layer thickness (27, 28), should thus be performed with caution.
Fig. 5.

Experimental EEG signals from the Cz location were recorded concurrently with EMG signals from the tibialis anterior muscle. The EMG signals were detected by 3 pairs of electrodes (8-mm interelectrode distance) placed at proximal, middle, and distal locations over the muscle during a 180-s contraction at 10% of the maximal MVC force. The distance between 2 adjacent pairs of bipolar electrodes was ∼20 mm in the longitudinal direction. EEG-EMG coherence was computed between the EEG recording and each of the 3 EMG signals. The coherence between the 2 signals was computed from the entire 180-s recording after removal of the intervals with artifacts in the EEG recording, such as due to eye blinking, by averaging the estimates over 5-s intervals. The horizontal dashed line in each coherence plot represents the confidence level. Despite similar shapes and peak frequency (∼19 Hz) for the 3 estimates of EEG-EMG coherence, peak coherence ranged from ∼0.15 to ∼0.3 across the 3 locations.
Second, the amount of EEG-EMG coherence can also be modulated by other sources of common input to motor neurons. Any common input, but not independent input, is transmitted through the active motor neurons. If the motor neurons receive a second source of common input, in addition to independent inputs and the common corticospinal input, its intensity will influence the estimate of corticomuscular coherence even when the relative proportion of corticospinal input does not vary (83). This type of modulation is referred to as decorrelation effect of secondary sources of common input (83). For example, a decrease in corticomuscular coherence during fatiguing contractions (106) can be partially explained by decorrelation due to changed (common) afferent input and does not necessarily indicate a decrease in the strength of corticospinal connection. The same decorrelation effect by secondary sources of common input will also be illustrated for EMG-EMG coherence.
EMG-EMG coherence.
Coherence between EMG signals from different muscles indicates the presence of common synaptic input to the motor neuron pools of the two muscles. The presence of multiple common synaptic inputs attenuates the capacity of coherence to estimate the strength of common input from a single source, as discussed for EEG-EMG coherence. The decorrelating influence of a second common input is illustrated in Fig. 6. In this example, the motor neuron pools of two muscles receive a common cortical input in the beta band and each of them also receives afferent input from the muscle it innervates. The estimated coherence changes substantially when the afferent input of any of the two muscles varies relative to the other sources of input (Fig. 6C), despite the absence of change in the relative strength of the cortical common input to the two muscles. The same effect can be demonstrated for corticomuscular coherence when common afferent input is added to the corticospinal input (83).
Fig. 6.

Influence of a secondary common synaptic input on EMG-EMG coherence. A: 2 simulated pools of MN receive 3 sources of synaptic input. The 1st is common to all motor neurons in both pools and is a cortical input, whose power spectrum is shown in B. The 2nd source simulates afferent input to each motor neuron pool. This input is assumed to be independent for the 2 motor neuron pools but common to all motor neurons within each pool. The 3rd source of input is an input independent for each neuron. The common afferent inputs and the independent inputs were simulated as colored noise processes with bandwidth 0–100 Hz. Each motor neuron was simulated as a perfect integrate-and-fire system. Each motor neuron pool innervates a different muscle, whose surface EMG signal was simulated using the volume conductor model described in Farina et al. (32). The EMG-EMG coherence between the 2 surface EMG signals of the 2 muscles was computed in 4 levels of common afferent input to 1 muscle (0, 10, 20, and 30% of total power). The total power of the 3 sources of input to each motor neuron pool was constant for all simulations and was normalized to 100%. The relative power of the cortical input was constant across all conditions and was set equal to 70% by altering the power of the independent inputs. For example, the 1st condition corresponded to 70% cortical input, 0% afferent input, and 30% independent input, whereas in the 2nd condition the powers were 70, 10, and 20%, and so on. Therefore, the strength of the common cortical input to the 2 muscles was identical for all conditions. Despite the invariance of the common cortical input, peak coherence ranged from 0.1 (30% afferent input) to 0.6 (0% afferent input) (C). Variation in the afferent input to the other muscle would have similar effects and concurrent variation of both afferent inputs would have additive effects.
In addition to the influence of a second source of common input, estimates of EMG-EMG coherence are confounded by the presence of EMG cross talk (12, 22, 29, 60), which is greatest for neighboring muscles. Methods to reduce the amount of cross talk and thereby improve estimates of EMG-EMG coherence have been proposed (60) but are based on the incorrect assumption that cross talk always increases the correlation between signals (see Ref. 31 for details). There are currently no analytical procedures that can eliminate cross talk in a recorded EMG signal.
Similar limitations apply when EMG-EMG coherence is used to assess the degree of common input to the same motor neuron pool (48, 86). This technique has been applied as a substitute for the coherence analysis between pairs of motor units within a muscle. Despite the limitations discussed, the fundamental flaw of this method is that groups of motor units from the same muscle will tend to generate the same cumulative train of motor unit action potentials. Indeed, for any given ratio between the powers of common and independent inputs to the motor neurons, the cumulative spike train of a group of motor neurons will average the common information and attenuate the independent components. Groups of motor units in the same muscle will thus tend to represent only their common input (43) (Fig. 4). Because surface EMG signals reflect the activity of many motor units, the coherence between EMG signals from the same muscle is relatively insensitive to the strength of common input with respect to independent input (level of synchronization) (84; see also Fig. 6 in Ref. 43). The neural information in the two EMG signals is quite similar and the variability in coherence values is mainly due to differences in the shapes of the action potentials.
EMG rectification and coherence analysis.
In some conditions, it is not possible to detect oscillations in the discharge times of motor units in the surface EMG power spectrum or in a coherence analysis. This occurs when an input frequency is outside the bandwidth of the surface motor unit action potentials (41, 42). For example, Fig. 7 presents the case of an oscillatory input at 6 Hz, which is too low to be detected in the surface EMG signal spectrum. It is not possible to recover such low input frequencies with linear filtering of the surface EMG because these methods act as a gain and phase shift of each frequency, and frequencies with null power will still have null power for any applied gain. However, it is possible to retrieve the information on the input frequency with nonlinear methods under some conditions. Nonlinear transformations can introduce power at frequencies not present in the original signal. One nonlinear transformation that has received considerable attention in the surface EMG literature in relation to coherence analysis is rectification (49, 74, 75).
Fig. 7.

Influence of nonlinear transformations and amplitude cancellation on the surface EMG. A: population of 300 motor neurons was excited at a level that corresponded to 20% of maximal excitation. The excitation was a constant and elicited an average discharge rate for each motor neuron that depended on its recruitment threshold and upon which was superimposed a 6-Hz oscillation. Insets: cumulative train of discharge times (spike train) and the surface EMG signal simulated as recorded by a bipolar system (10-mm interelectrode distance) in a volume conductor (63). The power spectral densities for each signal are also shown. Although the power spectrum of the cumulative train of discharge times shows a pronounced peak at the oscillatory input frequency (6 Hz), this peak is difficult to detect in the surface EMG signal due to the low signal power at the input frequency (A). However, rectification (EMG) recovers the peak by introducing power at low frequencies (A). Moreover, other nonlinear operators, such as square and logarithmic functions, can also recover the input information as well as rectification. B: same signals and spectra as in A are shown for an excitation level of 80%, which increased amplitude cancellation from 33% (A) to 65% (B). The nonlinear operators failed to augment the oscillatory input frequency (indicated by the arrows) in the presence of greater, but physiologically meaningful, levels of amplitude cancellation; nu, normalized units.
Rectification involves transforming negative values in a signal into equivalent positive values. Because rectification is considered to be an operation that augments the neural information of the signal relative to that associated with the shape of the action potentials, it is recommended as an initial step before performing coherence analysis (49). However, it is only possible to augment the oscillatory components of a neural input in the rectified EMG under some specific conditions.
The rectified EMG can be expressed as follows:
| (4) |
where the rectified signal, ∣s(t)∣, is the sum of the recorded signal with rectified action potentials and the cancellation signal, c(t), which is equal to the difference between the sum of the trains of rectified motor unit action potentials and the rectified EMG signal (a minus sign can be integrated in this definition). The sum of the trains of rectified motor unit action potentials, which is indicated by the first term on the right-hand side of Eq. 4, is referred to as the no-cancellation signal (61). The no-cancellation signal has identical neural information as the interference EMG signal but with rectified motor unit action potentials. Comparison of Eqs. 4 and 1 indicates that the rectified EMG signal has the same structure as the interference EMG signal except that the motor unit action potentials are rectified and there is the addition of the noise term c(t), whose power depends on the degree of amplitude cancellation. The rectified EMG, therefore, represents a noisy version of the no-cancellation EMG (note that the noise is correlated to the signal in this definition). Thus there is no obvious reason why rectification should be expected to augment the neural information (discharge times) embedded in an interference EMG signal. Because oscillatory components in the neural input are filtered by rectified action potentials and are subject to an additional noise term, rectification can only augment the oscillatory inputs (neural information) if the energy of the rectified action potentials at the input frequency is greater than that of the recorded action potentials (as usually occurs for low frequencies) and if the noise introduced by the cancellation term is limited (41, 42). Moreover, there is also no obvious reason why rectification should be a preferential nonlinear transformation over many other possible transforms.
The difficulty to detect synaptic inputs to the motor neurons at relatively low frequencies in the power spectrum of the surface EMG signal is shown in Fig. 7A for an input oscillation at 6 Hz. Nonetheless, rectification of the EMG signal can recover the input information that was transmitted by the involved motor neurons (Fig. 7A). Any nonlinear transformation that introduces power at low frequencies, specifically at 6 Hz in this example, will have a similar effect, as shown in Fig. 7A for the squaring and the logarithmic operators. The application of each of these nonlinear operators to the interference EMG signal is not equivalent to their application to each train of action potentials separately, unless there is no temporal overlap among action potentials. In all other conditions, a noise term, similar to that shown in Eq. 4, is introduced to characterize the difference between the application of the nonlinear operators to each action potential and to the interference signal. The specific noise term associated with each nonlinear transformation will depend on the intensity of muscle activation, as observed for rectification.
To influence of the noise term in extracting oscillatory inputs from the EMG, spectral representation is shown by simulating the same motor neuron pool and 6-Hz input (Fig. 7A) with an increased level of excitatory synaptic input to the motor neurons (Fig. 7B). In this instance, more motor neurons are recruited and discharge rates are greater, which increases both the amplitude of the interference EMG (Fig. 7B) and the power of the noise term due to the nonlinearity of the operators (rectification, square, logarithmic). The increase in amplitude cancellation greatly reduces the capacity of nonlinear transformations to identify oscillations in the input signal (Fig. 7B).
The model shown in Eq. 4 allows prediction of the effectiveness of nonlinear EMG signal transformations to identify oscillatory synaptic inputs and explains several separate empirical observations. For example, Ward et al. (105) recently showed that rectification can indeed improve coherence analysis at low contraction forces. Moreover, Boonstra and Breakspear (7) noted that the uniformity in shapes of the action potentials across motor units and the type of signal filtering had an influence on the effectiveness of EMG rectification in coherence analysis, which is explained by the influence of these factors on amplitude cancellation (36, 61).
The above considerations provide a clear view of the value and limits of rectification in EMG coherence analysis and can be summarized as follows (41). First, the rectified EMG is a noisy version of the no-cancellation EMG, where each action potential is rectified. Second, the noise term in the rectified EMG is the amplitude cancellation signal, as defined in Amplitude cancellation. The noise term for other nonlinear transformations has similar properties as amplitude cancellation and increases in magnitude with the intensity of muscle activity. Third, the spectral and coherence peaks associated with oscillatory input frequencies are amplified by nonlinear transformations, such as rectification, if the transformed action potentials have greater energy at the input frequency than the recorded action potentials and if the noise term introduced by the nonlinear operator is sufficiently small. Because this noise term always increases with the intensity of muscle activation, nonlinear transformations are only effective for coherence analysis at low contraction forces (Fig. 7).
Direct Analysis of Neural Strategies by Decomposing the EMG
Many of the limitations in the interpretation of the surface EMG are due to the signal containing information about the neural input (common and independent inputs) mixed with the shapes of the motor unit action potentials (Eq. 1). Separation of the two sources of information is challenging due to the absence of a priori information (51), such as the number of active motor units and the shapes of the action potentials. When the shapes of the action potentials discharged by the same unit differ less than those generated by other motor units, it is possible to distinguish the two sources of information. To verify this condition, Farina et al. (37) performed a simulation study to determine the proportion of motor units with unique surface action potentials; that is, action potentials that differed from those of all the other units in a representative sample. This approach does not depend on the method used to decompose the interference signal into its constituent trains of motor unit action potentials, but rather establishes limits for decomposition that are valid for any algorithm. The results indicated that only a small proportion of motor unit action potentials are unique when the recordings comprise a few channels of surface EMG signals. For example, <60% of the simulated motor units could be discriminated on the basis of the action potential shape with a recording system that comprises four channels (14). The remaining 40% of the simulated motor units had action potentials that were identical-within experimental variability-to those of at least one other motor unit. Although it may be possible to decompose the surface EMG signal from few recorded channels under some circumstances, the results do not generalize and the methods have only limited applicability.
The action potentials of the active motor units can only be distinguished with adequate spatial information, which requires many recording channels of the EMG signal. An increase in the number of channels in which each motor unit action potential is represented will increase the number of motor units that can be uniquely detected at the skin surface (37), rendering the decomposition challenge theoretically possible. To achieve this level of resolution, high-density surface EMG systems, with tens to hundreds of electrodes covering individual muscles, have been developed in several laboratories (4, 45, 56, 65, 67). In addition to their use for EMG decomposition, high-density electrode systems have also been used to map the electrical activity in muscle (64). This approach can provide robust force estimators from EMG amplitude (96), characterize the adjustments during fatiguing contractions (38, 97), and identify details about muscle architecture (67). In the present review, however, we focus only on the use of high-density EMG technology for decomposing the signal into individual trains of motor unit action potentials.
Among the methods developed to decompose a surface EMG signal, only the approach developed by Holobar and Zazula (51) and subsequently extended (54, 55) has been validated systematically. Decomposition accuracy has been reported as ∼95% for a range of conditions and muscles, including high levels of motor unit synchronization (54), strong forces [up to 70% maximal voluntary contraction (MVC)] (55), complex muscle architectures (72), and pathological EMG patterns (68). Figure 8 provides an example of this approach by showing the decomposition of high-density surface EMG signals into discharge times for nine motor units. The decomposition of concurrently recorded intramuscular EMG signals is also reported and compared with the surface EMG decomposition. This comparison of discharge times for three motor units that were detected in both the surface and intramuscular signals provides a measure of accuracy of the decomposition results.
Fig. 8.

Comparison of motor unit discharge times as identified by decomposing surface and intramuscular EMG recordings. A: surface (11 × 5 electrode grid) and intramuscular (2 Teflon-coated electrode wires) EMG systems were used to record the activity of motor units in the biceps brachii muscle during a contraction at 5% MVC force. Two surface EMG and 1 intramuscular EMG signals are shown. B: surface and the intramuscular signals were independently decomposed using the CKC algorithm (51) (grey spike trains) and the EMG Lab method (76) (black spike trains), respectively. Some of the decomposed motor units were observed in both the surface and the intramuscular EMG signals, so that a direct comparison of the 2 algorithms was possible. In this example, 6 motor units (1–6) were identified from the intramuscular EMG signals only, 5 from the surface EMG system only (10–14), and 3 by both systems (7–9). In B, middle, the grey circles represent action potentials detected from the surface EMG signal but not from the intramuscular EMG signal, whereas black circles are those action potentials identified in the intramuscular signal only. The rate of agreement (RA) between the 2 decomposition methods for the 3 common motor units ranged from ∼90 to ∼97% of the total number of detected action potentials. C: maps of the surface EMG amplitude as detected by the 11 × 5 surface electrode grid for each identified motor unit (1–14) obtained by spike-triggered averaging. The 11 traces in C, middle, indicate the spike-triggered averages recorded from the middle column and the 11 rows of the surface electrode grid. The amplitudes of the spike-triggered averages were greatest for those motor units that were discriminated from the surface EMG signals and least for those identified in the intramuscular signals only. In contrast, the bottom 2 rows indicate that the spike-triggered averages derived from the intramuscular action potentials for each motor unit (1–14) were greatest for those motor units discriminated in the intramuscular signals and least for those identified in the surface EMG signals only. RMS, root mean square. [© 2010 IEEE. Reprinted, with permission, from Holobar et al. (53).]
Validation of decomposition of surface EMG signals.
Surface EMG recordings are more difficult to decompose into motor unit discharge times than intramuscular EMG signals due to the greater number of overlapping action potentials in the surface signal. The rate at which motor unit action potentials overlap in an EMG signal can be estimated as (DR)2·d·I·(I − 1) (3), where DR is the average discharge rate [pulses per second (pps)] of the active motor units, d is the average duration (s) of the action potentials, and I is the number of motor units contributing to the signal. According to this estimate, an accurate surface EMG decomposition of 20 motor units discharging action potentials at 20 pps and with each surface-recorded action potential lasting 20 ms requires the resolution of ∼3,000 overlaps each second. In comparison, a selective intramuscular signal that comprises 3 motor units discharging at 20 pps and with 5-ms action potentials has an overlap rate of only 12 action potentials per second. These estimates are typical of the problems encountered when decomposing surface and intramuscular EMG signals.
The amount of overlap in surface EMG signals poses a challenge not only for the decomposition but also for judging the validity of a decomposition algorithm. Figure 9A provides an example of this difficulty based on recordings of a surface EMG signal detected by a bipolar system with 5-mm interelectrode distance during a contraction of the tibialis anterior muscle in which the subject tracked a single motor unit based on a concurrently recorded intramuscular EMG. Despite a low contraction force (∼2% MVC) and relatively high selectivity of the surface EMG electrode system (small interelectrode distance), the surface recording (top trace in Fig. 9A) shows a high level of interference from which it is impossible to identify individual motor unit action potential trains by visual inspection. This uncertainty is underscored by comparing the surface EMG recording with the concurrently recorded intramuscular EMG (bottom trace in Fig. 9A). Due to the difficulty in the visual identification of single motor unit activities in the surface EMG, any set of automatically decomposed discharge times could be interpreted as correct. Contrary to the intramuscular EMG that can be decomposed manually by an expert and for which the manual decomposition is often the gold standard to assess accuracy, it is not possible to decompose surface EMG signals manually.
Fig. 9.

Validation of a new “decomposition” algorithm based on the criteria described by Hu et al. (57). A: surface and intramuscular EMG signals were recorded concurrently during a contraction at ∼2% MVC force. The subject was provided with visual feedback on the discharge of a single motor unit from an intramuscular EMG recording (bottom trace). The motor unit with the greater amplitude action potentials was selected for the feedback signal. The algorithm described in the text identified the discharge times of several motor units in the surface EMG signal, which are indicated by the black circles. Although there was an association between the discharge of the target motor unit (triangles) and some of the discharge times detected by the algorithm, the rate of agreement was <15% even though the target motor unit had relatively high power in the surface EMG signal. B: despite the poor performance of the algorithm, spike-triggered averaging of the surface EMG signal from the discharge times identified by the new algorithm provide an action potential shape that was similar (correlation coefficient, 0.99) to that given as an output by the decomposition algorithm. This association disappeared for small perturbations (in the same range as in Ref. 57) of the discharge times, so that the correlation coefficient between the averaged potential with perturbed triggers and that provided by the algorithm decreased to only 0.27. C: progressive addition of the trains of decomposed action potentials (in order or in reverse order; filled and empty circles) produced correlation coefficients with the recorded EMG signal that increased monotonically, in contrast to the addition of perturbed discharge times (empty triangles) or random assignment of the decomposed action potentials to the trains of discharge times (black triangles). The results described in B and C have been interpreted as indicating the valid decomposition of a surface EMG signal (57), despite its inadequate performance as shown in A.
A convincing validation of surface EMG decomposition requires either that the method is applied to a sufficiently large number of test signals (53) or that it estimates the accuracy for each specific decomposed motor unit action potential train in a signal (signal-based accuracy) (55). In both cases, there is the need for valid performance indexes, although their validity may be counterintuitive. For example, Hu et al. (57) proposed intuitive criteria to judge the accuracy of an algorithm: 1) the averaged action potentials triggered by the decomposed trains of discharge times are highly correlated with the action potentials identified by the decomposition algorithm (but not if random variability is introduced in the triggers); and 2) the correlation between the original signal and the signal obtained by progressively adding the decomposed action potential trains is relatively high (but not after introducing variability in the identified discharge times). To assess the validity of these criteria, we implemented the approach in a de novo decomposition algorithm.
A single-channel surface EMG trace was decomposed by identifying the peak in the signal, extracting a segment of the signal around this peak, and detecting all other times when the extracted segment correlated with the signal above a fixed correlation threshold. The times when the correlation exceeded the threshold were assumed to indicate the discharge times of a single motor unit and detected by the algorithm. Moreover, the shape of the “motor unit action potential” associated with these discharge times was estimated by averaging the signal over the identified discharge times. The estimated motor unit action potential shape was finally subtracted from the signal at each estimated discharge time. These steps were applied iteratively to the residual signal until it had a power below a user-selected threshold. Such an algorithm will always extract “trains of discharge times” and produce corresponding “action potential shapes,” but the accuracy is poor in most cases. When this approach was tested on the signal in Fig. 9A, the greatest correspondence between discharge times detected by the surface and intramuscular EMG signals was indeed <15%. Nonetheless, when tested by the spike-triggered averaging method (Fig. 9B) or by the spike-train correlation method (Fig. 9C), as in Hu et al. (57), the algorithm appeared to be accurate (high correlation in the spike-triggered potentials and in the sum of extracted spike trains). Moreover, there are an infinite number of algorithms that would satisfy the criteria established by Hu et al. (57) without being accurate. This example is not meant to imply that any algorithm tested with this approach is necessarily inaccurate (as for our de novo “decomposition algorithm”) but rather that the proposed test does not provide an adequate validation and does not resolve the issue of testing accuracy.
Similarly, another method proposed to validate surface EMG decomposition, the reconstruct-and-test procedure (17, 81), involves generating a synthetic signal from the decomposed trains of action potentials and reapplying the same decomposition method to this synthetic signal to which noise is added with a power similar to that of the residual in the first decomposition (see Fig. 9 in Ref. 16). The accuracy with which each train of action potentials is identified is then estimated as the percentage of action potentials that are identified by the two decompositions with respect to the total. Because validation of the algorithm depends on the initial results and on the residual obtained with the decomposition algorithm, this method does not validate the accuracy of a decomposition algorithm, as discussed in detail by Farina and Enoka (40). The main problem with this method is that it will indicate high accuracy when the residual is minimized, which makes the two decomposed signals very similar, without necessarily maximizing the accuracy of the discrimination. Our concern is not on the decomposition algorithms that have been developed but rather the tests that have been used to establish their validity.
The only current reliable approach to assess the accuracy of a surface EMG decomposition algorithm is a method derived from the two-source approach, previously described by Mambrito and De Luca (71) for decomposing intramuscular EMG signals. This method consists of measuring surface and intramuscular EMG signals concurrently, decomposing the two signals with two appropriate algorithms, and then determining the rate of agreement in the discharge times discriminated from the two recordings (Fig. 8). This approach does not consider the intramuscular decomposition to be the gold standard but rather is based on the assumption that the result is likely correct (the probability of making the same mistake is low) when two independent decomposition algorithms are applied to two different signals and produce similar results. The accuracy obtained with this approach, which can be expressed as rate of agreement, is not biased to one of the decomposition methods (intramuscular vs. surface) but characterizes the relative performance of the two algorithms. The method developed by Holobar and Zazula (51) to decompose surface EMG signals has been tested with this approach for several muscles and conditions (52, 53, 55), including signals from pathological subjects (54). More recently, the decomposition algorithm proposed by DeLuca et al. (14) has been tested with the same approach for low contraction forces (<15% MVC) (58).
Although more limited than an experimental validation, the use of simulated signals also provides some confidence in the accuracy of a decomposition algorithm. Simulations of surface EMG signals have indeed become so accurate and realistic (5, 32, 19, 70) that their use is a valuable initial step in the process of validating a decomposition method (52).
Conclusions
Use of surface EMG signals to characterize neural activation is complicated by the signal containing information about both the neural drive to muscle and the electrical properties of muscle fibers. Amplitude, spectral, and coherence analysis of the surface EMG are influenced by this and other limitations, as we have detailed in the current review and its predecessor (31). Alternatively, much work over the last decade has expressed increasing confidence in the capacity of some algorithms to decompose a surface EMG signal into its constituent trains of motor unit action potentials. If valid, this approach would permit the direct extraction of information about the neural drive to muscle from surface EMG recordings, with advantages over intramuscular EMG due to the noninvasive approach and the possibility of identifying a greater number of motor units. However, valid accuracy tests involving concurrent intramuscular and surface EMG recordings need to be performed.
GRANTS
We acknowledge financial support by the European Research Council Advanced Grant DEMOVE (Contract No. 267,888; to D. Farina), by Compagnia di San Paolo and Fondazione CRT (to R. Merletti), and by the National Institute of Child Health and Human Development (to R. M. Enoka).
DISCLOSURES
No conflicts of interest, financial or otherwise, are declared by the author(s).
AUTHOR CONTRIBUTIONS
Author contributions: D.F., R.M., and R.M.E. conception and design of research; D.F., R.M., and R.M.E. prepared figures; D.F., R.M., and R.M.E. drafted manuscript; D.F., R.M., and R.M.E. edited and revised manuscript; D.F., R.M., and R.M.E. approved final version of manuscript.
ACKNOWLEDGMENTS
We sincerely thank Drs. Francesco Negro and Jakob L. Dideriksen for discussions on topics presented in this review article and for help in generating the data for some of the figures.
REFERENCES
- 1.Andreassen S, Arendt-Nielsen L. Muscle fibre conduction velocity in motor units of the human anterior tibial muscle: a new size principle parameter. J Physiol 391: 561–571, 1987. [DOI] [PMC free article] [PubMed] [Google Scholar]
- 2.Baker SN, Olivier E, Lemon RN. Coherent oscillations in monkey motor cortex and hand muscle EMG show task-dependent modulation. J Physiol 501: 225–241, 1997. [DOI] [PMC free article] [PubMed] [Google Scholar]
- 3.Bankman I, Johnson K, Schneider K. Optimal detection, classification, and superposition resolution in neural waveform recordings. IEEE Trans Biomed Eng 8: 836–841, 1993. [DOI] [PubMed] [Google Scholar]
- 4.Blok JH, van Dijk JP, Drost G, Zwarts MJ, Stegeman DF. A high-density multichannel surface electromyography system for the characterization of single motor units. Rev Sci Instrum 73: 1887–1897, 2002. [Google Scholar]
- 5.Blok JH, Stegeman DF, van Oosterom A. Three-layer volume conductor model and software package for applications in surface electromyography. Ann Biomed Eng 30: 566–577, 2002. [DOI] [PubMed] [Google Scholar]
- 6.Boonstra TW, Daffertshofer A, van As E, van der Vlugt S, Beek PJ. Bilateral motor unit synchronization is functionally organized. Exp Brain Res 178: 79–88, 2007. [DOI] [PubMed] [Google Scholar]
- 7.Boonstra TW, Breakspear M. Neural mechanisms of intermuscular coherence: implications for the rectification of surface electromyography. J Neurophysiol 107: 796–807, 2012. [DOI] [PubMed] [Google Scholar]
- 8.Clancy EA, Hogan N. Single site electromyograph amplitude estimation. IEEE Trans Biomed Eng 41: 159–167, 1994. [DOI] [PubMed] [Google Scholar]
- 9.Conway BA, Halliday DM, Farmer SF, Shahani U, Maas P, Weir AI, Rosenberg JR. Synchronization between motor cortex and spinal motoneuronal pool during the performance of a maintained motor task in man. J Physiol 489: 917–924, 1995. [DOI] [PMC free article] [PubMed] [Google Scholar]
- 10.Danna-Dos Santos A., Poston B., Jesunathadas M., Bobich LR, Hamm TM, Santello M. Influence of fatigue on hand muscle coordination and EMG-EMG coherence during three-digit grasping. J Neurophysiol 104: 3576–3587, 2010. [DOI] [PMC free article] [PubMed] [Google Scholar]
- 11.Day SJ, Hulliger M. Experimental simulation of cat electromyogram: evidence for algebraic summation of motor-unit action-potential trains. J Neurophysiol 86: 2144–2158, 2001. [DOI] [PubMed] [Google Scholar]
- 12.De Luca CJ, Merletti R. Surface myoelectric signal cross-talk among muscles of the leg. Electroencephalogr Clin Neurophysiol 69: 568–575, 1988. [DOI] [PubMed] [Google Scholar]
- 13.De Luca CJ. The use of surface electromyography in biomechanics. J Appl Biomech 13: 135–163, 1997. [Google Scholar]
- 14.De Luca CJ, Adam A, Wotiz R, Gilmore LD, Nawab SH. Decomposition of surface EMG signals. J Neurophysiol 96: 1646–1657, 2006. [DOI] [PubMed] [Google Scholar]
- 15.De Luca CJ, Erim Z. Common drive of motor units in regulation of muscle force. Trends Neurosci 17: 299–305, 1994. [DOI] [PubMed] [Google Scholar]
- 16.De Luca CJ, Hostage EC. Relationship between firing rate and recruitment threshold of motoneurons in voluntary isometric contractions. J Neurophysiol 104: 1034–1046, 2010. [DOI] [PMC free article] [PubMed] [Google Scholar]
- 17.De Luca CJ, Nawab SH. Reply to Farina and Enoka: the reconstruct-and-test approach is the most appropriate validation for surface EMG signal decomposition to date. J Neurophysiol 105: 983–984, 2011. [DOI] [PubMed] [Google Scholar]
- 18.Deschenes MR, Giles JA, McCoy RW, Volek JS, Gomez AL, Kraemer WJ. Neural factors account for strength decrements observed after short-term muscle unloading. Am J Physiol Regul Integr Comp Physiol 282: R578–R583, 2002. [DOI] [PubMed] [Google Scholar]
- 19.Dideriksen JL, Farina D, Baekgaard M, Enoka RM. An integrative model of motor unit activity during sustained submaximal contractions. J Appl Physiol 108: 1550–1562, 2010. [DOI] [PubMed] [Google Scholar]
- 20.Dideriksen JL, Negro F, Enoka RM, Farina D. Motor unit recruitment strategies and muscle properties determine the influence of synaptic noise on force steadiness. J Neurophysiol 107: 3357–3369, 2012. [DOI] [PMC free article] [PubMed] [Google Scholar]
- 21.Dimitrov GV, Arabadzhiev TI, Hogrel JY, Dimitrova NA. Simulation analysis of interference EMG during fatiguing voluntary contractions. Part II–changes in amplitude and spectral characteristics. J Electromyogr Kinesiol 18: 35–43, 2008. [DOI] [PubMed] [Google Scholar]
- 22.Dimitrova NA, Dimitrov V, Nikitin OA. Neither high-pass filtering nor mathematical differentiation of the EMG signals can considerably reduce cross-talk. J Electromyogr Kinesiol 12: 235–246, 2002. [DOI] [PubMed] [Google Scholar]
- 23.Dimitrova NA, Dimitrov GV. Interpretation of EMG changes with fatigue: facts, pitfalls, and fallacies. J Electromyogr Kinesiol 13: 13–36, 2003. [DOI] [PubMed] [Google Scholar]
- 24.Evans CM, Baker SN. Task-dependent intermanual coupling of 8-Hz discontinuities during slow finger movements. Eur J Neurosci 18: 453–456, 2003. [DOI] [PubMed] [Google Scholar]
- 25.Enoka RM. Muscle fatigue–from motor units to clinical symptoms. J Biomech 45: 427–433, 2012. [DOI] [PubMed] [Google Scholar]
- 26.Fang Y, Daly JJ, Sun J, Hvorat K, Fredrickson E, Pundik S, Sahgal V, Yue GH. Functional corticomuscular connection during reaching is weakened following stroke. Clin Neurophysiol 120: 994–1002, 2009. [DOI] [PMC free article] [PubMed] [Google Scholar]
- 27.Farina D, Rainoldi A. Compensation of the effect of sub-cutaneous tissue layers on surface EMG: a simulation study. Med Eng Phys 21: 487–497, 1999. [DOI] [PubMed] [Google Scholar]
- 28.Farina D, Cescon C, Merletti R. Influence of anatomical, physical and detection-system parameters on surface EMG. Biol Cybern 86: 445–456, 2002. [DOI] [PubMed] [Google Scholar]
- 29.Farina D, Merletti R, Indino B, Nazzaro M, Pozzo M. Cross-talk between knee extensor muscles. Experimental and model results. Muscle Nerve 26: 681–695, 2002. [DOI] [PubMed] [Google Scholar]
- 30.Farina D, Fosci M, Merletti R. Motor unit recruitment strategies investigated by surface EMG variables. J Appl Physiol 92: 235–247, 2002. [DOI] [PubMed] [Google Scholar]
- 31.Farina D, Merletti R, Enoka RM. The extraction of neural strategies from the surface EMG. J Appl Physiol 96: 1486–1495, 2004. [DOI] [PubMed] [Google Scholar]
- 32.Farina D, Mesin L, Martina S, Merletti R. A surface EMG generation model with multi-layer cylindrical description of the volume conductor. IEEE Trans Biomed Eng 51: 415–426, 2004. [DOI] [PubMed] [Google Scholar]
- 33.Farina D, Merletti R. Methods for estimating muscle fibre conduction velocity from surface electromyographic signals. Med Biol Eng Comput 42: 432–445, 2004. [DOI] [PubMed] [Google Scholar]
- 34.Farina D. Counterpoint: spectral properties of the surface EMG do not provide information about motor unit recruitment and muscle fiber type. J Appl Physiol 105: 1673–1674, 2008. [DOI] [PubMed] [Google Scholar]
- 35.Farina D. Last word on point:counterpoint: spectral properties of the surface EMG can characterize/do not provide information about motor unit recruitment and muscle fiber type. J Appl Physiol 105: 1683, 2008. [DOI] [PubMed] [Google Scholar]
- 36.Farina D, Cescon C, Negro F, Enoka RM. Amplitude cancellation of motor-unit action potentials in the surface electromyogram can be estimated with spike-triggered averaging. J Neurophysiol 100: 431–440, 2008. [DOI] [PMC free article] [PubMed] [Google Scholar]
- 37.Farina D, Negro F, Gazzoni M, Enoka RM. Detecting the unique representation of motor-unit action potentials in the surface electromyogram. J Neurophysiol 100: 1223–1233, 2008. [DOI] [PMC free article] [PubMed] [Google Scholar]
- 38.Farina D, Leclerc F, Arendt-Nielsen L, Buttelli O, Madeleine P. The change in spatial distribution of upper trapezius muscle activity is correlated to contraction duration. J Electromyogr Kinesiol 18: 16–25, 2008. [DOI] [PubMed] [Google Scholar]
- 39.Farina D. Variations in propagation velocity of muscle-fiber action potentials in individual motor units during voluntary contractions. J Appl Physiol 111: 627–629, 2011. [DOI] [PubMed] [Google Scholar]
- 40.Farina D, Enoka RM. Surface EMG decomposition requires an appropriate validation. J Neurophysiol 105: 981–982, 2011. [DOI] [PubMed] [Google Scholar]
- 41.Farina D, Negro F, Jiang N. Identification of common synaptic inputs to motor neurons from the rectified electromyogram. J Physiol 591: 2403–2418, 2013. [DOI] [PMC free article] [PubMed] [Google Scholar]
- 42.Farina D, Negro F, Jiang J. Reply from Dario Farina, Francesco Negro and Ning Jiang. J Physiol 592: 251–252, 2014. [DOI] [PMC free article] [PubMed] [Google Scholar]
- 43.Farina D, Negro F, Dideriksen JL. The effective neural drive to muscles is the common synaptic input to motor neurons. J Physiol 592: 3427–3441, 2014. [DOI] [PMC free article] [PubMed] [Google Scholar]
- 44.Fuglevand AJ, Winter DA, Patla AE. Models of recruitment and rate coding organization in motor unit pools. J Neurophysiol 70: 2470–2488, 1993. [DOI] [PubMed] [Google Scholar]
- 45.Gazzoni M, Farina D, Merletti R. A new method for the extraction and classification of single motor unit action potentials from surface EMG signals. J Neurosci Methods 136: 165–177, 2004. [DOI] [PubMed] [Google Scholar]
- 46.Grosse P, Cassidy MJ, Brown P. EEG-EMG, MEG-EMG and EMG-EMG frequency analysis: physiological principles and clinical applications. Clin Neurophysiol 113: 1523–1531, 2002. [DOI] [PubMed] [Google Scholar]
- 47.Halliday DM, Conway BA, Farmer SF, Rosenberg JR. Using electroencephalography to study functional coupling between cortical activity and electromyograms during voluntary contractions in humans. Neurosci Lett 241: 5–8, 1998. [DOI] [PubMed] [Google Scholar]
- 48.Halliday DM, Conway BA, Christensen LO, Hansen NL, Petersen NP, Nielsen JB. Functional coupling of motor units is modulated during walking in human subjects. J Neurophysiol 89: 960–968, 2003. [DOI] [PubMed] [Google Scholar]
- 49.Halliday DM, Farmer SF. On the need for rectification of surface EMG. J Neurophysiol 103: 3547, 2010. [DOI] [PubMed] [Google Scholar]
- 50.Hansen NL, Nielsen JB. The effect of transcranial magnetic stimulation and peripheral nerve stimulation on corticomuscular coherence in humans. J Physiol 561: 295–306, 2004. [DOI] [PMC free article] [PubMed] [Google Scholar]
- 51.Holobar A, Zazula D. Multichannel blind source separation using convolution kernel compensation. IEEE Trans Signal Proc 55: 4487–4496, 2007. [Google Scholar]
- 52.Holobar A, Farina D, Gazzoni M, Merletti R, Zazula D. Estimating motor unit discharge patterns from high-density surface electromyogram. Clin Neurophysiol 120: 551–562, 2009. [DOI] [PubMed] [Google Scholar]
- 53.Holobar A, Minetto MA, Botter A, Negro F, Farina D. Experimental analysis of accuracy in the identification of motor unit spike trains from high-density surface EMG. IEEE Trans Neural Syst Rehabil Eng 18: 221–229, 2010. [DOI] [PubMed] [Google Scholar]
- 54.Holobar A, Glaser V, Gallego JA, Dideriksen JL, Farina D. Non-invasive characterization of motor unit behaviour in pathological tremor. J Neural Eng 9: 056011, 2012. [DOI] [PubMed] [Google Scholar]
- 55.Holobar A, Minetto M, Farina D. Accurate identification of motor unit discharge patterns from high-density surface EMG and validation with a novel signal-based performance metrics. J Neural Eng 11: 016008, 2014. [DOI] [PubMed] [Google Scholar]
- 56.Holtermann A, Roeleveld K, Karlsson JS. Inhomogeneities in muscle activation reveal motor unit recruitment. J Electromyogr Kinesiol 15: 131–137, 2005. [DOI] [PubMed] [Google Scholar]
- 57.Hu X, Rymer WZ, Suresh NL. Assessment of validity of a high-yield surface electromyogram decomposition. J Neuroeng Rehabil 10: 99, 2013. [DOI] [PMC free article] [PubMed] [Google Scholar]
- 58.Hu X, Rymer WZ, Suresh NL. Accuracy assessment of a surface electromyogram decomposition system in human first dorsal interosseus muscle. J Neural Eng 11: 026007, 2014. [DOI] [PubMed] [Google Scholar]
- 59.Jesunathadas M, Aidoor SS, Keenan KG, Farina D, Enoka RM. Influence of amplitude cancellation on the accuracy of determining the onset of muscle activity from the surface electromyogram. J Electromyogr Kinesiol 22: 494–500, 2012. [DOI] [PMC free article] [PubMed] [Google Scholar]
- 60.Kilner JM, Baker SN, Lemon RN. A novel algorithm to remove electrical cross-talk between surface EMG recordings and its application to the measurement of short-term synchronisation in humans. J Physiol 538: 919–930, 2002. [DOI] [PMC free article] [PubMed] [Google Scholar]
- 61.Keenan KG, Farina D, Maluf KS, Merletti R, Enoka RM. Influence of amplitude cancellation on the simulated surface electromyogram. J Appl Physiol 98: 120–131, 2005. [DOI] [PubMed] [Google Scholar]
- 62.Keenan KG, Farina D, Merletti R, Enoka RM. Amplitude cancellation reduces the size of motor unit potentials averaged from the surface EMG. J Appl Physiol 100: 1928–1937, 2006. [DOI] [PubMed] [Google Scholar]
- 63.Keenan KG, Farina D, Meyer FG, Merletti R, Enoka RM. Sensitivity of the cross-correlation between simulated surface EMGs for two muscles to detect motor unit synchronization. J Appl Physiol 102: 1193–1201, 2007. [DOI] [PubMed] [Google Scholar]
- 64.Kleine BU, Schumann NP, Stegeman DF, Scholle HC. Surface EMG mapping of the human trapezius muscle: the topography of monopolar and bipolar surface EMG amplitude and spectrum parameters at varied forces and in fatigue. Clin Neurophysiol 111: 686–693, 2000. [DOI] [PubMed] [Google Scholar]
- 65.Kleine BU, van Dijk JP, Lapatki BG, Zwarts MJ, Stegeman DF. Using two-dimensional spatial information in decomposition of surface EMG signals. J Electromyogr Kinesiol 17: 535–548, 2007. [DOI] [PubMed] [Google Scholar]
- 66.Knaflitz M, Bonato P. Time-frequency methods applied to muscle fatigue assessment during dynamic contractions. J Electromyogr Kinesiol 9: 337–350, 1999. [DOI] [PubMed] [Google Scholar]
- 67.Lapatki BG, Oostenveld R, Van Dijk JP, Jonas IE, Zwarts MJ, Stegeman DF. Topographical characteristics of motor units of the lower facial musculature revealed by means of high-density surface EMG. J Neurophysiol 95: 342–354, 2006. [DOI] [PubMed] [Google Scholar]
- 68.Li X, Holobar A, Gazzoni M, Botter A, Merletti R, Rymer WZ, Zhou P. Post stroke motor unit firing rate alteration examined by high density surface electromyography decomposition (Abstract). Neuroscience 338.10/V2, 2013. [Google Scholar]
- 69.Lindstrom L, Magnusson R. Interpretation of myoelectric power spectra: a model and its applications. Proc IEEE 65: 653–662, 1977. [Google Scholar]
- 70.Lowery MM, Stoykov NS, Kuiken TA. A simulation study to examine the use of cross-correlation as an estimate of surface EMG cross talk. J Appl Physiol 94: 1324–1334, 2003. [DOI] [PubMed] [Google Scholar]
- 71.Mambrito B, De Luca CJ. A technique for the detection, decomposition and analysis of the EMG signal. Electroencephalogr Clin Neurophysiol 58: 175–188, 1984. [DOI] [PubMed] [Google Scholar]
- 72.Marateb HR, McGill KC, Holobar A, Lateva ZC, Mansourian M, Merletti R. Accuracy assessment of CKC high-density surface EMG decomposition in biceps femoris muscle. J Neural Eng 8: 066002, 2011. [DOI] [PMC free article] [PubMed] [Google Scholar]
- 73.Mathiassen SE, Winkel J, Hägg GM. Normalization of surface EMG amplitude from the upper trapezius muscle in ergonomic studies–a review. J Electromyogr Kinesiol 5: 197–226, 1995. [DOI] [PubMed] [Google Scholar]
- 74.McClelland VM, Cvetkovic Z, Mills KR. Rectification of the EMG is an unnecessary and inappropriate step in the calculation of Corticomuscular coherence. J Neurosci Methods 205: 190–201, 2012. [DOI] [PubMed] [Google Scholar]
- 75.McClelland VM, Cvetkovic Z, Mills KR. Inconsistent effects of EMG rectification on coherence analysis. J Physiol 592: 249–250, 2014. [DOI] [PMC free article] [PubMed] [Google Scholar]
- 76.McGill KC, Lateva ZC, Marateb HR. EMGLAB: an interactive EMG decomposition program. J Neurosci Methods 149: 121–133, 2005. [DOI] [PubMed] [Google Scholar]
- 77.McGill KC, Lateva ZC. History dependence of human muscle-fiber conduction velocity during voluntary isometric contractions. J Appl Physiol 111: 630–641, 2011. [DOI] [PMC free article] [PubMed] [Google Scholar]
- 78.Mottram CJ, Jakobi JM, Semmler JG, Enoka RM. Motor-unit activity differs with load type during a fatiguing contraction. J Neurophysiol 93: 1381–1392, 2005. [DOI] [PubMed] [Google Scholar]
- 79.Myers LJ, Lowery M, O'Malley M, Vaughan CL, Heneghan C, St Clair Gibson A, Harley YX, Sreenivasan R. Rectification and non-linear pre-processing of EMG signals for cortico-muscular analysis. J Neurosci Methods 124: 157–165, 2003. [DOI] [PubMed] [Google Scholar]
- 80.Nakao M, Norimatsu M, Mizutani Y, Yamamoto M. Spectral distortion properties of the integral pulse frequency modulation model. IEEE Trans Biomed Eng 44: 419–426, 1997. [DOI] [PubMed] [Google Scholar]
- 81.Nawab SH, Chang SS, De Luca CJ. High-yield decomposition of surface EMG signals. Clin Neurophysiol 121: 1602–1615, 2010. [DOI] [PMC free article] [PubMed] [Google Scholar]
- 82.Negro F, Farina D. Linear transmission of cortical oscillations to the neural drive to muscles is mediated by common projections to populations of motoneurons in humans. J Physiol 589: 629–637, 2011. [DOI] [PMC free article] [PubMed] [Google Scholar]
- 83.Negro F, Farina D. Decorrelation of cortical inputs and motoneuron output. J Neurophysiol 106: 2688–2697, 2011. [DOI] [PubMed] [Google Scholar]
- 84.Negro F, Farina D. Factors influencing the estimates of correlation between motor unit activities in humans. PLoS One 7: e44894, 2012. [DOI] [PMC free article] [PubMed] [Google Scholar]
- 85.Negro F, Holobar A, Farina D. Fluctuations in isometric muscle force can be described by one linear projection of low-frequency components of motor unit discharge rates. J Physiol 587: 5925–5938, 2009. [DOI] [PMC free article] [PubMed] [Google Scholar]
- 86.Nielsen JB, Brittain JS, Halliday DM, Marchand-Pauvert V, Mazevet D, Conway BA. Reduction of common motoneuronal drive on the affected side during walking in hemiplegic stroke patients. Clin Neurophysiol 119: 2813–2818, 2008. [DOI] [PubMed] [Google Scholar]
- 87.Pfurtscheller G, Lopes da Silva FH. Event-related EEG/MEG synchronization and desynchronization: basic principles. Clin Neurophysiol 110: 1842–1857, 1999. [DOI] [PubMed] [Google Scholar]
- 88.Pohja M, Salenius S. Modulation of cortex-muscle oscillatory interaction by ischaemia-induced deafferentation. Neuroreport 14: 321–324, 2003. [DOI] [PubMed] [Google Scholar]
- 89.Qi L, Wakeling JM, Green A, Lambrecht K, Ferguson-Pell M. Spectral properties of electromyographic and mechanomyographic signals during isometric ramp and step contractions in biceps brachii. J Electromyogr Kinesiol 21: 128–135, 2011. [DOI] [PubMed] [Google Scholar]
- 90.Riddle CN, Baker SN. Manipulation of peripheral neural feedback loops alters human corticomuscular coherence. J Physiol 566: 625–639, 2005. [DOI] [PMC free article] [PubMed] [Google Scholar]
- 91.Roy SH, De Luca CJ, Schneider J. Effects of electrode location on myoelectric conduction velocity and median frequency estimates. J Appl Physiol 61: 1510–1517, 1986. [DOI] [PubMed] [Google Scholar]
- 92.Salenius S, Portin K, Kajola M, Salmelin R, Hari R. Cortical control of human motoneuron firing during isometric contraction. J Neurophysiol 77: 3401–3405, 1997. [DOI] [PubMed] [Google Scholar]
- 93.Salenius S, Avikainen S, Kaakkola S, Hari R, Brown P. Defective cortical drive to muscle in Parkinson's disease and its improvement with levodopa. Brain 125: 491–500, 2002. [DOI] [PubMed] [Google Scholar]
- 94.Solomonow M, Baten C, Smith J, Baratta R, Hermens H, D'Ambrosia R, Shoji H. Electromyogram power spectra frequencies associated with motor unit recruitment strategies. J Appl Physiol 68: 1177–1185, 1990. [DOI] [PubMed] [Google Scholar]
- 95.Stalberg E. Propagation velocity in human muscle fibers in situ. Acta Physiol Scand Suppl 287: 1–112, 1966. [PubMed] [Google Scholar]
- 96.Staudenmann D, Kingma I, Daffertshofer A, Stegeman DF, van Dieën JH. Improving EMG-based muscle force estimation by using a high-density EMG grid and principal component analysis. IEEE Trans Biomed Eng 53: 712–719, 2006. [DOI] [PubMed] [Google Scholar]
- 97.Staudenmann D, van Dieën JH, Stegeman DF, Enoka RM. Increase in heterogeneity of biceps brachii activation during isometric submaximal fatiguing contractions: a multichannel surface EMG study. J Neurophysiol 111: 984–990, 2014. [DOI] [PubMed] [Google Scholar]
- 98.Strens LH, Asselman P, Pogosyan A, Loukas C, Thompson AJ, Brown P. Corticocortical coupling in chronic stroke: Its relevance to recovery. Neurology 63: 475–484, 2004. [DOI] [PubMed] [Google Scholar]
- 99.Tecchio F, Porcaro C, Zappasodi F, Pesenti A, Ercolani M, Rossini PM. Cortical short-term fatigue effects assessed via rhythmic brain-muscle coherence. Exp Brain Res 174: 144–151, 2006. [DOI] [PubMed] [Google Scholar]
- 100.Troni W, Cantello R, Rainero I. Conduction velocity along human muscle fibers in situ. Neurology 33: 1453–1459, 1983. [DOI] [PubMed] [Google Scholar]
- 101.Vieira TM, Loram ID, Muceli S, Merletti R, Farina D. Postural activation of the human medial gastrocnemius muscle: are the muscle units spatially localised? J Physiol 589: 431–443, 2011. [DOI] [PMC free article] [PubMed] [Google Scholar]
- 102.von Tscharner V, Nigg BM. Point: spectral properties of the surface EMG can characterize/do not provide information about motor unit recruitment strategies and muscle fiber type. J Appl Physiol 105: 1671–1673, 2008. [DOI] [PubMed] [Google Scholar]
- 103.von Tscharner V, Nigg BM. Last word on point:counterpoint: spectral properties of the surface EMG can characterize/do not provide information about motor unit recruitment strategies and muscle fiber type. J Appl Physiol 105: 1682, 2008. [DOI] [PubMed] [Google Scholar]
- 104.Volkmann J, Joliot M, Mogilner A, Ioannides AA, Lado F, Fazzini E, Ribary U, Llinas R. Central motor loop oscillations in parkinsonian resting tremor revealed by magnetoencephalography. Neurology 46: 1359–1370, 1996. [DOI] [PubMed] [Google Scholar]
- 105.Ward NJ, Farmer SF, Berthouze L, Halliday DM. Rectification of EMG in low force contractions improves detection of motor unit coherence in the beta-frequency band. J Neurophysiol 110: 1744–1750, 2013. [DOI] [PMC free article] [PubMed] [Google Scholar]
- 106.Yang Q, Fang Y, Sun CK, Siemionow V, Ranganathan VK, Khoshknabi D, Davis MP, Walsh D, Sahgal V, Yue GH. Weakening of functional corticomuscular coupling during muscle fatigue. Brain Res 1250: 101–112, 2009. [DOI] [PMC free article] [PubMed] [Google Scholar]