

Abstract
The combination of microfluidic cell trapping devices with ion mobility-mass spectrometry offers the potential for elucidating in real time the dynamic responses of small populations of cells to paracrine signals, changes in metabolite levels, and delivery of drugs and toxins. Preliminary experiments examining peptides in methanol and recording the interactions of yeast and Jurkat cells with their superfusate have identified instrumental setup and control parameters and on-line desalting procedures. Numerous initial experiments demonstrate and validate this new instrumental platform. Future outlooks and potential applications are addressed, specifically how this instrumentation may be used for fully automated systems biology studies of the significantly interdependent, dynamic internal workings of cellular metabolic and signaling pathways.
Keywords: Microfluidics, mass spectrometry, MALDI, ESI, ion mobility, ion mobility-mass spectrometry, structural separations, systems biology, secretome, yeast cells, Jurkat cells
1 Introduction
Systems biology seeks to understand living organisms by studying the interactions of numerous levels of biochemical networks comprising the organism and does so frequently through the use of mathematical modeling to understand existing experimental results. The multifaceted complexity of biology [1] makes modeling dynamic biological processes a daunting task that when addressed today often leaves the researcher with a theoretical, mathematical model that cannot be fully specified or validated due to insufficient time- or parameter-dependent experimental data. While some experiments are designed to study the cellular response to one perturbation at a time, this method may not be capable of identifying nonlinear responses and interactions between large numbers of variables. Experiments that adjust multiple experimental parameters simultaneously often suffer from limitations in detecting cellular responses wherein low sampling rates or signal amplitudes require averaging over long times or millions of cells [2]. Averaged, incomplete, or biased data sets can compromise the specification or validation of complex mathematical models. Rapid detection of the multifaceted dynamical responses of biological systems to multivariable perturbations will be required to fully characterize dynamic cellular metabolic and signaling responses. Given this capability, we will then be able to examine these data with algorithms developed to derive, possibly through real-time machine learning [3,4,5], an analytical understanding of how nonlinear systems interact and function. This approach should provide a powerful means for understanding the complex molecular interaction networks that regulate, control, and perturb biochemical processes.
This article describes the marriage of the microfluidic Multitrap Nanophysiometer, which traps nonadherent cells in highly restricted volumes, to cutting-edge mass spectrometry detection methods, for the purpose of conducting systems biology measurements through analysis of cellular effluent with high bandwidth. Our preliminary results demonstrate the ability to use these technologies to gather a wealth of information on multiple biomolecular signatures with the temporal resolution necessary for the observation of dynamic physiological phenomena. In addition, our demonstrated detection of low abundance species supports our eventual goal of identifying disease-, drug-, or toxin-induced dynamic changes in low abundance factors such as paracrine and autocrine signals in either cell culture medium or blood plasma.
1.1 Plasma dynamics and paracrine/autocrine signaling
Typical clinical blood analyses provide mostly coarse diagnostic information based on highly concentrated salts, proteins, hormones, pathogens, etc. The dynamic range of blood composition, which may exceed 20 orders of magnitude in concentration dynamic range [6,7], severely complicates the detection of more important low abundant factors using conventional analytical techniques. Even when immune cells are grown in vitro to study cellular physiology and behavior more closely, the large volumes of medium associated with cell culture dilute paracrine and autocrine signaling factors. It is these factors that affect cell-cell interactions and would, if measureable, provide critical information concerning the status of the immune system. Additionally, low-abundance blood-borne pathogenic factors may be present despite the fact that the actual pathogen may be located in soft tissue or elsewhere [8]. Even if the pathogen is present in blood, culturing techniques take several days. Polymerase chain reaction (PCR) may be used to amplify DNA of a suspected blood-borne pathogen, but primers can be costly and troubleshooting the procedure can be difficult and time-consuming. Enzyme-linked immunosorbent assay (ELISA) can be performed to detect the presence of various antibodies or antigens; however, potential complications include cross-reactivity and poor sensitivity. Each of these challenges suggests the need for improved analytical capabilities for biological research and medicine.
1.2 Current techniques
1.2.1 Microfluidics
Microfluidics, or lab-on-a-chip (LOC) technology, spans multiple fields including engineering, physics, chemistry, and biology. This technology has implemented a shift in the traditional experimental techniques of cell and molecular biology towards small-scale on-chip research. This shift towards miniaturized chip devices comes with the beneficial requirement of low volumes of reagents based on microfluidic device size and length of experiment, as well as easier fluid handling, allowing for better experimental control. Experiments conducted with microfluidic devices offer the potential of being inexpensive not only due to the decreased cost of reagents, but also because of low material cost as the devices are typically comprised of poly(dimethylsiloxane) and a glass slide or cover slip [9,10]. The design and fabrication procedures allow for meticulous control of the device features, making the technology incredibly versatile. Because these devices consume picoliter to nanoliter volumes of reagents and/or cell culture medium, the extracellular contents, including autocrine and paracrine signaling molecules, are not diluted to the large extent experienced with cell culture and titer plates techniques [11]. In contrast to the macroscale, the relative importance at the microscale of specific physical phenomena, such as diffusion, laminar flow, surface area-to-volume ratios, response time, and other factors, has significant consequences in physiological processes and can greatly contribute to a more representative in vitro/in vivo correlation (IVIVC). By taking advantage of the numerous benefits of microfluidics many researchers have been able to make measurements at the microscale that would otherwise not be possible [12].
The Vanderbilt Institute for Integrative Biosystems Research and Education (VIIBRE) Multitrap Nanophysiometer (MTNP), a microfluidic device used as miniature bioreactor, allows for studies on small populations of cells (1 to ∼105). This is in stark contrast to traditional cell biology techniques which often require several orders of magnitude larger populations of cells. The MTNP lends itself to long-term optical measurements of the dynamic behavior of unattached cells, including fluorescent labeling of cells to detect type, activation state, and signaling dynamics [11,13,14]. The MTNPs can also be readily combined with microfabricated multielectrode arrays for electrochemical measurements of the metabolic activity of small numbers of cells and their rapid response to drugs and other perturbations. Extending our existing μL-scale electrochemical technologies [15,16,17,18], we are now combining at the nL scale optical and electrochemical technologies to record dynamic changes in acidification rate, oxygen and glucose consumption, lactate release, intracellular calcium concentrations, transmembrane potentials, and NADH concentrations. Sensitivities approaching that required to monitor single cells have been achieved in preliminary work [19,20,21,22,23,24]. Together these technologies are ideal for studying paracrine and autocrine signaling dynamics.
1.2.2 Mass spectrometry
Traditionally, analytical approaches applied to complex biological samples have primarily included pre-analysis sample purification or pretreatment, and/or using separations such as gel electrophoresis or liquid chromatography (LC) followed by mass analysis. Using the latter, the LC separation step is required in order to spread out the abundant from less abundant and often isobaric mass signals from endogenous or exogenous species that would not be observed were mass analysis performed in the absence of separation. This seemingly simplifying procedure, however, is not without inherent challenges. One of the fundamental limitations of LC is that the choice of separation directly depends on the physical properties chosen for selectivity (e.g., hydropathy, affinity, size, etc.); that is, each column is specific for a certain chemical quality. For example, in order to separate carbohydrates from plasma, a lectin column might be used. However, this largely eliminates selectivity for other relevant species that may be of interest, for example peptides, proteins, lipids, and other types of molecules. Multidimensional chromatography is now routinely used in proteomics, but these techniques still suffer from an inability to measure a large suite of different types of biomolecules, and sample losses may be expected in each dimension of sample handling. A specific complicating factor for performing systems biology experiments aimed at elucidating temporal dynamics is that condensed-phase separations are time intensive. Commonly, multidimensional LC-MS experiments take ca. 6-12 hrs, which largely precludes their use when multiple time-correlated signals must be analyzed to assess system fluctuations or dynamic responses to challenges that occur on a timescale of subsecond to minutes.
Furthermore, it is important to recognize that the two dominant MS ion sources for biomolecular species, namely electrospray ionization (ESI) and matrix assisted laser desorption/ionization (MALDI), offer complementary capabilities in spite of the fact that there are three primary differences when considering which ion source to use for specific experiments. First, MALDI generally produces singly charged ions of the form [M+H]+, [M+Na]+, [M+K]+, etc., where M is the intact molecular parent ion, while ESI produces singly charged ions for small molecules and typically multiply charged ions of the form [M+nH]n+ for larger biomolecules such as peptides and proteins. In the analysis of complex mixtures, singly charged ions can result in less spectral complexity, while multiply charged ions better facilitate fragmentation studies using tandem MS strategies, in which the fragments of an MS-separated molecule are themselves separated by a second MS step. Second, owing to the fundamental principles of ion generation, MALDI is more tolerant of salts than ESI, but requires empirical selection of appropriate matrices. Third, MALDI and ESI generate ions in pulsed and continuous modes, respectively. Thus the choice of MALDI or ESI can have pragmatic implications regarding the integration of the biological experiment, the ion source, and the selected mass analyzer. Nevertheless, we view these ionization techniques as highly complementary. One pertinent point to consider with systems biology studies is that ESI utilizes a continuous liquid sample that changes in real time with respect to the system being analyzed while a single MALDI record represents the sample at the time the effluent was deposited, such that a time-series analysis requires a series of MALDI samples similar to that reported by Chen et al. [25]. This idea is synonymous with watching a movie of what is occurring versus viewing a series of snapshots.
1.2.3 Microfluidics and MS
Microfluidic chips have been successfully integrated with capillary electrophoretic (CE) separations of biomolecules [26,27,28,29]. However, because CE is a condensed-phase separation, it still relies on liquid-phase physical properties for separation and typically requires 10s of minutes for separation. Several studies have focused on integrating the numerous benefits and flexibility of microfluidics with the sensitive analytical power of mass spectrometry [30,31,32,33]. Some have used microfluidics to increase the ease and efficiency of proteomic analysis using on-chip immobilized enzymatic degradation for ESI and MALDI [34,35]. Mellors et al. were able to demonstrate complete integration of the ionization source into the microfluidic chip [36]. In that study ESI was performed from the corner of the glass device without the need for external pumping or spray tips. Despite the significance of this work this method still suffers from an inability to handle a high concentration of salts, such as that found in cell media, which results in significant ion suppression effects when performing ESI. The fully functional integration of microfluidics with advanced analytical techniques is increasingly needed to provide an important bridge between chemistry and biology.
1.3 Ion mobility-mass spectrometry for systems biology research
Ion mobility-mass spectrometry (IM-MS) has recently demonstrated considerable promise for systems biology studies by allowing the intricate characterization of the complex biomolecular profile through its unique mode of separation [37,38,39,40,41]. IM-MS first separates analytes, in the form of gas-phase ions, according to their orientationally averaged collision cross section with a neutral gas, which when performed under appropriate conditions corresponds with molecular surface area. Importantly, these separations are analogous to gas-phase electrophoresis, but in the gas-phase the timescale for separation is μs-ms or nearly five orders of magnitude faster than condensed-phase separations. Furthermore, because ions are separated post-ionization, IM can be readily combined with slower LC or CE separation techniques prior to ionization [37]. Subsequent to IM separation, the ions are characterized by their mass using conventional MS analysis. The overwhelming complexity of systems biology samples makes IM-MS, with its ability to readily deconvolute complex data sets, uniquely qualified to handle these analyses. Mass spectrometry is a sensitive analytical technique that has shown great potential as a detection tool for cellular processes [42,43]. With the addition of a structural dimension through IM the user is afforded increased peak capacity, better signal-to-noise ratios, and increased dynamic range through the separation of chemical noise [44,45,46]. These benefits are possible without an increase in analysis time or significant decrease in sensitivity. In a 2007 study Liu et al. [37] demonstrated this ability with their LC-IM-MS analysis of human plasma. By combining the separation power of IM with the detection power of MS they were able to make 9,087 protein assignments from 37,842 unique peptide identifications. Moon and coworkers showed that adding an IM dimension benefited collision-induced dissociation (CID) selection for low abundance ions in a complex biological mixture [47].
1.3.1 Ion mobility-mass spectrometry instrumentation
Although IM separations have existed for over a century and IM coupled with MS since the 1970s, the use of IM-MS for biological applications has really only emerged for complex systems over the past decade [48]. Largely this slow evolution of IM-MS is because until the past two years, biological IM-MS instruments were not commercially available and only existed in the labs of physicists and chemists willing to construct them. Now with commercial offerings this landscape is changing rapidly. Briefly, IM-MS is composed of an ion source, an ion mobility separation cell, a mass analyzer, and a detector as depicted in Fig. 1A. There are many variations to the general design, such as different ion sources (e.g., ESI and MALDI) and types of ion mobility separation cells used [49]. Following ionization, ions are injected into a separation cell filled with a neutral drift gas and migrate under the influence of a weak electrostatic field. The drift velocity (vd) across the drift cell is related to the electrostatic field strength (E) via a proportionality constant, which is the ion mobility (K) of the analyte species within a particular drift gas:
Figure 1.
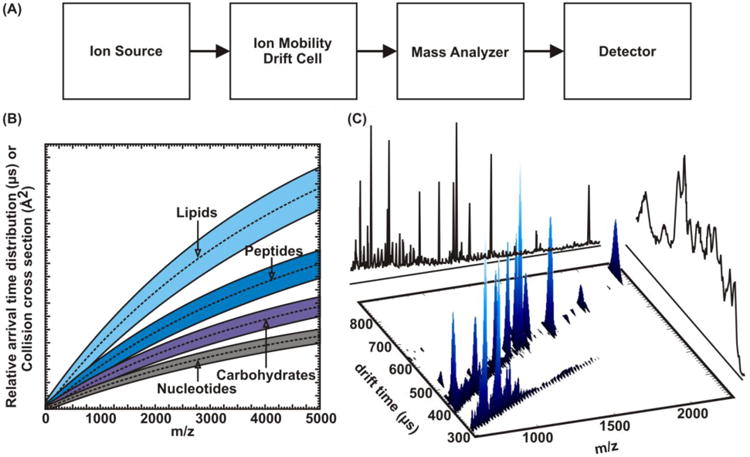
(A) A generalized schematic diagram of an ion mobility-mass spectrometer. (B) A theoretical projection demonstrating biomolecular class separation. These biomolecular classes partition due to their differing gas-phase packing efficiencies, or average molecular density of different molecular classes. (C) An example spectrum showing the potential to structurally separate internal standards or chemical interference. In this case fullerenes were added to an ovalbumin tryptic digest mixture to calibrate for mass and collision cross section. Because fullerenes form more compact structures than peptides they are easily separated in the drift dimension, negating any isobaric interferences.
| [1] |
In the presence of the neutral drift gas, larger ions have a lower mobility than smaller ions, which results in longer and shorter drift times, respectively. This effect can be thought of as a race between two skiers, one with arms tucked and the other with arms open wide. The arms-tucked skier, guided by the gradient of the hill (as ions are guided by the electric field), will experience less drag and will reach the bottom of the hill faster. By using the kinetic theory of gases the apparent surface area of the ions, known as the collision cross section (CCS), can be calculated [50,51,52].
Because of the temporal separation of ions through the drift tube, they emerge from the drift tube in discrete packets. Note that typical separation times for all ion packets are generally within the range of 100s of μs to 10s of ms. Although this is relatively fast, it is slow compared with the rate at which time-of-flight mass spectra (TOFMS) can be acquired. Thus, over the elution profile of ion packets from the drift tube, many TOFMS are acquired over the IM elution profile. These spectra are then stitched together, resulting in a 3D plot of drift time, mass-to-charge (m/z), and signal intensity, as depicted in Fig 1C. Note that additional MS can be performed prior to or following IM separation to obtain tandem MS/MS spectra. This is performed by selecting a particular precursor ion, fragmenting it, and subsequently performing IM or MS to characterize the fragment species comprising the precursor molecular ion. Such studies are useful to gain additional insight into the structural composition of the precursor species and for high confidence-level identification.
1.3.2 Ion mobility-mass spectrometry data interpretation
Typically, IM-MS data are presented as a 3D plot with m/z on the x axis and arrival time distribution (ATD, calculated from drift velocity) on the y axis, with false coloring used to display ion intensity. In IM-MS the two separation dimensions exhibit a high degree of correlation. Given the relatively few types of atoms involved in the composition of most biomolecules (C, H, O, N, P, and S), the mass and volume of a molecule are largely related by a narrow range of density. This conformation space, as it is termed, has been extensively mapped for many biomolecules such as nucleotides, carbohydrates, peptides/proteins, and lipids [38]. These characteristic densities for different biomolecules give rise to inherent correlations that can be predicted for each class of analyte due to the specific structures different types of molecules preferentially adopt (Fig. 1B). Separation of these classes is most pronounced when dealing with an m/z range greater than 2000. However, at lower ranges, such as that depicted in Fig. 1C, separations are still feasible but the correlations begin to overlap. Nevertheless, the average density for different classes of biomolecules (e.g., peptides vs. lipids) can be quite different and provides great utility in the separation of complex samples in the simultaneous measurement of different omics, e.g., lipidomics and proteomics and glycoproteomics, without extensive sample purification or sample pretreatment steps prior to analysis.
2 Methods
ESI-IM-TOFMS measurements for the preliminary desalting and diffusion studies (section 3.1) were performed with a nanoflow-ESI ionization source held at +2.25 kV. After exiting the ESI tip the ions were directed through a 500 μm ID, 6 inch long steel capillary heated to 100°C and held at ground potential. Upon exiting the steel capillary the ions were held in a keyhole ion funnel trapping region in order to be pulsed into the 14 cm long drift tube for temporally resolved measurement [53]. Once the ionized species traversed the 4 Torr He-filled drift cell under the influence of a weak electric field held at -100 V potential at the front and -1900 V at the back plate, they were guided by ion optics into the low-pressure (ca. 10-8 Torr) TOFMS region. Two-dimensional spectra (arrival time versus m/z) of each sample were analyzed and compared using custom visualization software (Ionwerks, Houston, TX, USA) developed on the IDL platform (ITT Visual Information Solutions, Boulder, CO, USA). Desalting studies were performed using a 1 inch packed LC column. The 250 μm ID column was packed in-house with 30 μm C18 beads. Cheminert (Valco Instruments Co. Inc., Houston, TX, USA) valves and an Eksigent nanoflow 2D LC pumping system (Eksigent Technologies, Dublin, CA, USA) were used to drive the desalting process discussed below. Mass calibration of the instrument was performed externally using a mixture of C60 and C70, which also serve as structural standards. A MALDI-TOFMS (Voyager DE-STR, Applied Biosystems, Foster City, CA, USA) operated in reflectron mode was used to confirm the identities of various signals.
Data for the yeast analyses (section 3.2) were recorded on an Applied Biosystems Voyager DE-STR mass spectrometer. Data were processed using the Voyager Control Panel Version 5.10 (Applied Biosystems) and MALDI MS Imaging Tool, version 2.2.2 (developed by Markus Stoeckli, Novartis, Switzerland) [54]. Both BY4741 and ATCC #9763 Saccharomyces cerevisiae strains were used. Cell stocks were initially stored at -80°C. A portion was plated on yeast peptone dextrose (YPD)-rich agar plates and allowed to grow for three days at 30°C. Inoculation was carried out overnight in synthetic minimal media (SD). Before experimentation, subculture cell density was confirmed using optical density (OD) measurements at 600 nm. The OD was confirmed to be in the optimal range of 0.5 to 1.0, indicating that the yeast cells were in the active phase of their logarithmic growth. Throughout the course of the experiment deionized water was rinsed over the cells at a flow rate of 200 nL/min for 3 hours. The cells were captured in MTNPs for optical monitoring and to allow collection of the undiluted yeast secretome in the effluent [11, 13].
Data for the Jurkat cell spectra (section 3.3) were collected on a Synapt HDMS ion mobility-mass spectrometer platform (Waters Inc., Manchester, England). Data were processed using the Waters Driftscope 2.0 software package. Jurkat T cells (clone E6-1) were obtained from ATCC and cultured in RPMI 1640 medium supplemented with 10% FBS (ATCC) and 10 mg/ml Ciproflaxin (Cellgro). Cells were maintained in a sterile environment at 37°C with 5% CO2. Supplied media was maintained at a flow rate of 200 nL/min. MTNP effluent was collected for off-line MALDI-IM-MS analysis.
3 Results and Discussion
3.1 Preliminary studies
Our initial experiments have gauged the general compatibility of microfluidics liquid handling with IM-MS. Many variables were considered in order to validate suitable experimental conditions, including flow rates, measurement timing, pressure tolerances, and chemical compatibility (between necessary chemicals for biological microfluidics and IM-MS). Aimed at answering questions of compatibility, initial experiments sought simply to demonstrate that molecular events occurring inside the microfluidic device could be observed with confident identification and with appropriate temporal resolution. To this end, for our first experiments we used a microfluidic trap device with two inlets and one outlet and alternatively infused a blank methanol solution and a sample solution containing 20 μg/mL of a standard cardiac peptide (bradykinin, RPPGFSPFR). The infusion cycles were 10 minutes, meaning the blank methanol solution was infused for 5 minutes followed by the sample solution for 5 minutes, etc. Figure 2 shows that not only could we detect small amounts of a biological sample through a trapping device but also that we could measure it with a temporal resolution of < 5 minutes and a very high signal-to-noise ratio between peptide and control blank infusion cycles. This also indicates that longitudinal diffusion between adjacent solution packets was minimal, providing confidence that secreted biomolecular material would not get displaced from its original temporal location in the flow stream. Although it appears that the noise level increases following the third injection cycle, in all subsequent injection cycles the noise level remains at a steady state level. We speculate that this rising noise level plateaus when sufficient sample conditioning of the tubing between the MTNP and nESI source is achieved. The signal-to-noise ratio is best demonstrated by comparing the peak counts on the vertical scales of the pair of conformation space plots on the right.
Figure 2.
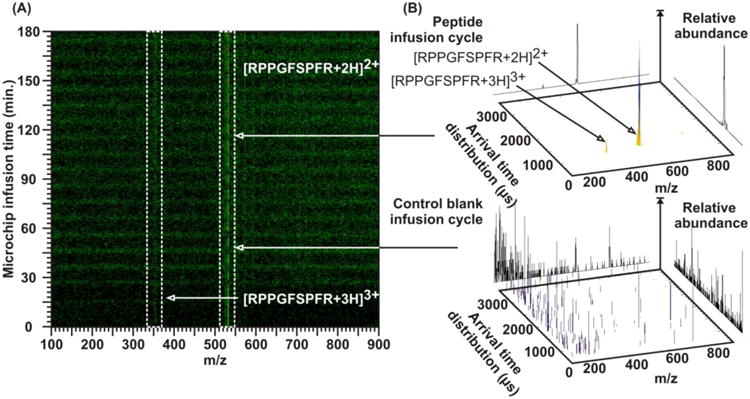
(A) Bradykinin standard (at a concentration of 20 μg/mL) and pure methanol were infused into a two-inlet, single-outlet microfluidic trap device. The two solutions were separately flowed through the trap in a consecutive fashion for 5 minutes each. The resulting m/z spectra demonstrated that not only was it possible to detect small amounts of biomolecular material through the trap but also that these materials could be measured with a temporal resolution of < 5 minutes. (B) 2D spectra during infusion of bradykinin (upper) and methanol alone (lower), plotted with different signal intensity scales. Absolute counts for the peak height are indicated on the vertical, abundance axis, wherein the methanol spectrum represents measurement noise. Due to the sharp detected distinction between the two flows, it can also be inferred that longitudinal diffusion between these two solution packets was minimal, providing confidence that secreted cellular material will not be displaced from its original temporal location in the flow stream.
Cellular medium generally contains approximately 2 g/L of various salts (e.g., sodium chloride, magnesium sulfate, etc.). When salt is present to this degree it can dramatically suppress ESI ion signals of interest, as illustrated for varying concentrations of salt in Fig. 3A. To alleviate this challenge in analyzing cell media that has been superfused across viable cells, we developed a three-valve, two-column desalting system that takes cellular effluent from a microfluidic device and runs it over one of two C18 columns to capture all hydrophobic material (i.e., peptides, proteins, lipids, metabolites, etc.). This form of analyte capture is common practice for many forms of chromatography as well as solid phase extraction (SPE) and involves hydrophobic affinity interaction between the analyte and the chemically bonded reverse-phase silica [55,56]. After being loaded on a column, water is rinsed over the column to purge all nonspecifically bound material, such as salts, from the column. Subsequently, a methanol solution was run over the column to elute off any bound material and direct it to the IM-MS. The idea behind this arrangement is that initially the water solution is rinsed over the first column (valve 2) to equilibrate the column and maximize its binding efficiency. While this is performed, the cellular effluent flow is directed over the second column (valve 3). At this point valve 1 is switched, supplying the effluent to equilibrated column 1 and sending the water solution over the second column to rinse away salt and other nonspecifically bound material. Valve 3 is then switched, which elutes the material off the column and sends this flow to the IM-MS. Valve 3 is then switched again to run the water solution over the now empty column to begin equilibrating it. Valve 1 is then switched and the process is repeated on the other column. This arrangement insures that during the rinsing and loading stages of one column the cellular effluent is not lost to waste, and sequential iteration through these cycles retains the temporal profile of the cellular secretions. Currently load/rinse/elute cycles of ca. 2 minutes are possible; we anticipate reducing this time by eliminating recognizable dead volumes. It is important to note that although these columns are similar to LC columns, they are not being used to achieve chromatography and so are not adding minutes to hours of run time to the overall work flow since they are used only for transient capture and not separation. Nevertheless, this arrangement still suffers from selecting the specific physical properties of the capture resin. Additional on-line desalination procedures are being explored, including microdialysis techniques [57,58].
Figure 3.
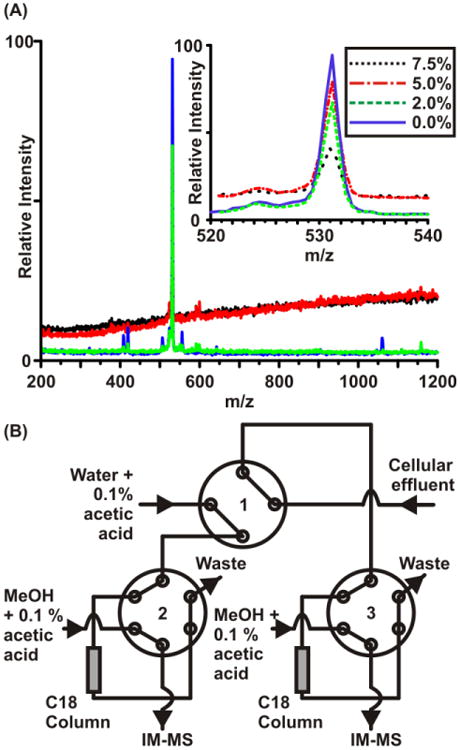
(A) Spectra illustrating the effects of salt suppression in ESI. In this example, minimal media, which contains approximately 2 g/L salt, was diluted to 7.5%, 5%, and 2% and then doped with bradykinin peptide to give a final concentration of 20 μg/mL (the 0% sample is bradykinin in water). With just 2% of the media contents mixed with the peptide, the main 2+ (m/z 531) peak was suppressed to about 75% of its original intensity. Increasing the media contents to 5% and 7.5% further decreases the overall intensity of the 2+ peak and also causes considerable baseline distortion, blocking identification of additional low intensity peaks. (B) The desalting platform used to achieve near-real-time analysis. By using a two-column setup, it is possible to load one column while rinsing and eluting the other, then by switching valve “1” the process can be repeated iteratively.
3.2 Saccharomyces cerevisiae
Given the demonstration of compatibility of microfluidics and IM-MS, it was important to test this platform using a living biological system. Saccharomyces cerevisiae was chosen because it is a well-developed, well-understood system. It is also known for its resiliency as a biological system, enabling time-intensive experiments. S. cerevisiae cells were loaded into a trapping device and were supplied 100% deionized water. This water rinse activates a dormant state in the yeast cells with reduced metabolic activity [59]. The water rinse was begun at time zero and the progression of various ion species was monitored over time. Figure 4a shows images of budding yeast in an MTNP. Effluent from the experimental trapped yeast cells was spotted onto a MALDI plate every 5 minutes to retain time resolution, while not requiring desalting of the sample. A sample spectrum (Fig. 4b) displays the species that were monitored temporally in this experiment (Fig. 4c). These three example sets of data show an increase in relative abundance over time as the cells begin to enter their dormancy and also illustrate a highly correlated temporal response.
Figure 4.
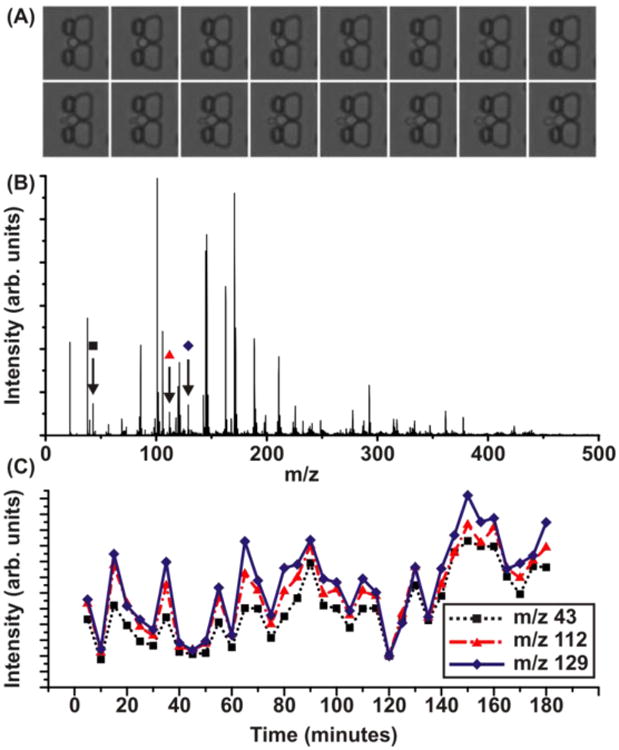
(A) Time-lapse images showing yeast that is budding while in an MTNP. (B) A MALDI-MS spectrum collected during the course of the water-induced dormancy state experiment. The samples were collected by spotting the effluent on a MALDI plate in a sequentially different position every 5 minutes. The three peaks marked were selected due to their observed increase in signal intensity over the 180 minute experiment. (C) The time-dependent signal intensities for the three species selected from a series of spectra as in (B), showing a marked increase in all three peaks after 180 minutes with a high degree of temporal correlation.
3.3 Jurkat cells
Jurkat cells at a density of ca. 1 × 10⁶/mL were loaded into the MTNP (Fig. 5a) and supplied RPMI 1640 media. The effluent from the trap was flowed over a packed C18 column for approximately 2 hours, theoretically saturating the column with cellular secretion material. This column was then rinsed of any material that was nonspecifically bound (using deionized water with 0.1% acetic acid) and then eluted (using methanol with 0.1% acetic acid). The resulting IM-MS spectrum collected from this elution wash is presented in Fig. 5B and shows that this method is able to produce an abundance of signals, hundreds to thousands of different species, directly from biological cell trap effluent. This spectrum illustrates the use of reverse-phase chromatography for preconcentrating analytes and purging the effluent of media salts and nonpertinent material. While this work demonstrates that in principle this technique should be effective, work is currently under way for making this system more automated and also for making it possible to perform the load/rinse/elute cycle on the order of a few minutes.
Figure 5.
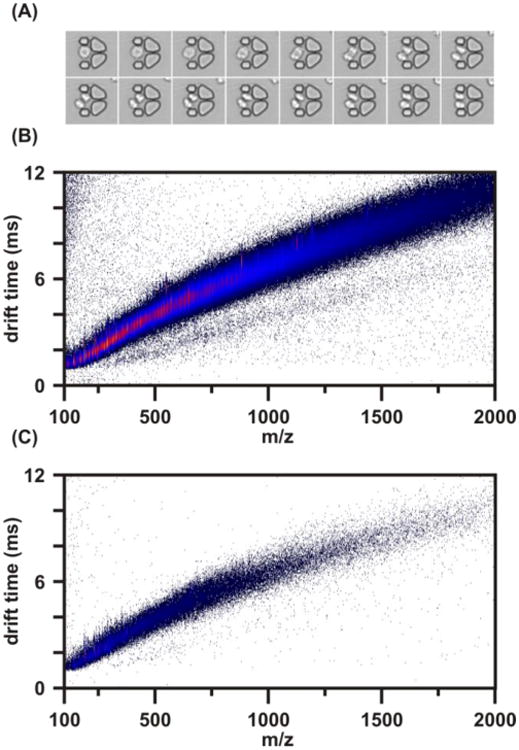
(A) Time-lapse images displaying multiplying Jurkat cells in an MTNP. (B) The resultant IM-MS spectrum collected from these cells with a desalting column load time of 2 hours to concentrate secreted material. The column was rinsed with 1 mL of water containing 0.1% acetic acid and then eluted with 50 μL of methanol containing 0.1% acetic acid. A portion of this 50 μL was spotted onto a MALDI plate and produced the IM-MS spectrum shown. (C) Control spectrum of medium used in spectrum (B) containing no cellular excretion. This medium was spotted on a MALDI plate under the same matrix conditions as the effluent from (B).
4 Future Outlook
Our preliminary work shows the potential for this system to provide temporally resolved systems biology data directly from complex samples. With our microfluidic and IM-MS technologies working in tandem, a multitude of new experiments becomes possible. One study that is of particular interest involves the use of differential, multiplexed IM-MS data interpretation. Figure 6 displays a microfluidic chip design which allows for the trapping of two different cell populations to investigate paracrine and autocrine signaling. Media is provided to the system through the left-most inlet. The first outlet allows for desalting and IM-MS characterization of any background contributions from the media components. Media, including any added chemical or biological stimuli, flows over the first cell population and induces a response. This effluent is split, with a portion going to the second outlet, where it is desalted and analyzed by IM-MS to determine the differential, cell-induced changes relative to the base media. The other fraction of the first-trap effluent perfuses the second population of cells, and the effluent from this second trap is directed to the third outlet and analyzed to elucidate the cell-to-cell mediated response. All three outlets will be analyzed in real time by using a custom-built multiplexed 8-channel IM-MS instrument currently under construction. This would allow for continuous sampling of up to 8 flow streams, all of which are handled independently throughout the instrument. This arrangement allows for simultaneous measurement of seven experimental channels and one control. Special software packages can be used to explore differential signals to easily determine which species are being produced as a result of being directly downstream of a different cell population. An obvious experiment would be to identify the factor secreted by dendritic cells that induces a calcium response in naïve, CD4+ human T cells [11].
Figure 6.
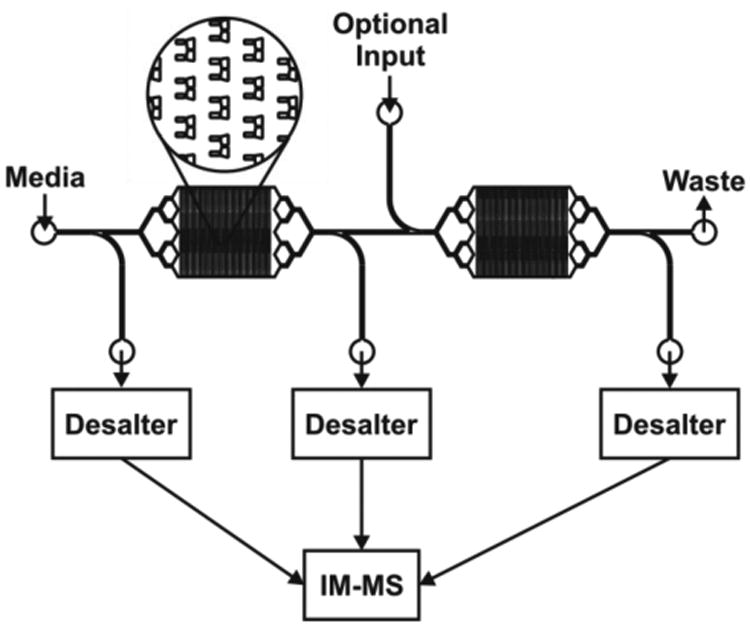
(A) An example of a trap currently under development. This device will be used to perform differential studies whereby two cell populations can be probed simultaneously. Media will be supplied through the first inlet with a small portion running through the desalter and into the IM-MS to procide a control sample. Any paracrine or autocrine signaling material secreted by the first cell population would perifuse the second population, with a small fraction being collected by the second outlet. Finally the resultant secreted material from the second population would be analyzed through use of the third outlet port. These three signals could be analyzed in a differential manner to easily identify unique peaks in each effluent. Simultaneous IM-MS analysis could be achieved using a multiple nano-spray, multiple drift tube design as described in the text.
We are currently automating this experiment for a “robot scientist” approach [60,61] with closed-loop control and symbolic regression of the underlying dynamical equations [3,4]. An automated microformulator will assemble on demand media whose various components and additional stimuli or toxins are stored separately and can be supplied independently or in combination with one another. Ultimately both the control of the microformulator and the quantitative analysis of the data will be provided through machine-learning algorithms developed by Lipson et al. at Cornell [3,4,5]. Their self-modeling algorithm interprets the media components/stimuli as variable inputs and monitors the mass and other biological signals as outputs. Once the first data set is sent electronically from our platform to Cornell the algorithm will interpret the data and identify candidate models for the biological system. The algorithm will then select a set of media conditions which it determines would best discriminate between the candidate models. This media condition command will then be relayed back to the microformulator and the new media mixture supplied to the cell population for the next experiment, thus producing a self-investigating robot scientist that derives a model of the metabolic or signaling network under investigation.
Acknowledgments
Financial support for this work was provided by the Vanderbilt University College of Arts and Science, the Vanderbilt Institute for Integrative Biosystems Research and Education, the Vanderbilt Institute of Chemical Biology, the US Defense Threat Reduction Agency (HDTRA-09-1-0013), the NIH National Institute on Drug Abuse (RC2DA028981), the National Academies Keck Futures Initiative, Ionwerks Inc., and Waters Corp. We thank Todd Graham and Anthony Weil for their advice and assistance with the yeast studies, and Hod Lipson and Michael Schmidt for their guidance on machine learning.
References
- 1.Huang S, Wikswo J. Dimensions of systems biology. In: Amara SG, Bamberg E, Gudermann T, Hebert SC, Jahn R, Lederer WJ, Lill R, Miyajima A, Offermanns S, editors. Reviews of Physiology, Biochemistry and Pharmacology. Vol. 157. 2006. pp. 81–104. [DOI] [PubMed] [Google Scholar]
- 2.Wikswo JP, Prokop A, Baudenbacher F, Cliffel D, Csukas B, Velkovsky M. Engineering challenges of BioNEMS: the integration of microfluidics, and micro- and nanodevices, models, and external control for systems biology. IEE Proceedings Nanobiotechnology. 2006;153(4):81–101. doi: 10.1049/ip-nbt:20050045. [DOI] [PubMed] [Google Scholar]
- 3.Schmidt M, Lipson H. Distilling Free-Form Natural Laws from Experimental Data. Science. 2009;324(5923):81–85. doi: 10.1126/science.1165893. [DOI] [PubMed] [Google Scholar]
- 4.Bongard J, Lipson H. Automated reverse engineering of nonlinear dynamical systems. Proceedings of the National Academy of Sciences. 2007;104(24):9943–9948. doi: 10.1073/pnas.0609476104. [DOI] [PMC free article] [PubMed] [Google Scholar]
- 5.Bongard J, Zykov V, Lipson H. Resilient machines through continuous self modeling. Science. 2006;314(5802):1118–1121. doi: 10.1126/science.1133687. [DOI] [PubMed] [Google Scholar]
- 6.Anderson NL, Anderson NG. The human plasma proteome - History, character, and diagnostic prospects. Molecular & Cellular Proteomics. 2002;1(11):845–867. doi: 10.1074/mcp.r200007-mcp200. [DOI] [PubMed] [Google Scholar]
- 7.Service RF. Proteomics - Public projects gear up to chart the protein landscape. Science. 2003;302(5649):1316–1318. doi: 10.1126/science.302.5649.1316. [DOI] [PubMed] [Google Scholar]
- 8.Brigotti M, Caprioli A, Tozzi AE, Tazzari PL, Ricci F, Conte R, Carnicelli D, Procaccino MA, Minelli F, Ferretti AVS, Paglialonga F, Edefonti A, Rizzoni G. Shiga toxins present in the gut and in the polymorphonuclear leukocytes circulating in the blood of children with hemolytic-uremic syndrome. Journal of Clinical Microbiology. 2006;44(2):313–317. doi: 10.1128/JCM.44.2.313-317.2006. [DOI] [PMC free article] [PubMed] [Google Scholar]
- 9.Sia SK, Whitesides GM. Microfluidic devices fabricated in poly(dimethylsiloxane) for biological studies. Electrophoresis. 2003;24(21):3563–3576. doi: 10.1002/elps.200305584. [DOI] [PubMed] [Google Scholar]
- 10.Whitesides GM, Ostuni E, Takayama S, Jiang XY, Ingber DE. Soft lithography in biology and biochemistry. Annual Review of Biomedical Engineering. 2001;3:335–373. doi: 10.1146/annurev.bioeng.3.1.335. [DOI] [PubMed] [Google Scholar]
- 11.Faley S, Seale K, Hughey J, Schaffer DK, VanCompernolle S, McKinney B, Baudenbacher F, Unutmaz D, Wikswo JP. Microfluidic platform for real-time signaling analysis of multiple single T cells in parallel. Lab on a Chip. 2008;8:1700–1712. doi: 10.1039/b719799c. [DOI] [PMC free article] [PubMed] [Google Scholar]
- 12.Whitesides GM. The origins and the future of microfluidics. Nature. 2006;442(7101):368–373. doi: 10.1038/nature05058. [DOI] [PubMed] [Google Scholar]
- 13.Faley SL, Copland M, Wlodkowic D, Kolch W, Seale KT, Wikswo JP, Cooper JM. Microfluidic single cell arrays to interrogate signalling dynamics of individual, patient-derived hematopoietic stem cells. Lab on a Chip. 2009;9(18):2659–2664. doi: 10.1039/b902083g. [DOI] [PubMed] [Google Scholar]
- 14.Warnement MR, Faley SL, Wikswo JP, Rosenthal SJ. Quantum dot probes for monitoring dynamic cellular response: Reporters of T cell activation. IEEE Transactions on NanoBioscience. 2006;5(4):268–272. doi: 10.1109/tnb.2006.886573. [DOI] [PubMed] [Google Scholar]
- 15.Eklund SE, Cliffel DE, Kozlov E, Prokop A, Wikswo JP, Jr, Baudenbacher FJ. Modification of the Cytosensor ™ Microphysiometer to Simultaneously Measure Extracellular Acidification and Oxygen Consumption Rates. Analytica Chimica Acta. 2003;496(1-2):93–101. [Google Scholar]
- 16.Eklund SE, Taylor D, Kozlov E, Prokop A, Cliffel DE. A microphysiometer for simultaneous measurement of changes in extracellular glucose, lactate, oxygen, and acidification rate. Analytical Chemistry. 2004;76(3):519–527. doi: 10.1021/ac034641z. [DOI] [PubMed] [Google Scholar]
- 17.Eklund SE, Snider RM, Wikswo J, Baudenbacher F, Prokop A, Cliffel DE. Multianalyte microphysiometry as a tool in metabolomics and systems biology. Journal of Electroanalytical Chemistry. 2006;587(2):333–339. [Google Scholar]
- 18.Eklund SE, Thompson RG, Snider RM, Carney CK, Wright DW, Wikswo J, Cliffel DE. Metabolic discrimination of select list agents by monitoring cellular responses in a multianalyte microphysiometer. Sensors. 2009;9(3):2117–2133. doi: 10.3390/s90302117. [DOI] [PMC free article] [PubMed] [Google Scholar]
- 19.Werdich A, Lima EA, Ivanov B, Ges I, Wikswo JP, Baudenbacher FJ. A Microfluidic Device to Confine a Single Cardiac Myocyte in a Sub-nanoliter Volume on Planar Microelectrodes for Extracellular Potential Recordings. Lab on a Chip. 2004;4(4):357–362. doi: 10.1039/b315648f. [DOI] [PubMed] [Google Scholar]
- 20.Ges IA, Ivanov BL, Schaffer DK, Lima EA, Werdich AA, Baudenbacher FJ. Thin-film IrOx pH Microelectrode for Microfluidic-based Microsystems. Biosensors and Bioelectronics. 2005;21:248–256. doi: 10.1016/j.bios.2004.09.021. [DOI] [PubMed] [Google Scholar]
- 21.Ges IA, Ivanov BL, Werdich AA, Baudenbacher FJ. Differential pH measurements of metabolic cellular activity in nl culture volumes using microfabricated iridium oxide electrodes. Biosensors and Bioelectronics. 2007;22(7):1303–1310. doi: 10.1016/j.bios.2006.05.033. [DOI] [PubMed] [Google Scholar]
- 22.Ges IA, Dzhura IA, Baudenbacher FJ. On-chip acidification rate measurements from single cardiac cells confined in sub-nanoliter volumes. Biomedical Microdevices. 2008;10(3):347–354. doi: 10.1007/s10544-007-9142-7. [DOI] [PMC free article] [PubMed] [Google Scholar]
- 23.Ges IA, Baudenbacher F. Microfluidic device to confine single cardiac myocytes in sub-nanoliter volumes for extracellular pH measurements. Journal of Experimental Nanoscience. 2008;3(1):63–75. [Google Scholar]
- 24.Ges IA, Baudenbacher FJ. Microfabricated amperometric enzyme sensors to monitor cell metabolism in microfluidic devices [Google Scholar]
- 25.Chen HS, Rejtar T, Andreev V, Moskovets E, Karger BL. High-speed, high-resolution monolithic capillary LC-MALDI MS using an off-line continuous deposition interface for proteomic analysis. Analytical Chemistry. 2005;77(8):2323–2331. doi: 10.1021/ac048322z. [DOI] [PubMed] [Google Scholar]
- 26.Roper MG, Shackman JG, Dahlgren GM, Kennedy RT. Microfluidic chip for continuous monitoring of hormone secretion from live cells using an electrophoresis-based immunoassay. Analytical Chemistry. 2003;75(18):4711–4717. doi: 10.1021/ac0346813. [DOI] [PubMed] [Google Scholar]
- 27.Cellar NA, Burns ST, Meiners JC, Chen H, Kennedy RT. Microfluidic Chip for Low-Flow Push-Pull Perfusion Sampling in Vivo with On-Line Analysis of Amino Acids. Analytical Chemistry. 2005;77(21):7067–7073. doi: 10.1021/ac0510033. [DOI] [PubMed] [Google Scholar]
- 28.Shackman JG, Dahlgren GM, Peters JL, Kennedy RT. Perfusion and chemical monitoring of living cells on a microfluidic chip. Lab on a Chip. 2005;5:56–63. doi: 10.1039/b404974h. [DOI] [PubMed] [Google Scholar]
- 29.Cellar NA, Kennedy RT. A capillary-PDMS hybrid chip for separations-based sensing of neurotransmitters in vivo. Lab on a Chip. 2006;6(9):1205–1212. doi: 10.1039/b603561b. [DOI] [PubMed] [Google Scholar]
- 30.Oleschuk RD, Harrison DJ. Analytical microdevices for mass spectrometry. Trac-Trends in Analytical Chemistry. 2000;19(6):379–388. [Google Scholar]
- 31.Chan JH, Timperman AT, Qin D, Aebersold R. Microfabricated polymer devices for automated sample delivery of peptides for analysis by electrospray ionization tandem mass spectrometry. Analytical Chemistry. 1999;71(20):4437–4444. doi: 10.1021/ac9906678. [DOI] [PubMed] [Google Scholar]
- 32.Chiou CH, Lee GB, Hsu HT, Chen PW, Liao PC. Micro devices integrated with microchannels and electrospray nozzles using PDMS casting techniques. Sensors and Actuators B-Chemical. 2002;86(2-3):280–286. [Google Scholar]
- 33.Jiang Y, Wang PC, Locascio LE, Lee CS. Integrated plastic microftuidic devices with ESI-MS for drug screening and residue analysis. Analytical Chemistry. 2001;73(9):2048–2053. doi: 10.1021/ac001474j. [DOI] [PubMed] [Google Scholar]
- 34.Krenkova J, Foret F. Immobilized microfluidic enzymatic reactors. Electrophoresis. 2004;25(21-22):3550–3563. doi: 10.1002/elps.200406096. [DOI] [PubMed] [Google Scholar]
- 35.Lee J, Soper SA, Murray KK. Development of an efficient on-chip digestion system for protein analysis using MALDI-TOF MS. Analyst. 2009;134(12):2426–2433. doi: 10.1039/b916556h. [DOI] [PubMed] [Google Scholar]
- 36.Mellors JS, Gorbounov V, Ramsey RS, Ramsey JM. Fully integrated glass microfluidic device for performing high-efficiency capillary electrophoresis and electrospray ionization mass spectrometry. Analytical Chemistry. 2008;80(18):6881–6887. doi: 10.1021/ac800428w. [DOI] [PMC free article] [PubMed] [Google Scholar]
- 37.Liu XY, Valentine SJ, Plasencia MD, Trimpin S, Naylor S, Clemmer DE. Mapping the human plasma proteome by SCX-LC-IMS-MS. Journal of the American Society for Mass Spectrometry. 2007;18(7):1249–1264. doi: 10.1016/j.jasms.2007.04.012. [DOI] [PMC free article] [PubMed] [Google Scholar]
- 38.Fenn LS, Mclean JA. Biomolecular structural separations by ion mobility-mass spectrometry. Analytical and Bioanalytical Chemistry. 2008;391(3):905–909. doi: 10.1007/s00216-008-1951-x. [DOI] [PubMed] [Google Scholar]
- 39.Fenn LS, Kliman M, Mahsut A, Zhao SR, Mclean JA. Characterizing ion mobility-mass spectrometry conformation space for the analysis of complex biological samples. Analytical and Bioanalytical Chemistry. 2009;394:235–244. doi: 10.1007/s00216-009-2666-3. [DOI] [PMC free article] [PubMed] [Google Scholar]
- 40.Fenn LS, Mclean JA. Simultaneous glycoproteomics on the basis of structure using ion mobility-mass spectrometry. Molecular Biosystems. 2009;I5(11):1298–1302. doi: 10.1039/b909745g. [DOI] [PubMed] [Google Scholar]
- 41.Mclean JA. The mass-mobility correlation redux: the conformational landscape of anhydrous biomolecules. Journal of the American Society for Mass Spectrometry. 2009;20(10):1775–1781. doi: 10.1016/j.jasms.2009.06.016. [DOI] [PubMed] [Google Scholar]
- 42.Aebersold R, Mann M. Mass spectrometry-based proteomics. Nature. 2003;422(6928):198–207. doi: 10.1038/nature01511. [DOI] [PubMed] [Google Scholar]
- 43.Valaskovic GA, Kelleher NL, McLafferty FW. Attomole protein characterization by capillary electrophoresis mass spectrometry. Science. 1996;273(5279):1199–1202. doi: 10.1126/science.273.5279.1199. [DOI] [PubMed] [Google Scholar]
- 44.Clemmer DE, Hyzler CSH, Srebalus CA. Multidimensional nested ion-mobility/time-of-flight mass spectrometry for the analysis of complex biological mixtures. Abstracts of Papers of the American Chemical Society. 2001;222:U9. [Google Scholar]
- 45.Counterman AE, Valentine SJ, Srebalus CA, Henderson SC, Hoaglund CS, Clemmer DE. High-order structure and dissociation of gaseous peptide aggregates that are hidden in mass spectra. Journal of the American Society for Mass Spectrometry. 1998;9(8):743–759. doi: 10.1016/S1044-0305(98)00052-X. [DOI] [PubMed] [Google Scholar]
- 46.Srebalus CA, Li JW, Marshall WS, Clemmer DE. Gas phase separations of electrosprayed peptide libraries. Analytical Chemistry. 1999;71(18):3918–3927. doi: 10.1021/ac9903757. [DOI] [PubMed] [Google Scholar]
- 47.Moon MH, Myung S, Plasencia M, Hilderbrand AE, Clemmer DE. Nanoflow LC/ion mobility/CID/TOF for proteomics: analysis of a human urinary Proteome. Journal of Proteome Research. 2003;2(6):589–597. doi: 10.1021/pr034018v. [DOI] [PubMed] [Google Scholar]
- 48.McLean JA, Schultz JA, Woods AS. Ion mobility-mass spectrometry. In: Cole RB, editor. Electrospray and MALDI Mass Spectrometry: Fundamentals, Instrumentation, Practicabilities, and Biological Applications. 2nd. John Wiley and Sons; 2010. pp. 411–439. [Google Scholar]
- 49.Kanu AB, Dwivedi P, Tam M, Matz L, Hill HH. Ion mobility-mass spectrometry. Journal of Mass Spectrometry. 2008;43(1):1–22. doi: 10.1002/jms.1383. [DOI] [PubMed] [Google Scholar]
- 50.McDaniel EW. Collision Phenomena in Ionized Gases. John Wiley & Sons; 1964. [Google Scholar]
- 51.Mason EA, McDaniel EW. Transport properties of ions in gases. John Wiley & Sons; 1988. [Google Scholar]
- 52.McDaniel EW, Viehland LA. The Transport of Slow Ions in Gases - Experiment, Theory, and Applications. Physics Reports-Review Section of Physics Letters. 1984;110(5-6):333–367. [Google Scholar]
- 53.May JC, Sundarapandian S, McLean JA. Submitted to Analytical Chemistry. 2010 doi: 10.1021/ac902980r. [DOI] [PMC free article] [PubMed] [Google Scholar]
- 54.Rohner TC, Staab D, Stoeckli M. MALDI mass spectrometric imaging of biological tissue sections. Mechanisms of Ageing and Development. 2005;126(1):177–185. doi: 10.1016/j.mad.2004.09.032. [DOI] [PubMed] [Google Scholar]
- 55.Emmett MR, Caprioli RM. Micro-Electrospray Mass-Spectrometry - Ultra-High-Sensitivity Analysis of Peptides and Proteins. Journal of the American Society for Mass Spectrometry. 1994;5(7):605–613. doi: 10.1016/1044-0305(94)85001-1. [DOI] [PubMed] [Google Scholar]
- 56.Hennion MC. Solid-phase extraction: method development, sorbents, and coupling with liquid chromatography. Journal of Chromatography A. 1999;856(1-2):3–54. doi: 10.1016/s0021-9673(99)00832-8. [DOI] [PubMed] [Google Scholar]
- 57.Wu QY, Liu CL, Smith RD. On-line microdialysis desalting for electrospray ionization mass spectrometry of proteins and peptides. Rapid Communications in Mass Spectrometry. 1996;10(7):835–838. [Google Scholar]
- 58.Jakubowski JA, Hatcher NG, Sweedler JV. Online microdialysis-dynamic nanoelectrospray ionization-mass spectrometry for monitoring neuropeptide secretion. Journal of Mass Spectrometry. 2005;40(7):924–931. doi: 10.1002/jms.869. [DOI] [PubMed] [Google Scholar]
- 59.Fabrizio P, Longo VD. The chronological life span of Saccharomyces cerevisiae. Aging Cell. 2003;2(2):73–81. doi: 10.1046/j.1474-9728.2003.00033.x. [DOI] [PubMed] [Google Scholar]
- 60.King RD, Rowland J, Oliver SG, Young M, Aubrey W, Byrne E, Liakata M, Markham M, Pir P, Soldatova LN, Sparkes A, Whelan KE, Clare A. The Automation of Science. Science. 2009;324(5923):85–89. doi: 10.1126/science.1165620. [DOI] [PubMed] [Google Scholar]
- 61.Soldatova LN, Clare A, Sparkes A, King RD. An ontology for a Robot Scientist. Bioinformatics. 2006;22(14):e464–e471. doi: 10.1093/bioinformatics/btl207. [DOI] [PubMed] [Google Scholar]