Abstract
DNA label-retention, or retention of a thymidine analog, is a characteristic of slow cycling cells and has been used to identify stem cells in several organ systems. Recent findings have demonstrated inconsistent localization of label-retaining cells (LRCs) in the kidney. Differences in the dose and timing of administration of deoxyuridine, the length of the chase period, and the species of animal used have made understanding the distinctions between these findings difficult. In the present studies, we utilized a dual loading scheme in the same animal to demonstrate that the cells labeled at different ages identified independent populations of LRC that distributed globally in an anti-parallel manner in the kidney. Loading with a DNA label in neonates identified LRC more often in the papilla, while administering the DNA label in adult mice identified LRC prominently in the cortex and the outer medulla. Furthermore, the tissue compartment distribution (epithelial-endothelial-interstitial) as well as the specific distribution within the nephron epithelia differed for these populations. These findings highlighted the complexity of the dynamics of cell proliferation in the kidney throughout the postnatal and adult period and call attention to the confusion associated with the term “label-retaining cells” for different timings of the loading and chase periods. This study indicated that the results of previous studies should be viewed as nonoverlapping and that further studies are needed to ascertain the role of each of these populations in the steady-state maintenance and injury recovery of the kidney.
Keywords: label-retaining cells, renal stem cell, thymidine analogs
nuclear retention of thymidine analogs has traditionally been used as a tool to study cell cycle events. By virtue of their slow cycling, retention of this DNA label has also been used as a surrogate marker of stem cells in several organ systems (4, 18, 19). The protocol to identify label-retaining cells (LRCs) includes incorporation of a thymidine analog in all cycling cells followed by a “chase” period in the absence of the labeled analog. During this “chase” period, faster cycling cells dilute the label to a point below that which is detectable. Thus, label-retention is seen in slow cycling cells. This methodology is particularly useful in the investigation of a renal stem cell, as in a solid organ such as the kidney, tissue must be disrupted to obtain individual cell populations for study. Importantly, whether the process of disruption results in preservation of certain cells while others are lost has not been identified and is avoided in an in situ examination.
With the use of this in situ approach, LRCs have been described in the kidney and, in some cases, have been purported to include a renal stem cell or a regenerative capacity (3, 6, 11, 13, 16). However, the results have been confusing due to the differences in the loading paradigms, the length of the chase period, the strains of animals used, and the specific acute kidney injury (AKI) model employed in these studies. Loading during the gestational period suggests that LRCs are present primarily at the corticomedullary junction as well as in the papilla (6). Loading during the neonatal period also suggests a preponderance of LRCs in the papilla, although varying amounts of cells are found in the outer medulla and cortex depending on the number of days of loading and the timing of administration of the thymidine analog within this first week (3, 16). Thymidine analog loading in the adult animal, however, suggests that the LRCs are predominantly distributed in the cortex and outer medulla with very few if any in the papilla (11). The lack of concordance of the gross distribution of cells makes comparison of these findings impossible. Furthermore, in models of AKI, a proliferative response in the first 24–48 h was seen in some studies, while others demonstrated no support for a role for LRCs in repair from AKI (3, 6, 11, 13, 16). One potential explanation for the differing distributions and responses to AKI is that these LRCs are not the same population. To progress in the investigation of renal LRCs, clarity regarding the cells under study is essential. The purpose of the present study was to determine whether there are multiple distinct populations of LRCs in the kidney and to elucidate their distribution within the different regions of the nephron.
METHODS
All protocols in this study were submitted to and approved by the University of Alabama at Birmingham's Institutional Animal Care and Use Committee (IACUC).
Labeling of slow cycling cells.
Thymidine analogs 5-chloro-2-deoxyuridine (CldU; 0.358 μmol·g body wt−1·day−1; Sigma, St. Louis, MO) and 5-iodo-2-deoxyuridine (IdU; 0.358 μmol·g body wt−1·day−1; Sigma) were injected intraperitoneally into female C57BL/6 mice, as described below. These concentrations are molar equivalents of a 5-bromo-2-deoxyuridine dose of 110 μg·g body wt−1·day−1. The mice were divided into three groups according to the pair-wise labeling paradigm (Fig. 1). Early-Late (E/L) double-labeling (n = 3 mice): C57BL/6 mice were given a daily intraperitoneal injection of CldU on postnatal days 1 and 2; cells identified using this protocol were termed early neonatal LRCs. The same mice were given daily intraperitoneal injections of IdU on postnatal days 3–6 to label cells termed late neonatal LRCs. Late-Adult (L/A) double-labeling (n = 2 mice): C57BL/6 mice were given a daily intraperitoneal injection of CldU on postnatal days 3–6 to label late neonatal LRCs followed by seven daily intraperitoneal injections of IdU during the 9th week to label cells termed adult LRCs. Early-Adult (E/A) double-labeling (n = 3 mice): C57BL/6 mice were given daily intraperitoneal injections of CldU on postnatal days 1 and 2 to label the early neonatal LRCs and subsequently given intraperitoneal injections of IdU during their 9th week to label the adult LRCs. Each of the three loading schemes was chosen to reflect the protocols used by others to identify LRC (3, 11, 16). All mice were allowed to grow to an age of 12 wk when their kidneys were harvested and processed for frozen embedding (Fig. 1). When populations of LRCs were examined individually, all mice that had that loading paradigm were included, which provided five to six mice in each group.
Fig. 1.
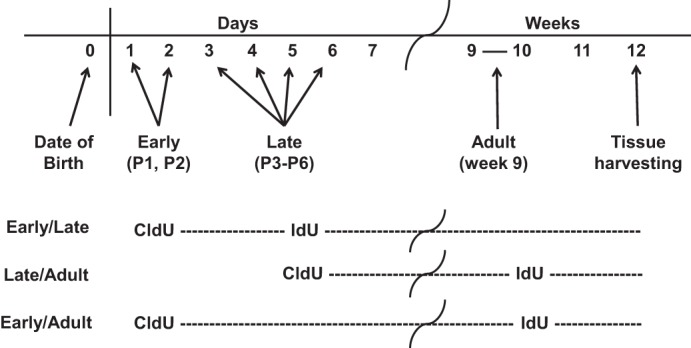
Scheme for the pair-wise loading of deoxyuridines. Female C57BL/6 mice were loaded in a pair-wise manner on days 1 and 2 [early neonatal label-retaining cells (LRCs)], days 3–6 (late neonatal LRCs), and/or daily during the 9th week (adult LRCs) with 2 deoxyuridine preparations. All mice were euthanized at 12 wk and tissues were harvested for analysis.
Tissue processing.
At 12 wk of age, the kidneys were removed and placed in cold PBS. Each kidney was processed for fixation in 4% paraformaldehyde in PBS for 30 min at 4°C. After being washed in PBS, kidneys were cryopreserved in 20% sucrose and embedded in optimal cutting temperature (OCT) freezing media.
Identification of LRCs.
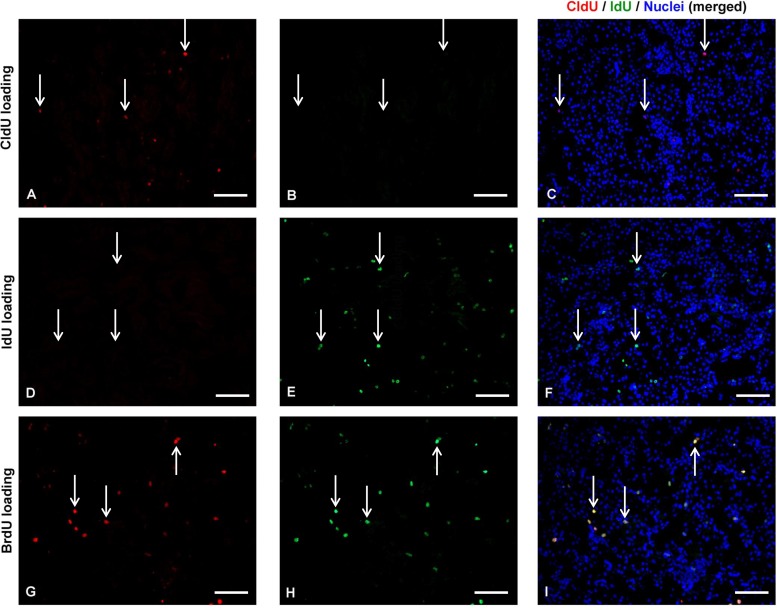
Tissue sections (5-μm thick) were washed in PBS and pretreated with 70% ethanol at −20°C for 10 min. Autofluorescence was reduced by incubation in 50 mM NH4Cl in PBS for 15 min. Nuclear antigen retrieval was achieved by incubation of the sections in 2 N HCl for 10 min, followed by neutralization in 0.1 M sodium tetraborate, pH 8.5, for 10 min. Nonspecific staining in the sections was blocked by incubation in 2% normal horse serum in PBS for 1 h followed by specific staining of primary antibodies. For detection of IdU, a mouse-on-mouse kit (Vector Laboratories, Burlingame, CA) was used per manufacturer's protocol with an anti-BrdU antibody (BD Biosciences Pharmingen, San Jose, CA) that recognized IdU, but not CldU. For CldU detection, a rat anti-BrdU antibody (Abcam, Cambridge, MA) that recognized CldU, but not IdU, was used. A high-salt wash was used to eliminate any nonspecific cross-reactivity of the antibodies. The specificity of these antibodies was confirmed by immunostaining with both antibodies in kidneys from animals loaded with either CldU or IdU. Kidneys from animals loaded with BrdU, which was stained by both antibodies, served as the positive control (Fig. 2). Nuclei were identified by DAPI label in the mounting media (VectaShield, Vector Laboratories).
Fig. 2.
Antigen specificity of the antibodies differentially labeling 5-chloro-2-deoxyuridine (CldU) and 5-iodo-2-deoxyuridine (IdU). C57BL/6 mice were loaded with CldU only (A–C), IdU only (D–F), or with 5-bromo-2-deoxyuridine (BrdU; G–I). Sections from the kidneys of these mice loaded with different deoxyuridines were stained for detecting the presence of both CldU (using rat anti-BrdU; Abcam, Cambridge, MA; red stain) and IdU (using anti-BrdU antibody; Biosciences Pharmingen, San Jose, CA; green stain). Within each row of images, white arrows indicate the position of the same nuclei. Merged images (including the nuclei identified by DAPI label) demonstrate that these antibodies independently identify CldU (A–C) and IdU (D–F) within nuclei of the outer medulla. Both antibodies identify the presence of BrdU (G–I).
Compartment-specific identification of LRCs.
To determine the distribution of the LRCs in epithelial, endothelial, and interstitial compartments, sections were stained as above with one of the LRCs followed by labeling of epithelia with either antibody to Na-K-ATPase (Abcam) in the cortex and outer medulla or with a cocktail of antibodies to epithelia in papilla including antibody to aquaporin-2 (AQP2; Santa Cruz, Dallas, TX) which is expressed in the collecting duct, antibody to kidney-specific chloride channel (ClC-KA; Santa Cruz) which is expressed in the ascending limb of the loop of Henle, and antibody to AQP1 (Santa Cruz) which is expressed in the thin descending limb of the loop of Henle and in endothelial cells. To confirm expression in endothelial cells in the papilla, sections were stained for one of the LRCs followed by labeling with antibody to MECA32 (BD Biosciences Pharmingen). The average percentage of LRCs that were positive for MECA32 labeling was subtracted from the average percentage labeled with the cocktail to indicate the percentage of epithelial cells in the papilla. LRCs that did not colocalize with epithelial or endothelial markers were considered as part of the interstitial compartment.
Nephron segment-specific distribution of LRCs.
Sections were stained as above to visualize each LRC followed by staining for proteins specific to different nephron segments. In the cortex and outer medulla, dark staining with antibody to Na-K-ATPase was used to identify cells of the distal tubule. Lotus tetragonolobus lectin (LTL; Vector Laboratories) was used to identify the proximal tubule (PT) in the cortex and outer medulla. Labeling of the collecting duct (CD) in all the gross regions of the kidney was identified using antibody to AQP2. To determine labeling within the loop of Henle, the average percentage of cells labeled with AQP2 and that of MECA32 were subtracted from the average number of cells labeled in the cocktail staining as above.
Imaging of LRCs.
Stained sections were viewed by epifluorescence microscopy (Leica, DM, IRB). For the double dU experiment, the papilla was imaged at ×300 magnification [high-powered field (hpf)] and subsequently, a montage was created using Photoshop (Adobe, San Jose, CA). By using this approach, we could observe the relative distribution of the different LRC populations in different areas of the papilla. For quantitation in this experiment in the papilla, five separate hpf images were taken from the montage.
For the cortex and outer medulla regions of the double dU experiment and for all other experiments, three to five hpf images were obtained in each region for each animal. Representative images were obtained from the outer stripe and the inner stripe of the outer medulla to quantify the labeling. Images were merged and adjusted using Photoshop and counts were enumerated from these full-scale images by a single individual to provide greater consistency from experiment-to-experiment and animal-to-animal. LRCs were identified as nuclei containing any dU+ label that colocalized with DAPI. The dU+, DAPI+ nuclei that were associated with a cell-specific label were counted as part of that cellular compartment. The average numbers of LRCs present within a hpf were obtained for each animal. Mean percentages were calculated for the compartment-specific stains relative to the average total number of LRCs for comparison across groups. Representative images were selected based on consistency with the statistical analyses.
Statistical analysis.
Data for each staining pattern were represented as means ± SE. General linear models (ANOVA) were used to determine differences between groups within each staining pattern. Post hoc tests using Tukey's method were used to compare the means. Statistical significance was considered at a P value <0.05. All analyses were conducted using Proc GLM in SAS Version 9.3.
RESULTS
Labeling of LRCs identified different gross distributions in the kidney.
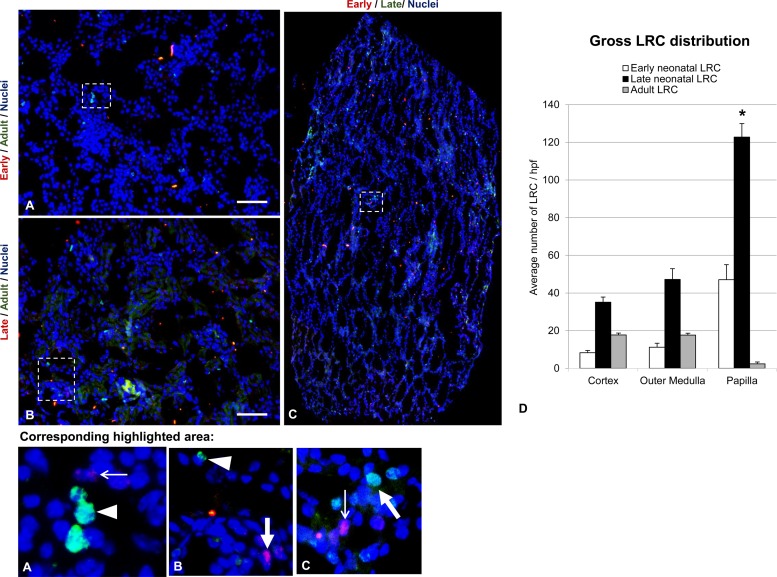
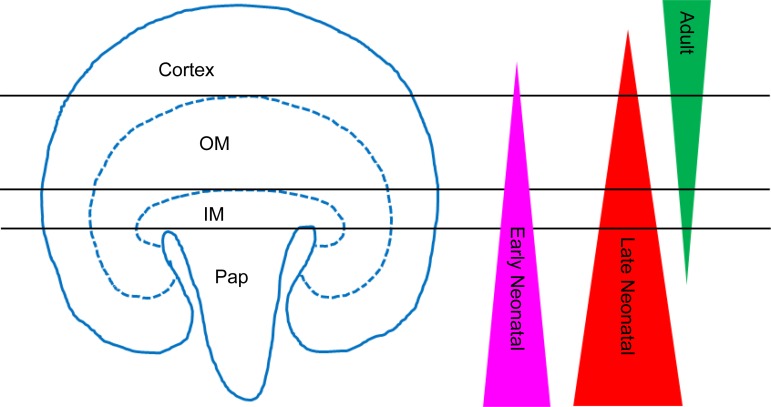
In absolute numbers, in each gross region of the kidney the late neonatal LRCs represented the largest population of all LRC in that region (Fig. 3). The adult LRC population outnumbered the early neonatal LRC population in the cortex and outer medulla, while the reverse was true in the papilla (Fig. 3). Specifically, the late neonatal LRC population exhibited the highest average number of cells in the cortex (35.1 ± 2.7 cells/hpf, n = 5) and outer medulla (47.2 ± 5.7 cells/hpf, n = 5), while the adult LRC and the early neonatal LRC were found at much lower average numbers in the cortex (adult LRC: 17.7 ± 2.4 cells/hpf, n = 5; early neonatal LRC: 8.3 ± 1.2 cells/hpf, n = 6) and outer medulla (adult LRC: 17.7 ± 2.6 cells/hpf, n = 5; early neonatal LRC: 11.2 ± 2.1 cells/hpf, n = 6), although differences between populations in these regions did not reach significance (P > 0.05). Higher average numbers of early and late neonatal LRC were observed in the papilla (early neonatal LRC: 47.0 ± 8.0 cells/hpf, n = 6; late neonatal LRC: 122.8 ± 7.2 cells/hpf, n = 5). In contrast, the average number of adult LRC in the papilla was very low (2.4 ± 0.5 cells/hpf, n = 5). Within each population of LRCs, the cortex and outer medulla values were each significantly different from the values in the papilla (P < 0.0001 in all cases). While not specifically quantified, the relative distribution of each of the LRC populations in the papilla appeared different. Early neonatal LRCs had a more uniform distribution throughout the papilla. Although the late neonatal LRCs are distributed throughout the papilla in greater numbers than the early neonatal LRCs, late LRCs appeared to distribute more to the upper papilla. Adult LRCs similarly appeared to be denser in the upper papilla.
Fig. 3.
Global distributions of independent LRC populations. Double labeling of LRCs by immunofluorescence in kidneys of pair-wise labeled mice shows no colocalization of labels, suggesting independent cell populations. Highlighted regions are shown magnified in the bottom row of images. Nuclei are stained with DAPI (blue) in all images. Thin white arrows indicate a representative CldU-stained nuclei of the early neonatal LRC in the highlighted sections shown in the bottom row of images. A representative positively stained late neonatal LRC nucleus is indicated by the thick white arrow in the highlighted sections shown in the bottom row of images. A representative IdU-stained nucleus of the adult LRC is shown by the white arrowhead in the highlighted sections shown at increased magnification in the bottom row of images. The scale bar in A and B, high-powered field (hpf) images of the cortex, represents 200 μm. C: montage of hpf images of the papilla. D: graphical representation of the average number of early neonatal, late neonatal, and adult LRCs per hpf in the gross regions of the kidney. The * indicates statistical significance of the number of LRCs in papilla relative to the other 2 regions within each of the LRC populations (P < 0.001). Within each LRC population, the average numbers of labeled cells in the cortex and outer medullary regions did not differ significantly from each other.
Colocalization of the two deoxyuridines (CldU and IdU) in the same cell was infrequently observed between the different loading paradigms for deoxyuridine in any region of the kidney (Fig. 3). The highest percent overlap was exhibited in the loading paradigms that included the late neonatal load; however, the average numbers of double-labeled cells per animal were no more than 2 per hpf in any of the combinations examined in any region of the kidney. The early neonatal LRC and late neonatal LRC populations displayed some overlap in the cortex (0.75% of the early and 4.50% of the late) and papilla (0.84% of the early and 2.78% of the late). Overlap between the late neonatal LRC and adult LRC was only seen in the outer medulla (2.83% of the late and 1.29% of the adult). All other regions showed no overlap for any of the combinations of double-labeling. These results suggested that the three LRC populations were distinct.
Epithelial, endothelial, and interstitial distributions of LRCs identified unique differences in the LRC populations.
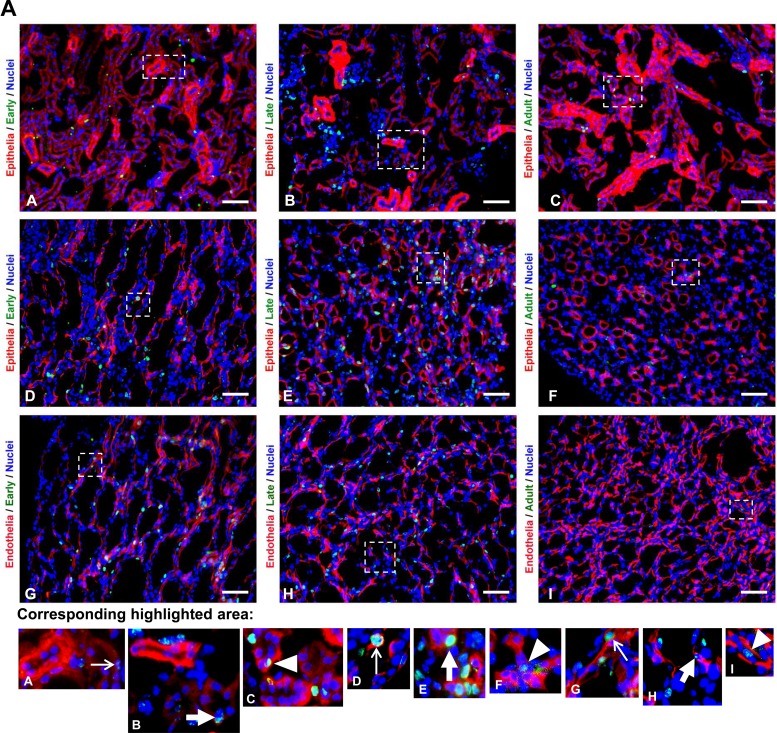
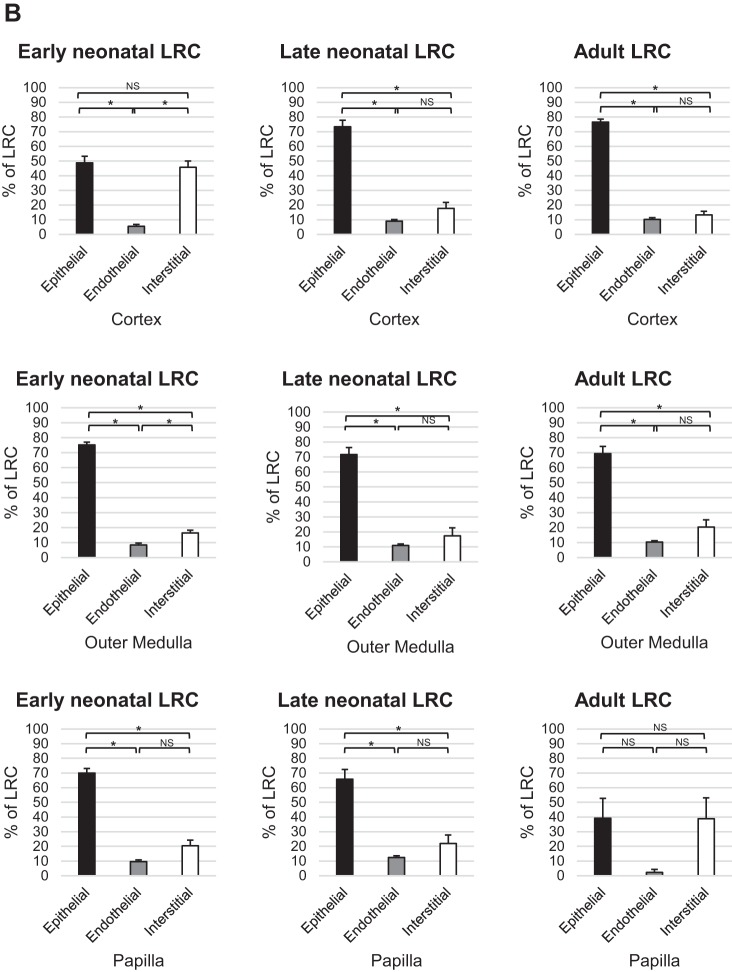
The populations of late neonatal LRC and adult LRCs demonstrated a similar pattern of significant preponderance of cells in the epithelia of the cortex (73.3 ± 4.6 and 76.5 ± 2.0%, respectively) and lower levels in the endothelial (9.0 ± 1.0 and 10.2 ± 1.1, respectively) and interstitial compartments (17.7 ± 4.1 and 13.3 ± 2.3, respectively), which did not significantly differ from each other. Early neonatal LRCs were more evenly distributed in epithelial (48.8 ± 4.5) and interstitial (45.7 ± 4.3) compartments with a significantly lower level in the endothelial compartment (5.5 ± 1.3) in the cortex (Fig. 4). In the outer medulla, LRCs were largely present inside the epithelia (75.2 ± 1.8%, 71.7 ± 4.6%, and 69.3 ± 4.8% for the early neonatal, late neonatal, and adult LRC populations, respectively) with significantly lower levels in the endothelial (8.4 ± 1.3%, 10.9 ± 1.0%, and 10.3 ± 0.9% for the early neonatal, late neonatal, and adult LRC populations, respectively) and interstitial compartments (16.4 ± 1.9%, 17.4 ± 5.3%, and 20.3 ± 4.9% for the early neonatal, late neonatal, and adult LRC populations, respectively; Fig. 4). The endothelial and interstitial levels were not significantly different in the late neonatal and adult LRC. Likewise, early and late neonatal LRC and adult LRC were more commonly distributed in epithelial compartments of the papilla (70.0 ± 3.1%, 65.7 ± 6.7%, and 39.1 ± 13.6%, respectively). Significantly lower levels were seen in the endothelial compartment (9.7 ± 1.2, 12.4 ± 1.2, 2.2 ± 2.2, respectively) and interstitial compartment (20.3 ± 3.9, 21.9 ± 5.9, 38.7 ± 14.3, respectively) of early and late neonatal and adult LRC (Fig. 4), which did not differ from each other.
Fig. 4.
Distribution in epithelial, endothelial, and interstitial compartments of the kidney. A, top panels: representative hpf images of immunostaining experiments; highlighted regions are shown magnified in the bottom panel of images. Deoxyuridine-labeled cells are shown in green, epithelial or endothelial labeling is shown in red as indicated, and nuclei are stained with DAPI (blue) in all images. A–F: representative images of early neonatal (A and D), late neonatal (B and E), and adult (C and F) LRCs with the epithelia marked by antibody to Na-K-ATPase (A–C; cortex) or a cocktail of antibodies (D–F; papilla). G–I (papilla) are representative images of early neonatal (G), late neonatal (H), and adult (I) LRCs with vascular endothelia marked by antibody to MECA-32 (red). In the bottom panel of images, representative positive nuclei within the labeled nephron region for each corresponding labeling paradigm are indicated by thin white arrows (early neonatal LRC), thick white arrows (late neonatal LRC), or white arrowheads (adult LRC). The scale bars in A–I represent 200 μm. B, bottom panels: graphical representation of the percentage distribution of different populations of LRCs in epithelial, endothelial, and interstitial compartments. Statistical significance (P < 0.0001) is indicated by an * in the graphs. Comparisons that were not statistically significant are indicated as NS.
Nephron segment-specific distributions of LRCs differed among the three populations.
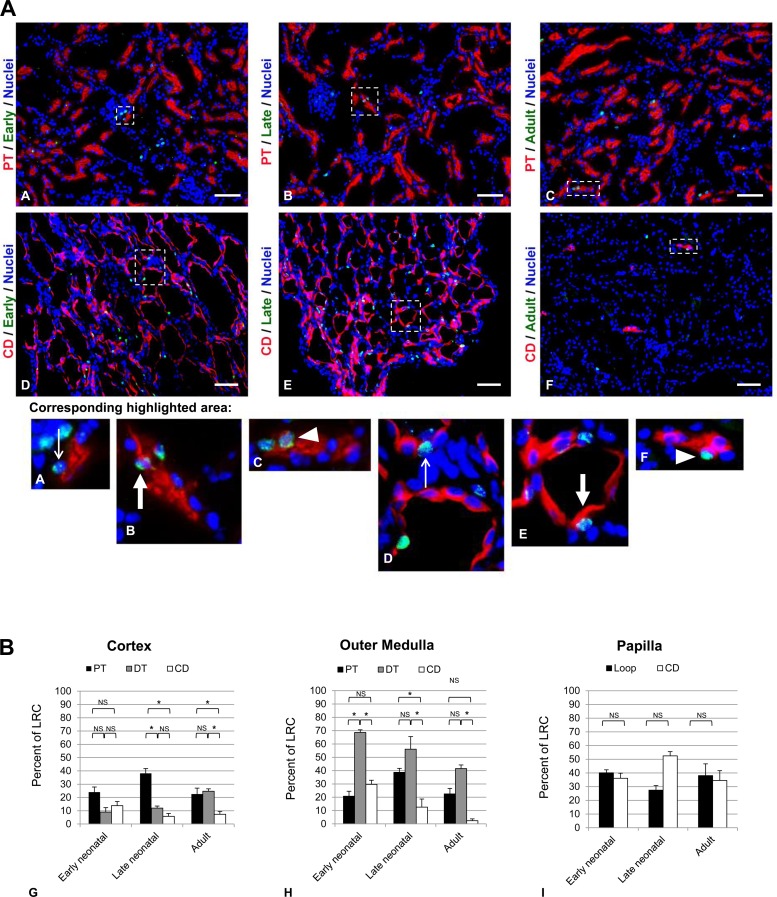
In the cortex, differences in the distribution between PT, distal tubule (DT), and the CD of the early neonatal LRC did not reach significance (Fig. 5). The late neonatal LRCs were found to be significantly higher in PT than in DT or CD (P < 0.0001), which did not differ from each other. Adult LRCs had significantly lower percentage of LRCs in the CD (P < 0.0001), while the PT and DT were not significantly different in distribution. In the outer medulla, the early neonatal LRCs distributed more to the DT than the PT or CD (P < 0.0001), which were not significantly different from each other. The late neonatal in outer medulla showed significantly lower percentage of cells in the CD relative to the PT or DT, but the PT-DT distribution did not differ. For the adult LRC, the only significantly different distribution was seen between the DT and CD; PT did not differ from either other nephron region. In the papilla, no significantly different distributions were found between the Loop of Henle (Loop) or the CD in any LRC population.
Fig. 5.
Distribution of LRCs in epithelial compartments of the nephron. A, top panels: representative images of LRCs colabeled with lotus tetragonolobous lectin (A–C; red; cortex), antibody to aquaporin-2 (D–F; red; papilla) to identify proximal tubule and collecting duct, respectively. Scale bars represent 200 μm. In the bottom panel of images, highlighted regions of the corresponding panels are shown; nuclei within the epithelial compartment that is positive for the deoxyuridine label are indicated by thin white arrows (early neonatal LRC), thick white arrows (late neonatal LRC), or white arrowheads (adult LRC). Dark staining with antibody to Na-K-ATPase (not shown; see Fig. 4) was used to identify the distal tubule. B, bottom panels: graphs in G–I indicate the percentage distribution of each LRC population within nephron regions. Statistical significance (P < 0.0001) is indicated by an * in the graphs. Comparisons that were not statistically significant are indicated as NS.
DISCUSSION
Prior studies of the retention of a DNA label in cells of the kidney have not been consistent (3, 6, 11, 13, 16). The present study therefore employed a unique pair-wise labeling paradigm with the three different thymidine analog loading techniques from these prior studies to demonstrate no substantial overlap among the identified LRCs (termed early neonatal, late neonatal, and adult LRCs), indicating that these cell populations were different. By absolute numbers, late neonatal LRCs greatly outnumbered the other two populations in every region of the kidney. The distribution in the kidney differed among the LRC populations, with the highest levels of early and late neonatal LRCs present in the papilla, while the adult LRCs were most abundant in the cortex and outer medulla showing an anti-parallel distribution (Figs. 3 and 6). All three populations of LRCs were observed in epithelial, endothelial, and interstitial compartments. As well, all three populations of LRCs were observed in the differing nephron regions. In this study in the cortex, comparable percentages of early neonatal and adult LRC populations were identified in the PT and DT, but late neonatal LRC had greater representation in the PT than in the DT. CD contained significantly fewer LRCs of the adult while no difference was seen in the early or late neonatal LRC populations in the cortex. Common among all three LRC populations in the outer medulla, the DT was found to contain a significantly higher percentage of each population of LRCs than in the CD. PT to DT distribution was not significantly different except with the early neonatal LRCs. The epithelial distribution within the papilla was not significantly different. A recent study using a clever cell tracing technique provides evidence of “fate-restricted clones” within all nephron regions and these authors suggested that these cells act as “unipotent progenitors” that give rise to new cells of the tubules of the uninjured and recovering kidney (17). How these LRC populations correspond to the unipotent clones is not clear. Given the distinct nature of these LRC populations, more study is required to understand how label-retention correlates with replicative potential for homeostasis as well as in pathophysiological states.
Fig. 6.
Diagram demonstrating the global antiparallel distribution of individual LRC populations within the kidney. Adult LRCs are present largely in the cortex and outer medulla (OM), while both early neonatal and late neonatal LRC populations were predominantly located in the inner medulla (IM) and papilla (Pap).
The first striking difference between previous studies and this one is the global distribution of these LRCs within the kidney. Humphreys et al. (3) administered thymidine or deoxyuridine in the first 2 postnatal days (early neonatal) and found a predominance of labeled cells in the tip and middle of the papilla with few if any labeled cells throughout the rest of the kidney at 8 wk of age. Our results also indicated highest levels of these early neonatal LRC in the papilla, but ∼12 and 17% of these cells were found in the cortex and outer medulla, respectively. Introduction of deoxyuridine over postnatal days 3 through 6 (late neonatal) by Oliver et al. (16) marked cells with greatest abundance within the papilla in rats at 2 mo of age. The results of our study identified that 60% of these cells were found in papilla with lesser amounts in the cortex (17%) and outer medulla (23%). Finally, Maeshima et al. (11) gave deoxyuridine for 1 wk to rats at 9 wk of age (adult) and found at 12 wk of age that abundant labeled cells were present in the cortex and outer medulla with very few if any in the papilla. The results of this study are in concordance with these prior results. One potential explanation for the higher number of cells labeled as late neonatal compared with the early neonatal is that the duration of time of loading was 4 days instead of 2. It is interesting to consider, however, that the differences in the number of LRCs observed for these populations in the adult may be due to a more robust cell division during “nephrogenesis” by the early neonatal LRCs, which results in the preferential loss of the label retention in these cells. Alternatively, preferential loss of the cells due to the developmental apoptotic wave that occurs is possible (5, 7). These aspects will require further investigation. While these diverse findings in gross localization within the kidney have been considered to possibly be due to differences in the species used or other methodological differences in each of these studies, the present study has shown that these three LRC populations were distinct in the same murine strain.
An additional distinction among the differing LRCs was the compartment- and nephron-specific distributions of these cell populations. Early neonatal LRCs in the cortex were equally distributed between the epithelial and interstitial compartments and within the epithelium, no differences were observed. In the outer medulla and papilla, this population was highest in the epithelium, lower in the interstitial compartment, and lowest in the endothelial compartment. Within the nephron, this LRC population was not found to be significantly different between nephron regions of the outer medulla and papilla with the exception of the higher percentage seen in the outer medullary DT than in the PT or CD. These findings of early neonatal LRCs are in contrast to that of Humphreys et al. (3), who observed that ∼80% of these cells were positive for AQP2 (i.e., CD localization). Differences between the studies including the staining protocol for the deoxyuridine, as well as in the age and gender of the mice and the concentration of deoxyuridine administered as well as the lack of quantitative data analysis in the prior study (3) may explain this discrepancy, but further studies would be needed to confirm the methodological source of the difference.
Late neonatal LRCs were preferentially found in the epithelial compartment, while their presence in the endothelial and interstitial compartments did not differ in any gross region of the kidney. These LRCs were predominantly found in the PT of the cortex, but the PT to DT distribution in the outer medulla was not different. Significantly lower levels of late neonatal LRC were identified in the outer medullary CD. Lower levels of this population in the cortical CD and higher levels in the papillary CD did not reach significance.
Adult LRCs appeared to be more represented in the epithelial compartment in the cortex and outer medulla; however, distinctions between the different nephron regions showed only significantly lower percentage of these cells in the CD than in the DT. In the papilla, no differences were observed between the differing compartments or nephron regions, although these results may reflect the very low numbers of this population found in this region of the kidney. These findings contrast with those of Maeshima et al. (11). In their studies, they identified that most of the adult LRCs were in the PT with only a few in the DT. Different staining protocols were used between the two studies, but the lack of quantitative data in the Maeshima et al. study makes further comparison difficult.
One striking finding was the trend for preferential distribution to the outer medullary DT of all three populations of LRCs. A role for these cells in this nephron region is unknown. The presence in the loop of Henle of all populations of LRCs was also interesting and contrasted with the findings of Oliver et al. (16) (late neonatal LRCs) as they found little evidence of the late neonatal LRCs in the loop of Henle. Likewise, Humphreys et al. (3) suggest that only a small portion of the early neonatal LRCs resides in the loop of Henle. The distribution of the adult LRC to the loop of Henle has not been reported previously. The cells of this region presumably have a similar origination in development as the PT; it is unknown whether these neonatal LRCs are among the cells of the loop of Henle that are preserved during the wave of apoptosis seen in this region of the kidney during the first neonatal week of development (5, 7). Furthermore, whether these cells can give rise to reparative cells in the PT has not been examined fully, although Humphreys et al. identified no changes in the number of early neonatal LRCs in a murine model of ischemia-reperfusion injury (3). Further examination of the dynamics of these cells is warranted to establish whether other models of ischemia-reperfusion injury, or other models of AKI, similarly show no reparative response from the early neonatal LRCs.
It is important to note that prior studies that examined kidney LRCs had “chase” periods that varied (3, 8, 11, 15, 16) and thus, the use of the term “label-retaining” has been somewhat confounded. Shorter times may have resulted in the identification of some cells that, with a longer chase, might lose the label. Furthermore, the postnatal kidney is very quiescent and thus the retention of label may occur simply as a result of the natural induction of quiescence, particularly in the papilla, which is a region that exhibits very little cell proliferation in the untreated adult (1). One further caveat may be the differing cell cycle timing of different cell populations that may lead to greater or lesser representation of these differing populations within the LRCs (2, 9, 12, 14, 20). It is clear, particularly with the early and late neonatal LRCs that were identified after ∼3 mo of a chase period, that these LRCs have not undergone extensive cycling. However, given the current lack of understanding of the cell cycle kinetics of different cell populations in the native kidney, differentiating between a slowly cycling cell and one that previously was cycling but is now quiescent is not possible (17). Further elucidation of the cell cycle kinetics of the kidney relative to the presence and function of LRCs is warranted.
One additional caveat to the findings in this study is due to the small number of mice used to differentiate the individual populations of LRCs. While these results demonstrate very little overlap of the populations, it is possible that a small fraction of dual-labeled LRCs may exist within the kidney. The potential for release of labeled deoxyuridine from dead or dying cells, and the subsequent incorporation of this label in a neighboring cycling cell, cannot be ruled out either. Thus, evaluating whether these relatively few double-labeled cells are truly part of more than one population of LRCs is beyond the scope of this study. Nonetheless, it would appear that the vast majority of the LRCs are part of only one population as defined by the loading paradigms discussed.
In summary, the distinct populations of LRCs identified in this study may reflect diverse functions of these cells in the maintenance of the cellular architecture of the kidney in health and disease. The findings highlight the complexity of kidney cell biology. The unique distributions of each population in differing nephron regions are interesting and may in part reflect the dynamics of the nephron during the first neonatal week in the rodent. This period in development is quite active with many morphological changes occurring, including refinement of the architecture of the nephron by cell death to give rise to the loop of Henle (7). Given these dynamics, it is reasonable to expect that different cells are cycling during different days of this week and/or that different rates of cell death are seen in various cell populations during the remodeling phase of development. Such a hypothesis will require further investigation. Cell cycling is reported to be quite slow in the adult and the lesser absolute numbers of LRCs identified by loading of the deoxyuridine in the adult animal are consistent with this finding. Finally, whether these LRCs are enriched for renal stem cells, as has been suggested (10, 11), is not known and how these populations of cells are modified during injury is not completely understood either. The original reports of these cells in the kidney differed in the determination of their roles in AKI (3, 8, 11, 15, 16). The late neonatal and adult LRCs appeared to respond to the injury with a burst of proliferation, while the early neonatal were not found to proliferate after AKI. Interestingly, studies using the adult LRC loading paradigm have also demonstrated a role for these cells in models of chronic kidney disease (21, 22). These intriguing findings, coupled with the understanding that these studies have examined different populations of cells, necessitate further investigation to understand the precise roles played by each of these populations in the kidney.
GRANTS
This study was supported by a Pilot Grant from the BioMatrix Engineering and Regenerative Medicine Center at UAB and funding from the UAB-UCSD O'Brien Center for Acute Kidney Research at UAB (P30 DK079337) to L. M. Curtis. L. M. Curtis is supported by a Department of Veterans Affairs Career Development Grant (1 K2 BX001581) and P. W. Sanders is supported by grants (1 IP1 BX001595 and 5 IO1 BX001192) from the Office of Research and Development, Medical Research Service, Department of Veterans Affairs. P. W. Sanders is also supported by the National Institutes of Health George M. O'Brien Kidney and Urological Research Centers Program (P30 DK079337).
DISCLOSURES
No conflicts of interest, financial or otherwise, are declared by the author(s).
AUTHOR CONTRIBUTIONS
Author contributions: S.R., B.S., C.F., and P.-X.W. performed experiments; S.R., G.C., and L.M.C. analyzed data; S.R., G.C., P.W.S., and L.M.C. interpreted results of experiments; S.R. and L.M.C. prepared figures; S.R. and L.M.C. drafted manuscript; S.R., B.S., P.W.S., and L.M.C. edited and revised manuscript; S.R., B.S., C.F., P.-X.W., G.C., P.W.S., and L.M.C. approved final version of manuscript; L.M.C. conception and design of research.
ACKNOWLEDGMENTS
The authors thank David Doo for technical assistance in developing the assays.
REFERENCES
- 1.Adams DC, Oxburgh L. The long-term label retaining population of the renal papilla arises through divergent regional growth of the kidney. Am J Physiol Renal Physiol 297: F809–F815, 2009. [DOI] [PMC free article] [PubMed] [Google Scholar]
- 2.Chang M, Parker EA, Muller TJM, Haenen C, Mistry M, Finkielstain GP, Murphy-Ryan M, Barnes KM, Sundaram R, Baron J. Changes in cell-cycle kinetics responsible for limiting somatic growth in mice. Pediatr Res 64: 240–245, 2008. [DOI] [PMC free article] [PubMed] [Google Scholar]
- 3.Humphreys BD, Czerniak S, DiRocco DP, Hasnain W, Cheema R, Bonventre JV. Repair of injured proximal tubule does not involve specialized progenitors. Proc Natl Acad Sci USA 108: 9226–9231, 2011. [DOI] [PMC free article] [PubMed] [Google Scholar]
- 4.Karpowicz P, Morshead C, Kam A, Jervis E, Ramuns J, Cheng V, van der Kooy D. Support for the immortal strand hypothesis: neural stem cells partition DNA asymmetrically in vitro. J Cell Biol 170: 721–732, 2005. [DOI] [PMC free article] [PubMed] [Google Scholar]
- 5.Kim J, Cha JH, Tisher CC, Madsen KM. Role of apoptotic and nonapoptotic cell death in removal of intercalated cells from developing rat kidney. Am J Physiol Renal Fluid Electrolyte Physiol 270: F575–F592, 1996. [DOI] [PubMed] [Google Scholar]
- 6.Kim J, Kim JI, Na YK, Park KM. Intra-renal slow cell-cycle cells contribute to the restoration of kidney tubules injured by ischemia/reperfusion. Anat Cell Biol 44: 186–193, 2011. [DOI] [PMC free article] [PubMed] [Google Scholar]
- 7.Kim J, Lee GS, Tisher CC, Madsen KM. Role of apoptosis in development of the ascending thin limb of the loop of Henle in rat kidney. Am J Physiol Renal Fluid Electrolyte Physiol 271: F831–F845, 1996. [DOI] [PubMed] [Google Scholar]
- 8.Kim K, Lee KM, Han DJ, Yu E, Cho YM. Adult stem cell-like tubular cells reside in the corticomedullary junction of the kidney. Int J Clin Exp Pathol 1: 232–241, 2008. [PMC free article] [PubMed] [Google Scholar]
- 9.Loffing J, Le Hir M, Kaissling B. Modulation of salt transport rate affects DNA synthesis in vivo in rat renal tubules. Kidney Int 47: 1615–1623, 1995. [DOI] [PubMed] [Google Scholar]
- 10.Maeshima A, Sakurai H, Nigam SK. Adult kidney tubular cell population showing phenotypic plasticity, tubulogenic capacity, and integration capability into developing kidney. J Am Soc Nephrol 17: 188–198, 2006. [DOI] [PubMed] [Google Scholar]
- 11.Maeshima A, Yamashita S, Nojima Y. Identification of renal progenitor-like tubular cells that participate in the regeneration processes of the kidney. J Am Soc Nephrol 14: 3138–3146, 2003. [DOI] [PubMed] [Google Scholar]
- 12.Márquez M, Cabrera I, Serrano D, Sterin-Speziale N. Cell proliferation and morphometric changes in the rat kidney during postnatal development. Anat Embryol (Berl) 205: 431–440, 2002. [DOI] [PubMed] [Google Scholar]
- 13.Miya M, Maeshima A, Mishima K, Sakurai N, Ikeuchi H, Kuroiwa T, Hiromura K, Nojima Y. Age-related decline in label-retaining tubular cells: implication for reduced regenerative capacity after injury in the aging kidney. Am J Physiol Renal Physiol 302: F694–F702, 2012. [DOI] [PubMed] [Google Scholar]
- 14.Nadasdy T, Laszik Z, Blick KE, Johnson LD, Silva FG. Proliferative activity of intrinsic cell populations in the normal human kidney. J Am Soc Nephrol 4: 2032–2039, 1994. [DOI] [PubMed] [Google Scholar]
- 15.Oliver JA, Klinakis A, Cheema FH, Friedlander J, Sampogna RV, Martens TP, Liu C, Efstratiadis A, Al-Awqati Q. Proliferation and migration of label-retaining cells of the kidney papilla. J Am Soc Nephrol 20: 2315–2327, 2009. [DOI] [PMC free article] [PubMed] [Google Scholar]
- 16.Oliver JA, Maarouf O, Cheema FH, Martens TP, Al-Awqati Q. The renal papilla is a niche for adult kidney stem cells. J Clin Invest 114: 795–804, 2004. [DOI] [PMC free article] [PubMed] [Google Scholar]
- 17.Rinkevich Y, Montoro Daniel T, Contreras-Trujillo H, Harari-Steinberg O, Newman Aaron M, Tsai Jonathan M, Lim X, Van-Amerongen R, Bowman A, Januszyk M, Pleniceanu O, Nusse R, Longaker Michael T, Weissman Irving L, Dekel B. In vivo clonal analysis reveals lineage-restricted progenitor characteristics in mammalian kidney development, maintenance, and regeneration. Cell Rep 7: 1270–1283, 2014. [DOI] [PMC free article] [PubMed] [Google Scholar]
- 18.Smith GH. Label-retaining epithelial cells in mouse mammary gland divide asymmetrically and retain their template DNA strands. Development 132: 681–687, 2005. [DOI] [PubMed] [Google Scholar]
- 19.Tumbar T, Guasch G, Greco V, Blanpain C, Lowry WE, Rendl M, Fuchs E. Defining the epithelial stem cell niche in skin. Science 303: 359–363, 2004. [DOI] [PMC free article] [PubMed] [Google Scholar]
- 20.Wehrli P, Loffing-Cueni D, Kaissling B, Loffing J. Replication of segment-specific and intercalated cells in the mouse renal collecting system. Histochem Cell Biol 127: 389–398, 2007. [DOI] [PubMed] [Google Scholar]
- 21.Yamashita S, Maeshima A, Nojima Y. Involvement of renal progenitor tubular cells in epithelial-to-mesenchymal transition in fibrotic rat kidneys. J Am Soc Nephrol 16: 2044–2051, 2005. [DOI] [PubMed] [Google Scholar]
- 22.Yoshida Y, Fukuda N, Maeshima A, Yamamoto C, Matsumoto T, Ueno T, Nojima Y, Matsumoto K, Soma M. Treatment with valsartan stimulates endothelial progenitor cells and renal label-retaining cells in hypertensive rats. J Hypertens 29: 91–101, 2011. [DOI] [PubMed] [Google Scholar]


