

Abstract
Cardiovascular disease (CVD) is the leading cause of premature mortality in ADPKD patients. The aim was to identify potential serum biomarkers associated with the severity of ADPKD. Serum samples from a homogenous group of 61 HALT study A ADPKD patients [early disease group with estimated glomerular filtration rate (eGFR) >60 ml·min−1·1.73 m−2] were compared with samples from 49 patients from the HALT study B group with moderately advanced disease (eGFR 25–60 ml·min−1·1.73 m−2). Targeted tandem-mass spectrometry analysis of markers of endothelial dysfunction and oxidative stress was performed and correlated with eGFR and total kidney volume normalized to the body surface area (TKV/BSA). ADPKD patients with eGFR >60 ml·min−1·1.73 m−2 showed higher levels of CVD risk markers asymmetric and symmetric dimethylarginine (ADMA and SDMA), homocysteine, and S-adenosylhomocysteine (SAH) compared with the healthy controls. Upon adjustments for age, sex, systolic blood pressure, and creatinine, SDMA, homocysteine, and SAH remained negatively correlated with eGFR. Resulting cellular methylation power [S-adenosylmethionine (SAM)/SAH ratio] correlated with the reduction of renal function and increase in TKV. Concentrations of prostaglandins (PGs), including oxidative stress marker 8-isoprostane, as well as PGF2α, PGD2, and PGE2, were markedly elevated in patients with ADPKD compared with healthy controls. Upon adjustments for age, sex, systolic blood pressure, and creatinine, increased PGD2 and PGF2α were associated with reduced eGFR, whereas 8-isoprostane and again PGF2α were associated with an increase in TKV/BSA. Endothelial dysfunction and oxidative stress are evident early in ADPKD patients, even in those with preserved kidney function. The identified pathways may provide potential therapeutic targets for slowing down the disease progression.
Keywords: biomarkers, ADPKD, endothelial dysfunction, NO pathway, oxidative stress
autosomal dominant polycystic kidney disease (ADPKD) is the most common hereditary renal disease, affecting ∼1 in 500 individuals (47). It is responsible for 4% of end-stage renal disease (ESRD) in the United States and 8–10% in Europe (47). As of today, treatment options for ADPKD are very limited, and current therapies are aimed at slowing down cyst growth and progression to ESRD. One of the challenges in both trial design and clinical care is the absence of biomarkers that are predictive of severity and disease progression, especially before significant impairment of renal function has occurred.
Cardiovascular disease (CVD) is the leading cause of premature mortality in ADPKD patients. Hypertension occurs early and is related to the activation of the renin-angiotensin-aldosterone system (RAAS), including its major components angiotensinogen, renin, and angiotensin II, vascular inflammation and chemotaxis, endothelial dysfunction, oxidative stress, and nitric oxide (NO) deficiency (6, 8, 27, 47, 57–61).
Because of the importance of hypertension in ADPKD and uncertainties surrounding its treatment, the National Institutes of Health/National Institute of Diabetes and Digestive and Kidney Diseases funded two distinct multicenter double-blind randomized clinical trials, adequately powered to assess the effect of RAAS blockade on renal progression at early (study A) and late (study B) stages of the disease (Halt Progression of Polycystic Kidney Disease; HALT-PKD).
Endothelial dysfunction has been shown to predate hypertension and chronic renal insufficiency in ADPKD and therefore appears to be a primary defect (58). However, as hypertension progresses, endothelial dysfunction increases (58). These defects even in ADPKD patients with preserved glomerular filtration rates (GFR) have been linked to markedly decreased constitutive NO synthase (NOS) activity in subcutaneous resistance vessels (57, 58). Furthermore, an abnormal sensory cilia function reported in PKD patients (1, 2) disrupts NO biosynthesis, in which primary cilia act as mechanical switches to initiate a NO biochemical reaction (2, 40). Therefore, it is not surprising that, within several population studies, plasma levels of the endogenous competitive NOS inhibitor asymmetric dimethylarginine (ADMA) (31, 54) were found increased in selected ADPKD patients with preserved GFR (52, 59, 60).
Based on 144 patients from the HALT-PKD trial, Heffernan et al. (16) showed that patients with ADPKD have elevated plasma concentrations of vascular inflammatory markers (TNF-α-dependent sFas, ICAM, P-selectin, and E-selectin) compared with healthy controls. These findings are in agreement with other published results (11, 18, 36). Interestingly, normotensive patients with ADPKD and preserved renal function had a heightened vascular inflammatory state as evidenced by higher levels of ICAM, P-selectin, E-selectin, and sFas compared with healthy controls (16). Additionally, ADPKD patients with renal dysfunction had a trend toward higher vascular inflammation than ADPKD patients with preserved renal function.
Based on this knowledge, we aimed at identifying markers that are associated with the increase in total kidney volume and/or a worsening of kidney function in ADPKD patients. For identification of said biomarkers, we utilized established liquid chromatography- tandem mass spectrometry (LC-MS/MS) panels such as for the quantification of prostaglandins and intermediates of the NO pathway. Serum samples from a homogenous group of 61 HALT-ADPKD study A patients, which as aforementioned were considered an early disease group with eGFR >60 ml·min−1·1.73 m−2 were compared with those from 49 HALT study B patients with moderately advanced disease as defined by a GFR of 25–60 ml·min−1·1.73 m−2. All samples were drawn at the “baseline” collection time point.
METHODS
Study Population
The ongoing HALT-PKD ClinicalTrials.gov identifier NCT00283686 trial consists of two concurrent randomized clinical trials designed to evaluate the effects of RAAS suppression on the progression of ADPKD (9). Study A recruited patients with an eGFR of >60 ml·min−1·1.73 m−2, and study B recruited patients with an eGFR of 25–60 ml·min−1·1.73 m−2. Age limits were 15–49 yr for study A and 18–64 yr for study B. Major exclusion criteria for both studies included renal vascular disease, diabetes, and history of severe heart failure.
Here, we utilized baseline samples from 61 study A and 49 study B subjects collected at the University of Colorado, Anschutz Medical Campus site of the HALT-PKD trial. In ADPKD patients, GFR was estimated using the four-variable MDRD equation (30). A trained nurse assessed blood pressure (BP) using an automated oscillometric monitor (GE Healthcare, Waukesha, WI) following standard guidelines. Measurements were made in patients in a seated position after 5–10 min of quiet rest. In addition, ADPKD patients from the study A group underwent measurements of TKV. The HALT protocol at the University of Colorado, Anschutz Medical Campus site was approved by the Colorado Multi-Institutional Review Board (COMIRB; University of Colorado Denver). Patients gave their written informed consent. The study was conducted in full compliance with the ICH Harmonized Tripartite Guidelines for Good Clinical Practice (1996), the Declaration of Helsinki (version 11, October 2000), and all other applicable regulatory guidances. The patients underwent a 2-wk medication washout (as part of the HALT-PKD study design) before assessment of hemodynamic, vascular, and inflammation parameters. During this time, BP was controlled in hypertensive patients with labetalol or clonidine. All patients withheld antihypertensive medications for a minimum of 12 h before testing. Subjects were instructed to fast overnight and refrain from caffeine and alcohol intake as well as smoking on the day of testing.
Serum samples from 18 healthy subjects were collected onsite (10 male, median age: 37 yr; and 8 female subjects, median age: 30 yr). The subjects were not on BP control medication and had no history of kidney or heart disease. The use of serum samples collected from healthy volunteers for biomarker assay calibration and quality control samples was COMIRB exempt.
In addition to the difference of patients based on their eGFR (HALT study A: eGFR >60 ml·min−1·1.73 m−2 and HALT study B subjects: eGFR 25–60 ml·min−1·1.73 m−2), we also divided serum samples collected from HALT study A subjects into three groups: 15 (24.5%) with TKV of <800 ml, 28 (46.0%) with 800–1,500 ml, and 18 (29.5%) with TKV >1,500 ml. These kidney volume cut-offs were based on the recommendations of the Consortium of Radiological Imaging Studies of Polycystic Kidney Disease (CRISP) (14).
Measurement of Biomarkers
Endothelial dysfunction markers.
Endothelial dysfunction markers, including arginine (Arg), ADMA, and symmetric dimethylarginine (SDMA), cysteine (Cys), glutathione, homocysteine (Hcy), methionine (Met), S-adenosylhomocysteine (SAH), and S-adenosylmethionine (SAM), were quantified using a validated HPLC-MS/MS assay (for more detail, see Ref. 26). In brief, to 100 μl serum 50 μl of internal standard containing solution (50 μM d7-ADMA, d4-cystine, d8-homocystine, d3-methionine and S-methylglutathione, all in HPLC water), and 40 μl of 500 mM DTT solution were added. For protein precipitation, 400 μl of 0.05% trifluoric acid plus 0.1% formic acid containing acetonitrile solution were added to the sample. The sample was vortexed for 5 min, centrifuged for 10 min at 13,000 g, and transferred into a HPLC vial.
Twenty microliters of the supernatant were injected onto a 4.6 × 12.5-mm guard column (Eclipse XDB-C8, 5 μm, Agilent Technologies, Palo Alto, CA) inline with a 3.0 × 150-mm analytical column (RP-Amide, 3.5 μm, Supelco, St. Louis, MO). The gradient started at 3% methanol and 97% 10 mM ammonium formate buffer, and a flow of 0.8 ml/min was maintained throughout the assay. At minute 4.5, the solvent gradient reached 25% methanol. Thereafter, the methanol content was raised to 98% and held for an additional 1.5 min. Then, the columns were reequilibrated to the starting conditions for the remaining 2 min of the assay. The API5000 mass spectrometer (AB Sciex, Concord, ON) was run in the positive electrospray ionization mode (ESI) using multiple reaction monitoring (MRM). The following ion transitions (m/z, mass/charge) were used: Arg: 175.2 → 70.1; ADMA: 203.2 → 46.2; SDMA: 203.2 → 172.2; d7-ADMA (internal standard): 210.2 → 77.2; cysteine: 122.0 → 75.9; d2-cysteine (internal standard): 124.0 → 77.9; Hcy: 136.1 → 90.1; d4-Hcy (internal standard): 140.1 → 94.1; Met: 150.1 → 104.0; d3-Met (internal standard): 153.1 → 107.0; glutathione: 308.0 → 179.0; S-methylglutathione: 322.0 → 176.0; SAM: 399.0 → 250.1; d3-SAM (internal standard): 402.0 → 136.2; SAH: 385.0 → 136.2; and d5-SAH (internal standard): 391.0 → 137.2. During the prestudy assay validation, intraday accuracies and precisions were within the predefined acceptance criteria of ±15%. Furthermore, the following lower limits of quantitation (LLOQ) were established: Arg: 7.5 μM, ADMA and SDMA: 0.3 μM, cysteine: 20 μM, HCy: 4 μM, Met: 6.3 μM, and glutathione: 2.5 μM.
Prostaglandins.
Protaglandins were extracted from 400 μl plasma following protein precipitation with 400 μl methanol/0.2 M ZnSO4 (70/30 vol/vol) as previously described (25). Automated inline extraction was used for sample analysis. Five hundred microliters of the extracted sample were injected onto a 4.6 × 12.5-mm Zorbax XDB-C8 guard/extraction column (Agilent Technologies). The flow rate during the injection was 500 μl/min and was increased to 3,000 μl/min within 1 min. The composition of solvents was 80% 0.1% formic acid and 20% methanol. After sample cleanup for 1 min, the switching valve was activated and the analytes were back-flushed onto the Phenomenex Synergi Hydro-RP 80Å, 3.0 × 250-mm, 4-μm column (Phenomenex, Torrance, CA). We used methanol and 0.1% formic acid as mobile phases, and the flow rate was set to 0.6 ml/min. The following gradient was run: 0–1 min 63% methanol; 1.1–10 min 63%-98%. The analytic column was kept at 98% methanol for 1 min and then reequilibrated to the starting conditions. The HPLC system was interfaced with an API5000 tandem mass spectrometer via a Turbo V ion source (AB Sciex) operated in the negative ESI mode. The following ion transitions (MRM mode) were monitored for the study compounds: m/z 353 → 193 for 8-isoprostane and PGF2α and m/z 351 → 189 for PGD2 and PGE2. Corresponding deuterated internal standards (Cayman Chemical, Ann Arbor, MI) were used for each of the analytes. Intraday accuracies (±15%) and precisions (≤15%) met the predefined acceptance criteria. The LLOQ was 20 pg/ml for all prostaglandins.
Statistical Analyses
Descriptive statistics were calculated for each of the study groups (healthy controls, ADPKD eGFR >60 ml·min−1·1.73 m−2 and ADPKD eGFR 25–60 ml·min−1·1.73 m−2), including percentages for categorical data, means ± SD for continuous variables. All of the biomarkers were ln-transformed for analyses since the distributions were skewed. Linear regression was used to evaluate the relationship of each biomarker with eGFR and TKV normalized to the BSA across study A and B samples. Each marker was analyzed using three distinct models: 1) unadjusted, 2) adjusted for age and sex, and 3) adjusted for age, sex, systolic BP, and (ln-transformed) serum creatinine. An additional model was used to evaluate the relationship of biomarkers with TKV normalized to BSA, namely 4) adjusted for age, sex, systolic BP, and (ln-transformed) eGFR. To compare differences in biomarker levels between ADPKD patient study groups, t-tests were used. For comparison between healthy subjects and both ADPKD patient study groups, one-way ANOVA with Tukey's post hoc testing was used. SPSS (version 21.0, Chicago, IL) and SAS 9.3 (Cary, NC) were used for the analyses. An adjusted P value <0.05 was considered significant for the comparison of groups.
RESULTS
Baseline Characteristics of the Study Groups
The patients were eligible to participate in study A or study B based on their eGFR (9, 53). The patient characteristics are summarized in Table 1.
Table 1.
Baseline characteristics of the study groups based on their eGFR
| eGFR >60 ml·min−1·1.73 m−2 HALT-A | eGFR 25–60 ml·min−1·1.73 m−2 HALT-B | |
|---|---|---|
| Age, yr | 37.0 ± 7.8 | 47.1 ± 8.0† |
| Male, % | 60.7 | 50.0 |
| Systolic BP, mmHg | 127.5 ± 13.0 | 132.0 ± 12.8 |
| Diastolic BP, mmHg | 74.5 ± 13.2 | 78.0 ± 9.6 |
| eGFR, ml·min−1·1.73 m−2 | 82.4 ± 17.7 | 48.2 ± 8.4† |
| Urine creatinine, mg/ml | 0.7 ± 0.4 | 0.6 ± 0.3* |
| Serum creatinine, mg/dl | 1.0 ± 0.2 | 1.5 ± 0.3† |
| Urine microalbumin, mg/day | 41.1 ± 93.0 | 53.1 ± 69.3 (n = 36) |
| BSA, m2 | 2.0 ± 0.3 | 2.0 ± 0.2 |
| LV mass, g | 127.2 ± 29.7 | ND |
| LVMI, g/m2 | 64.0 ± 13.5 | ND |
| TKV, ml | 1,365 ± 702 | ND |
| TKV/BSA, ml/m2 | 674 ± 333 | ND |
Values are means ± SD.
eGFR, estimated glomerular filtration rate; HALT, Halt Progression of Polycystic Kidney Disease study (HALT-A, early disease group; HALT-B, moderately advanced disease group); BP, blood pressure; BSA, body surface area; LV, left ventricular; TKV, total kidney volume; ND, not determined.
Samples from 18 healthy subjects were utilized for the study (10 males and 8 females; age 33.7 ± 9.2 yr, P < 0.001 vs. HALT-B). Significance levels:
P < 0.05,
P < 0.001 for HALT-A (eGFR >60 ml·min−1·1.73 m−2) vs. HALT-B (eGFR 25-60 ml·min−1·1.73 m−2 patients.
As aforementioned, patients with eGFR >60 ml·min−1·1.73 m−2 were further classified into the following subgroups based on their TKV: 15 (24.5%) with TKV of <800 ml, 28 (46.0%) with 800–1,500 ml, and 18 (29.5%) with TKV >1,500 ml (Table 1).
Linear Regression Analysis of Serum Biomarkers with eGFR and TKV Normalized to BSA
In this cross-sectional study, correlations between the evaluated markers and TKV and eGFR were performed and those that were identified as significantly different are presented below. In unadjusted analyses of the ADPKD eGFR >60 and eGFR 25–60 ml·min−1·1.73 m−2 patient groups, linear regression of eGFR on serum markers of endothelial dysfunction and oxidative stress yielded statistically significant associations with ADMA, Arg, Cys, glutathione, HCy, Met, SAH, the SAM/SAH ratio, SDMA, PGD2, PGE2, PGF2α, and 8-isoprostane (Table 2). Adjustments for age, sex, systolic BP, and ln-transformed serum creatinine reduced the number of significant correlations between eGFR to the following markers: Arg, Hcy, Met, SAH, the SAM/SAH ratio, SDMA, PGD2, and PGF2α (Table 2).
Table 2.
Regression analysis of eGFR and serum markers of endothelial dysfunction and oxidative stress/inflammation
| Variable | Model | Estimate ± SE | P Value |
|---|---|---|---|
| ADMA | Unadjusted | −0.36 ± 0.15 | 0.0226 |
| Model 1 | −0.24 ± 0.13 | 0.0678 | |
| Model 2 | −0.23 ± 0.13 | 0.0744 | |
| Arginine | Unadjusted | −0.20 ± 0.09 | 0.0381 |
| Model 1 | −0.21 ± 0.08 | 0.0069 | |
| Model 2 | −0.21 ± 0.08 | 0.0081 | |
| Cysteine | Unadjusted | −0.29 ± 0.11 | 0.0104 |
| Model 1 | −0.13 ± 0.10 | 0.1867 | |
| Model 2 | −0.13 ± 0.10 | 0.1977 | |
| Glutathione | Unadjusted | −0.10 ± 0.03 | 0.0021 |
| Model 1 | −0.05 ± 0.03 | 0.0585 | |
| Model 2 | −0.05 ± 0.03 | 0.0512 | |
| Homocysteine | Unadjusted | −0.60 ± 0.09 | <0.0001 |
| Model 1 | −0.41 ± 0.08 | <0.0001 | |
| Model 2 | −0.42 ± 0.08 | <0.0001 | |
| Methionine | Unadjusted | −0.43 ± 0.04 | <0.0001 |
| Model 1 | −0.34 ± 0.04 | <0.0001 | |
| Model 2 | −0.34 ± 0.04 | <0.0001 | |
| PGD2 | Unadjusted | −0.16 ± 0.02 | <0.0001 |
| Model 1 | −0.11 ± 0.02 | <0.0001 | |
| Model 2 | −0.11 ± 0.02 | <0.0001 | |
| PGE2 | Unadjusted | −0.10 ± 0.04 | 0.0284 |
| Model 1 | −0.04 ± 0.04 | 0.2618 | |
| Model 2 | −0.04 ± 0.04 | 0.2628 | |
| PGF2α | Unadjusted | −0.14 ± 0.03 | <0.0001 |
| Model 1 | −0.08 ± 0.03 | 0.0019 | |
| Model 2 | −0.08 ± 0.03 | 0.0019 | |
| 8-Isoprostane | Unadjusted | −0.10 ± 0.04 | 0.0064 |
| Model 1 | −0.06 ± 0.03 | 0.0744 | |
| Model 2 | −0.06 ± 0.03 | 0.0743 | |
| SAH | Unadjusted | −0.42 ± 0.03 | <0.0001 |
| Model 1 | −0.36 ± 0.03 | <0.0001 | |
| Model 2 | −0.36 ± 0.03 | <0.0001 | |
| SAM | Unadjusted | −0.06 ± 0.08 | 0.4634 |
| Model 1 | −0.11 ± 0.06 | 0.0815 | |
| Model 2 | −0.11 ± 0.06 | 0.0848 | |
| SAM/SAH ratio |
Unadjusted | 0.19 ± 0.02 | <0.0001 |
| Model 1 | 0.15 ± 0.02 | <0.0001 | |
| Model 2 | 0.15 ± 0.02 | <0.0001 | |
| SDMA | Unadjusted | −0.22 ± 0.09 | 0.0134 |
| Model 1 | −0.15 ± 0.07 | 0.0418 | |
| Model 2 | −0.15 ± 0.07 | 0.0497 |
Values are estimate ± SE. See text for definitions. Three models were run for each marker: 1) unadjusted; 2) model 1, adjusted for age and sex; and 3) model 2, adjusted for age, sex, systolic BP, and ln-transformed serum creatinine. P value <0.05 was considered significant and is marked in bold. The variables were ln transformed before analysis.
Linear regression of TKV normalized to the BSA showed significant associations with the following serum markers: ADMA, Cys, Hcy, PGE2, PGF2α, SDMA, and 8-isoprostane when unadjusted regression analysis was used (Table 3). Adjustment for age, sex, systolic BP, and ln-transformed serum creatinine reduced the number of significant markers to PGF2α, 8-isoprostane, SDMA, and the SAM/SAH ratio (Table 3). The same markers remained significant when adjustments for age, sex, systolic BP, and ln-transformed eGFR were made, with an inclusion of ADMA.
Table 3.
Regression of TKV normalized to BSA on serum markers of endothelial dysfunction and oxidative stress/inflammation
| Variable | Model | Estimate ± SE | P Value |
|---|---|---|---|
| ADMA | Unadjusted | 435.27 ± 188.86 | 0.0247 |
| Model 1 | 450.36 ± 192.95 | 0.0231 | |
| Model 2 | 402.56 ± 216.08 | 0.0679 | |
| Model 3 | 395.41 ± 196.38 | 0.0490 | |
| Arginine | Unadjusted | 116.03 ± 140.84 | 0.4134 |
| Model 1 | 120.79 ± 142.55 | 0.4004 | |
| Model 2 | 72.69 ± 149.20 | 0.6281 | |
| Model 3 | 47.79 ± 147.38 | 0.7470 | |
| Cysteine | Unadjusted | 264.37 ± 125.79 | 0.0399 |
| Model 1 | 258.47 ± 134.75 | 0.0601 | |
| Model 2 | 253.75 ± 138.00 | 0.0714 | |
| Model 3 | 247.73 ± 134.13 | 0.0701 | |
| Glutathione | Unadjusted | −25.23 ± 37.05 | 0.4985 |
| Model 1 | −28.69 ± 37.66 | 0.4493 | |
| Model 2 | −25.65 ± 38.65 | 0.5097 | |
| Model 3 | −18.73 ± 37.94 | 0.6235 | |
| Homocysteine | Unadjusted | 264.37 ± 125.79 | 0.0399 |
| Model 1 | 258.47 ± 134.75 | 0.0601 | |
| Model 2 | 253.75 ± 138.00 | 0.0714 | |
| Model 3 | 247.73 ± 134.13 | 0.0701 | |
| Methionine | Unadjusted | 81.30 ± 128.50 | 0.5294 |
| Model 1 | 90.17 ± 130.65 | 0.4929 | |
| Model 2 | 113.19 ± 131.75 | 0.3941 | |
| Model 3 | 113.16 ± 130.68 | 0.3903 | |
| PGD2 | Unadjusted | 76.71 ± 69.42 | 0.2743 |
| Model 1 | 76.05 ± 69.96 | 0.2823 | |
| Model 2 | 69.57 ± 72.85 | 0.3446 | |
| Model 3 | 70.90 ± 71.09 | 0.3237 | |
| PGE2 | Unadjusted | 167.31 ± 79.49 | 0.0403 |
| Model 1 | 179.80 ± 80.00 | 0.0291 | |
| Model 2 | 157.56 ± 83.70 | 0.0661 | |
| Model 3 | 158.65 ± 82.83 | 0.0615 | |
| PGF2α | Unadjusted | 215.49 ± 67.27 | 0.0023 |
| Model 1 | 230.82 ± 66.69 | 0.0011 | |
| Model 2 | 218.22 ± 72.96 | 0.0045 | |
| Model 3 | 222.40 ± 73.03 | 0.0038 | |
| 8-Isoprostane | Unadjusted | 197.94 ± 65.84 | 0.0041 |
| Model 1 | 213.53 ± 65.41 | 0.0020 | |
| Model 2 | 201.05 ± 70.67 | 0.0066 | |
| Model 3 | 200.57 ± 69.99 | 0.0062 | |
| SAH | Unadjusted | 242.65 ± 203.38 | 0.2377 |
| Model 1 | 223.81 ± 204.90 | 0.2794 | |
| Model 2 | 162.72 ± 209.17 | 0.4401 | |
| Model 3 | 142.82 ± 206.38 | 0.4919 | |
| SAM | Unadjusted | −145.54 ± 134.07 | 0.2824 |
| Model 1 | −146.79 ± 134.45 | 0.2799 | |
| Model 2 | −228.93 ± 139.94 | 0.1081 | |
| Model 3 | −238.90 ± 137.92 | 0.0893 | |
| SAM/SAH ratio | Unadjusted | −214.94 ± 120.27 | 0.0794 |
| Model 1 | −213.20 ± 120.52 | 0.0827 | |
| Model 2 | −250.84 ± 120.01 | 0.0417 | |
| Model 3 | −253.75 ± 118.73 | 0.0374 | |
| SDMA | Unadjusted | 285.98 ± 102.69 | 0.0072 |
| Model 1 | 277.88 ± 104.14 | 0.0099 | |
| Model 2 | 235.48 ± 115.98 | 0.0473 | |
| Model 3 | 236.54 ± 113.84 | 0.0424 |
Values are estimate ± SE. Four models were run for each marker: 1) unadjusted; 2) model 1, adjusted for age and sex; 3) model 2, adjusted for age, sex, systolic BP, and ln-transformed serum creatinine; and 4) model 3, adjusted for age, sex, systolic BP, and ln-transformed eGFR. P value <0.05 was considered significant and is marked in bold. The variables were ln-transformed before analysis.
Statistical Comparison of Serum Markers that Significantly Correlated with eGFR and/or TKV Between the Study Groups
Endothelial dysfunction.
Serum concentration of ADMA was significantly increased in ADPKD patients with preserved eGFR and TKV >1,500 ml compared with those with TKV <800 ml (Fig. 1A). Its structural isomer SDMA followed the same trend, showing an even more pronounced increase between the two groups (Fig. 1A). Compared with the 0.52 ± 0.19 μM measured in healthy subjects, ADMA concentrations in ADPKD patients with early structural disease (and TKV <800 ml) was slightly increased at 0.81 ± 0.14 μM. This difference was even more pronounced in the case of SDMA, where levels measured in ADPKD patients with early disease ranged between 1.86 ± 0.89 μM as opposed to 0.42 ± 0.20 μM measured in the healthy subjects (Fig. 1B). In patients with eGFR >60 ml·min−1·1.73 m−2, ADMA and SDMA serum levels were slightly more elevated compared with healthy subjects at 0.92 ± 0.16 and 1.97 ± 0.62 μM, respectively (Fig. 1B). However, no significant difference between the patients with eGFR higher or lower than 60 ml·min−1·1.73 m−2 was observed (Table 4, Fig. 1B).
Fig. 1.
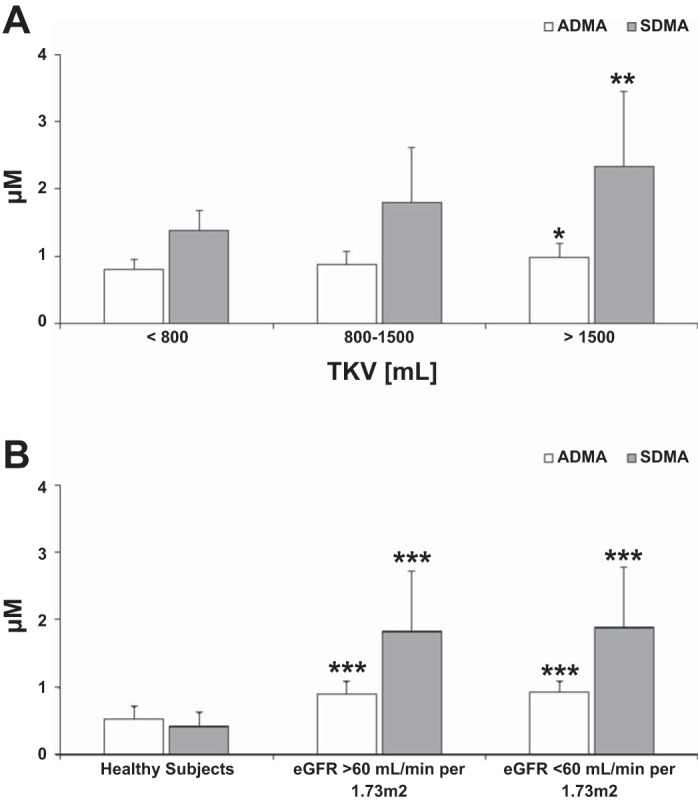
Differences in asymmetric dimethylarginine (ADMA) and symmetric dimethylarginine (SDMA) concentrations in serum of adult autosomal dominant polycystic kidney disease (ADPKD) patients with higher total kidney volume (TKV) but preserved estimated glomerular filtration rate (eGFR) >60 ml·min−1·1.73 m−2 (A) and comparison between healthy subjects and ADPKD patients with preserved and moderately reduced eGFR (B). Values are means ± SD. Significance levels: *P < 0.05, **P < 0.01, ***P < 0.001 vs. TKV < 800 ml (A) and vs. healthy subjects (B). For significance levels between the ADPKD patients with preserved and moderately reduced eGFR, please refer to Table 4.
Table 4.
Comparison of serum biomarker concentrations in HALT-A (eGFR >60 ml·min−1·1.73 m−2, n = 61) and HALT-B (eGFR 25-60 ml·min−1·1.73 m−2, n = 49) patients
| Variable | HALT-A (eGFR >60 ml·min−1·1.73 m−2) | HALT-B (eGFR <60 ml·min−1·1.73 m−2) | P Value |
|---|---|---|---|
| NO pathway and endothelial dysfunction markers | |||
| ADMA, μM | 0.89 ± 0.19 | 0.92 ± 0.16 | 0.3821 |
| Arginine, μM | 81.9 ± 27.6 | 94.7 ± 35.0 | 0.0323 |
| Cysteine μM | 200.7 ± 64.5 | 209.8 ± 34.3 | 0.3708 |
| Homocysteine, μM | 12.7 ± 4.1 | 16.4 ± 2.0 | <0.0001 |
| Methionine, μM | 21.6 ± 7.1 | 48.7 ± 16.5 | <0.0001 |
| SAH, nM | 182.6 ± 39.1 | 604.9 ± 90.5 | <0.0001 |
| SAM, nM | 382.0 ± 122.4 | 367.0 ± 135.4 | 0.5487 |
| SAM/SAH | 2.18 ± 0.77 | 0.20 ± 0.07 | <0.0001 |
| SDMA, μM | 1.86 ± 0.89 | 1.97 ± 0.62 | 0.4534 |
| Oxidative stress and inflammation markers | |||
| Glutathione, μM | 4.17 ± 3.09 | 5.28 ± 2.08 | 0.0317 |
| PGD2, pg/ml | 663.2 ± 501.7 | 4,510.4 ± 3,482.6 | <0.0001 |
| PGE2, pg/ml | 675.9 ± 377.1 | 1,242.4 ± 1,095.8 | 0.0006 |
| PGF2α, pg/ml | 160.9 ± 94.6 | 530.0 ± 424.4 | <0.0001 |
| 8-Isoprostane, pg/ml | 90.8 ± 55.6 | 185.7 ± 203.2 | 0.0015 |
Data are presented as mean ± SD. P value <0.05 was considered significant and is marked in bold.
ADPKD patients with TKV >1,500 ml had significantly higher serum Hcy (14.5 ± 3.73 vs. 11.4 ± 3.2 μM, P < 0.05) and SAH levels (195.6 ± 48.0 vs. 166.1 ± 26.5 nM, P < 0.05) compared with the patients with TKV <800 ml (Fig. 2A). These early ADPKD patients with TKV <800 ml had Hcy serum concentrations similar to those found in healthy adult subjects (8.3 ± 4.6 μM), but their SAH levels were already elevated (166.1 ± 26.5 vs. 42.8 ± 11.4 nM in healthy adults; Fig. 2B). This accumulation of SAH did not seem to result from a change in concentrations of the upstream metabolites of the methylation cycle, Met and SAM, as these were not different from the healthy subjects and showed no significant correlation with TKV in HALT study A patients. However, with the decreasing eGFR, Met accumulated while SAM levels remained unchanged (Table 4, Fig. 2B), with significantly lower methylation potential (SAM/SAH ratios) in patients with eGFR >60 ml·min−1·1.73 m−2 (Table 4).
Fig. 2.
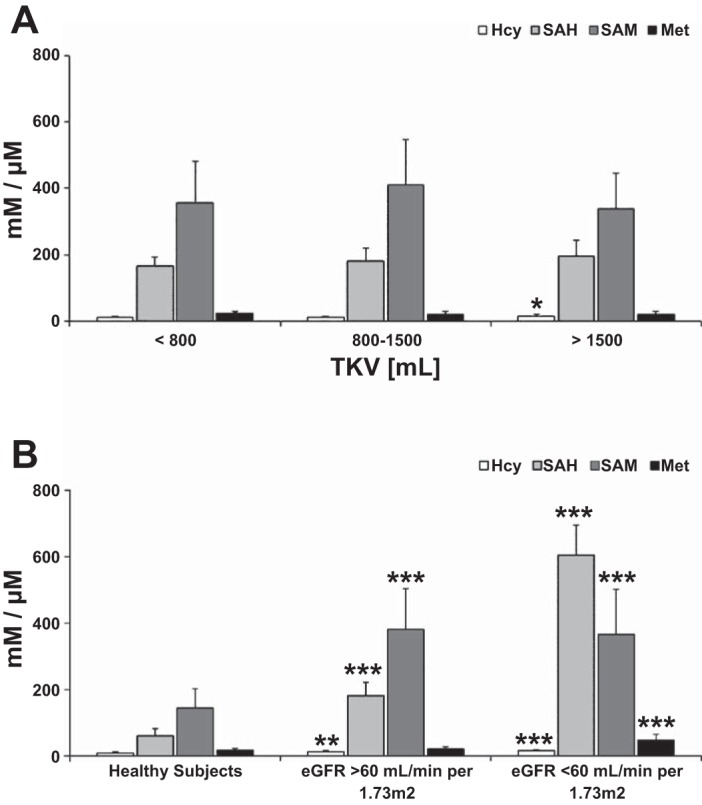
Changes in methylation cycle intermediates and cardiovascular disease (CVD) risk markers homocysteine (Hcy) and S-adenosylhomocysteine (SAH) in serum of ADPKD adults with increasing TKV but preserved eGFR >60 ml·min−1·1.73 m−2 (A) and comparison between healthy subjects and ADPKD patients with preserved and moderately reduced eGFR (B). Values are means ± SD. Significance levels: *P < 0.05, **P < 0.01, ***P < 0.001 vs. TKV < 800 ml (A) and vs. healthy subjects (B). S-adenosylmethionine (SAM) and SAH are presented in nM, Hcy and methionine (Met) in μM. For significance levels between the ADPKD patients with preserved and moderately reduced eGFR, please refer to Table 4.
Oxidative stress.
Stable markers of oxidative stress, PGF2α and 8-isoprostane, were significantly increased in ADPKD patients with preserved eGFR compared with healthy individuals (Fig. 3B). The degree of oxidative stress appeared to increase with the increase of TKV and the reduction of renal function (Fig. 3A), as both markers negatively correlated with eGFR (no significance for 8-isoprostane when adjusted for sex, age, systolic BP, and ln-transformed serum creatinine) and positively with TKV/BSA (Tables 2–4). An inverse correlation with eGFR was also noted for proinflammatory PGD2 and PGE2 (E2 only when not adjusted) (Fig. 3B).
Fig. 3.
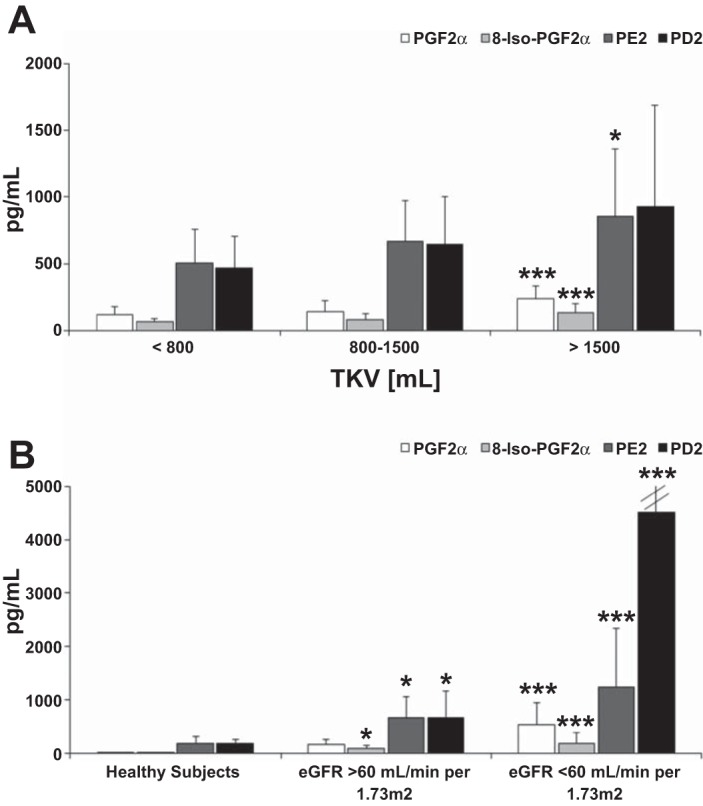
Changes in concentrations of prostaglandins in serum of adult ADPKD patients with increasing TKV but preserved eGFR >60 ml·min−1·1.73 m−2 (A) and comparison between healthy subjects and ADPKD patients with preserved and moderately reduced eGFR (B). Values are means ± SD. To facilitate visual comparison, error bars are not completely shown. The mean ± SD for PGD2 was 4,510 ± 3,483 pg/ml. Significance levels: *P < 0.05, ***P < 0.001 vs. TKV < 800 ml (A) and vs. healthy subjects (B). For significance levels between ADPKD patients with preserved and moderately reduced eGFR, please refer to Table 4.
DISCUSSION AND CONCLUSION
In this study, we aimed to identify markers associated with disease severity in ADPKD patients, as indicated by a decline in eGFR or increase in TKV. We have identified a set of markers (Table 5, Fig. 4) that are statistically correlated with the severity of ADPKD and merit further investigation and validation in prospective studies to monitor disease progression. The underlying changes in signaling pathways that occur in ADPKD patients and correlate with the disease progression could be beneficial as potential and early targets for new therapies (Fig. 4).
Table 5.
Summary of identified marker changes
| Marker | Directional Change in ADPKD | Signaling Pathway | Association With |
|---|---|---|---|
| ADMA | Increase | Nitric oxide cycle | eGFR (unadjusted), TKV/BSA (model 1) |
| SDMA | Increase | Nitric oxide cycle | eGFR (model 2), TKV/BSA (model 2) |
| Homocysteine | Increase | Methylation cycle | eGFR (model 2), TKV/BSA (unadjusted) |
| Methionine | Increase | Methylation cycle | eGFR (model 2) |
| SAH | Increase | Methylation cycle | eGFR (model 2) |
| SAM | Decrease | Methylation cycle | |
| SAM/SAH ratio | Decrease | Methylation cycle | eGFR (model 2), TKV/BSA (model 2) |
| PGD2 | Increase | Cyclooxygenases | eGFR (model 2) |
| PGE2 | Increase | Cyclooxygenases | eGFR (unadjusted), TKV/BSA (model 1) |
| PGF2α | Increase | Cyclooxygenases | eGFR (model 2), TKV/BSA (model 2) |
| 8-Isoprostane | Increase | Cyclooxygenases | eGFR (unadjusted), TKV/BSA (model 2) |
Presented is a proposed combinatorial biomarker that merits further clinical development and validation for the monitoring and possibly also prediction of autosomal dominant polycystic kidney disease (ADPKD)-related disease processes and their severity.
Fig. 4.
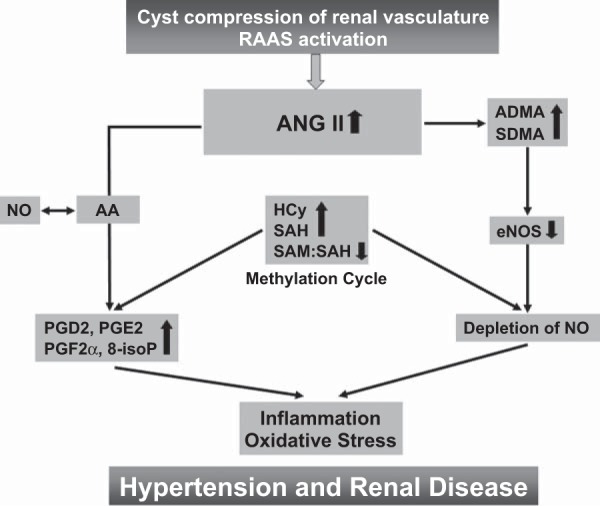
Proposed mechanistic hypothesis based on the published data and the results of the present study in patients with ADPKD. A vicious cycle is created, in which renal cysts activate the renin-angiotensin-aldosterone system (RAAS). The resulting increase in ANG II leads to 1) increased levels of endothelial nitric oxide synthase (NOS) inhibitor ADMA and SDMA that deplete nitric oxide (NO); 2) increased Hcy and SAH levels within the methylation pathway and lower SAM/SAH ratio, indicating diminished methylation capacity; and 3) increased metabolism of arachidonic acid (AA), leading to generation of proinflammatory and oxidative stress, accelerating prostaglandins. Oxidative stress, vascular inflammation, and endothelial dysfunction in turn augment the cyst compression of renal vasculature and activate RAAS.
Increased ADMA plasma concentrations have been reported in a wide range of cardiovascular disorders, with ADMA being particularly high in patients with CKD (12, 62). An increase in ADMA plasma levels in ADPKD patients with normal creatinine clearance has been reported previously (23, 59, 60). Furthermore, in a recent interventional study, ADPKD patients showed significantly higher serum ADMA and lower serum NO levels compared with hypertensive patients without ADPKD, suggesting an abnormality in regulating NO biosynthesis (21). This increase is probably associated with the observation that ADPKD patients showed abnormal sensory cilia, substantially decreased NO response and biosynthesis, as well as reduced constitutive NOS activity in subcutaneous resistance vessels dissected from biopsy specimens (1, 2, 57, 58).
ADMA was significantly associated with TKV/BSA and eGFR in an unadjusted linear regression model, and when further adjusted for age, sex, systolic BP, and ln eGFR, but not for ln serum creatinine.
Our study confirmed these findings while showing that not only ADMA but also SDMA levels were elevated in the serum of ADPKD patients with early disease. Interestingly, while ADMA is a known endogenous competitive NOS inhibitor, an established cardiovascular risk marker (31), and is mainly metabolized by dimethylarginine dimethylaminohydrolases (DDAH) (4), the biological role of SDMA is still not completely understood; however, it is believed that it does not directly affect NOS activity (56). Despite this, meta-analysis of multiple studies in patients with renal diseases showed a strong correlation between SDMA and renal function (24, 33), suggesting that SDMA may indeed be a potential marker of renal function (24).
The observed increase in oxidative stress in patients with larger total kidney volumes, as indicated by higher 8-isoprostane and PGF2α serum levels, is known to inactivate DDAHs by oxidation of a reactive cysteine residue in the active sites (29). Oxidative stress may therefore contribute to the increased plasma ADMA levels in patients by decreasing its metabolism through DDAH.
Hyperhomocysteinemia is commonly known as a risk factor for cardiovascular and thrombotic diseases (7, 10). Elevated HCy and SAH levels were validated as an independent risk factor for development and progression of vascular diseases in patients with renal dysfunction (44, 50). However, little is known about the status of the methylation cycle and its association with levels of other cardiovascular biomarkers in ADPKD patients. Also, the metabolic link between elevated HCy and the increased incidence of vascular disease is still unclear. Various hypotheses exist, including 1) elevated Hcy, causing increased production of reactive oxygen species; 2) reversal of the activity of the enzyme SAH, resulting in increased SAH (22); and 3) a direct effect of HCy on vascular endothelial cells (55). In our study, ADPKD patients with preserved eGFR showed elevated plasma Hcy and SAH levels. Both cardiovascular risk markers were statistically significantly associated with eGFR, and as GFR decreased, other changes in the methylation cycle became evident. This included the accumulation of methionine and decreasing concentrations of SAM, suggesting decreased activity of methionine adenosyltransferase, faster conversion of SAM to SAH, and/or reduced activity of methionine synthase that itself is inhibited by NO (3).
Due to increased levels of SAH, ADPKD patients showed low methylation potential (SAM/SAH), that, after adjustments for age, sex, systolic BP, and serum creatinine, was still statistically significantly associated with eGFR and TKV/BSA. A low methylation capacity has been observed previously in patients with chronic renal failure (43), and the resulting DNA hypomethylation may be responsible for increased cardiovascular risk and mortality (28).
Oxidative stress also seems to contribute to the progression of and poor outcomes in CKD and ADPKD (17, 35). In animal models of ADPKD, decreased protein levels and enzyme activity of antioxidant enzymes glutathione peroxidase and superoxide dismutase (SOD) and accumulation of lipid peroxidation byproducts in the plasma and kidneys of these animals were reported (34). A recent study in 144 HALT study patients revealed elevated plasma 8-isoprostane and reduced levels of SOD in subjects with ADPKD (35). Altered levels of these oxidative stress markers were apparent in early ADPKD subjects and did not appear to change with worsening kidney function or hypertension (35). In our study, we confirmed markedly increased serum concentrations of the stable oxidative stress markers 8-isoprostane and PGF2α (15, 25, 37, 46) in ADPKD patients with preserved eGFR compared with healthy individuals. Both markers were positively associated with TKV/BSA, PGF2α also with eGFR.
With respect to the role prostaglandins play in oxidative stress, both the levels and the profile of prostaglandin production have been shown to change dramatically during an inflammatory response (48). Prostaglandin production is generally very low in noninflamed tissues, but increases immediately in the case of acute inflammation before the recruitment of leukocytes and the infiltration of immune cells.
Both inactivation of polycystins in intact cilia, and cilia disruption, can lead to the formation of kidney cysts (32). Previous studies have shown that PGF2α is an effective activator of the ERK1/2 pathway in ciliary cells, and this activation is also required for PGF2α to induce excretion of matrix metalloproteinases MMP-1 and MMP-2 (19). Increased serum levels of MMP-1 and MMP-9 were reported in ADPKD patients (39), while ADPKD human kidneys demonstrated a consistent pattern of increased MMP expression in the epithelia of small cysts (42).
Administration of PGF2α leads to acute inflammation in vitro and in vivo (49), and elevated biosynthesis of PGF2α has been reported in patients with reduced renal function (5) and myocardial dysfunction (51). In the present study, increased serum PGF2α was statistically significantly associated with eGFR and TKV/BSA, suggesting an increase in inflammatory processes during the growth of cystic kidneys.
PGD2 and PGE2 were also elevated in the serum of ADPKD patients. PGD2 was significantly associated with eGFR (after adjustments for age, sex, systolic BP, and ln-transformed serum creatinine), while PGE2 was rather associated with TKV/BSA (still significant after adjustment for age and sex). In addition to its role as a proinflammatory mediator (45), PGD2 inhibits expression of proinflammatory genes, such as iNOS and plasminogen activator inhibitor (38, 41), thus accelerating atherogenesis. Furthermore, PGE2 in cooperation with VEGF, may play a critical role in the development of inflammatory granulation and angiogenesis, thus eventually contributing to tissue remodeling (20). Taken together, our data showed that inflammatory markers are elevated in ADPKD patients. This supports the hypothesis generated from animal models that inflammation is an upstream event in the pathogenesis of ADPKD and may contribute to its progression (13).
In this study, we used a comprehensive strategy based on a portfolio of targeted, quantitative LC-MS/MS multianalyte assays to profile endothelial dysfunction, including the NO pathway, the methylation pathway, and oxidative stress markers. This unique approach resulted in the identification of novel markers and signaling pathways involved in ADPKD.
In summary, we showed that markers of endothelial dysfunction and oxidative stress are evident early in ADPKD. The degree of injury parallels the state of the disease (either the increase in TKV/BSA or reduction of renal function). Our study was designed as an exploratory biomarker discovery study. It is likely that our results are subject to residual confounders for which adjustments were not made in this study. It will now be important to further qualify the markers identified in this study in prospective and longitudinal studies (including the ongoing HALT trial), as well as to establish the specificity of the markers by comparison with, e.g., CKD patients. In addition to providing proof-of-concept, the results of the present study will be critical for the design of such studies, including providing the basis for statistical power analyses.
Limitations
We performed linear regressions without adjustments for multiple comparisons, leading to potential type I statistical error. Small sample size for the three subject groups leaves a risk for type II error.
In regard to the eGFR, with the sample size of 110, the multiple linear regression test of R2 = 0 (α = 0.050) for 3 normally distributed covariates, i.e., age, sex, and systolic BP, will have 80% power to detect an R2 of 0.0933. All samples collected at the University of Colorado Denver site of the HALT-PKD clinical trial were utilized for the study, without any preselection process. It would have further strengthened the study to also have had TKV measurements for the HALT-B patients. However, such measurements were not included in the HALT-B protocol.
GRANTS
This study has been funded by National Institutes of Health (NIH) Grant U01DK062402 and the University of Colorado iC42 Clinical Research and Development Service Center. The study was also supported in part by NIH/NCRR Colorado CTSI Grant UL1 RR025780.
DISCLOSURES
No conflicts of interest, financial or otherwise, are declared by the authors.
AUTHOR CONTRIBUTIONS
Author contributions: Jelena Klawitter, B.Y.R.-G., G.B., M.B.C., U.C., and R.W.S. provided conception and design of research; Jelena Klawitter, A.T.P., and J.K. performed experiments; Jelena Klawitter, K.M., A.T.P., Jost Klawitter, and J.K. analyzed data; Jelena Klawitter, B.Y.R.-G., K.M., K.Z.A., M.A.C., G.B., M.B.C., and R.W.S. interpreted results of experiments; Jelena Klawitter prepared figures; Jelena Klawitter, K.M., and U.C. drafted manuscript; Jelena Klawitter, B.Y.R.-G., K.M., A.T.P., Jost Klawitter, K.Z.A., M.A.C., G.B., M.B.C., U.C., and R.W.S. edited and revised manuscript; Jelena Klawitter, B.Y.R.-G., K.M., A.T.P., Jost Klawitter, K.Z.A., J.K., M.A.C., G.B., M.B.C., U.C., and R.W.S. approved final version of manuscript.
REFERENCES
- 1.AbouAlaiwi WA, Ratnam S, Booth RL, Shah JV, Nauli SM. Endothelial cells from humans and mice with polycystic kidney disease are characterized by polyploidy and chromosome segregation defects through survivin down-regulation. Hum Mol Genet 20: 354–367, 2011. [DOI] [PMC free article] [PubMed] [Google Scholar]
- 2.AbouAlaiwi WA, Takahashi M, Mell BR, Jones TJ, Ratnam S, Kolb RJ, Nauli SM. Ciliary polycystin-2 is a mechanosensitive calcium channel involved in nitric oxide signaling cascades. Circ Res 104: 860–869, 2009. [DOI] [PMC free article] [PubMed] [Google Scholar]
- 3.Banerjee RV, Matthews RG. Cobalamin-dependent methionine synthase. FASEB J 4: 1450–1459, 1990. [DOI] [PubMed] [Google Scholar]
- 4.Beltowski J, Kedra A. Asymmetric dimethylarginine (ADMA) as a target for pharmacotherapy. Pharmacol Rep 58: 159–178, 2006. [PubMed] [Google Scholar]
- 5.Breyer MD, Breyer RM. G protein-coupled prostanoid receptors and the kidney. Annu Rev Physiol 63: 579–605, 2001. [DOI] [PubMed] [Google Scholar]
- 6.Brunner HR. Experimental and clinical evidence that angiotensin II is an independent risk factor for cardiovascular disease. Am J Cardiol 87: 3C-9C, 2001. [DOI] [PubMed] [Google Scholar]
- 7.Cacciapuoti F. Hyper-homocysteinemia: a novel risk factor or a powerful marker for cardiovascular diseases? Pathogenetic and therapeutical uncertainties. J Thromb Thrombolysis 32: 82–88, 2011. [DOI] [PubMed] [Google Scholar]
- 8.Chapman AB, Johnson A, Gabow PA, Schrier RW. The renin-angiotensin-aldosterone system and autosomal dominant polycystic kidney disease. N Engl J Med 323: 1091–1096, 1990. [DOI] [PubMed] [Google Scholar]
- 9.Chapman AB, Torres VE, Perrone RD, Steinman TI, Bae KT, Miller JP, Miskulin DC, Rahbari Oskoui F, Masoumi A, Hogan MC, Winklhofer FT, Braun W, Thompson PA, Meyers CM, Kelleher C, Schrier RW. The HALT polycystic kidney disease trials: design and implementation. Clin J Am Soc Nephrol 5: 102–109, 2010. [DOI] [PMC free article] [PubMed] [Google Scholar]
- 10.Clarke R, Daly L, Robinson K, Naughten E, Cahalane S, Fowler B, Graham I. Hyperhomocysteinemia: an independent risk factor for vascular disease. N Engl J Med 324: 1149–1155, 1991. [DOI] [PubMed] [Google Scholar]
- 11.Clausen P, Feldt-Rasmussen B, Iversen J, Lange M, Eidemak I, Strandgaard S. Flow-associated dilatory capacity of the brachial artery is intact in early autosomal dominant polycystic kidney disease. Am J Nephrol 26: 335–339, 2006. [DOI] [PubMed] [Google Scholar]
- 12.Fliser D, Kronenberg F, Kielstein JT, Morath C, Bode-Boger SM, Haller H, Ritz E. Asymmetric dimethylarginine and progression of chronic kidney disease: the mild to moderate kidney disease study. J Am Soc Nephrol 16: 2456–2461, 2005. [DOI] [PubMed] [Google Scholar]
- 13.Grantham JJ. Mechanisms of progression in autosomal dominant polycystic kidney disease. Kidney Int Suppl 63: S93–S97, 1997. [PubMed] [Google Scholar]
- 14.Grantham JJ, Torres VE, Chapman AB, Guay-Woodford LM, Bae KT, King BF, Jr, Wetzel LH, Baumgarten DA, Kenney PJ, Harris PC, Klahr S, Bennett WM, Hirschman GN, Meyers CM, Zhang X, Zhu F, Miller JP, CRISP Investigators. Volume progression in polycystic kidney disease. N Engl J Med 354: 2122–2130, 2006. [DOI] [PubMed] [Google Scholar]
- 15.Haschke M, Zhang YL, Kahle C, Klawitter J, Korecka M, Shaw LM, Christians U. HPLC-atmospheric pressure chemical ionization MS/MS for quantification of 15-F2t-isoprostane in human urine and plasma. Clin Chem 53: 489–497, 2007. [DOI] [PubMed] [Google Scholar]
- 16.Heffernan KS, Kuvin JT, Sarnak MJ, Perrone RD, Miskulin DC, Rudym D, Chandra P, Karas RH, Menon V. Peripheral augmentation index and vascular inflammation in autosomal dominant polycystic kidney disease. Nephrol Dial Transplant 26: 2515–2521, 2011. [DOI] [PMC free article] [PubMed] [Google Scholar]
- 17.Himmelfarb J, Stenvinkel P, Ikizler TA, Hakim RM. The elephant in uremia: oxidant stress as a unifying concept of cardiovascular disease in uremia. Kidney Int 62: 1524–1538, 2002. [DOI] [PubMed] [Google Scholar]
- 18.Hogas SM, Voroneanu L, Serban DN, Segall L, Hogas MM, Serban IL, Covic A. Methods and potential biomarkers for the evaluation of endothelial dysfunction in chronic kidney disease: a critical approach. J Am Soc Hypertens 4: 116–127, 2010. [DOI] [PubMed] [Google Scholar]
- 19.Husain S, Crosson CE. Role of PKCepsilon in PGF2alpha-stimulated MMP-2 secretion from human ciliary muscle cells. J Ocul Pharmacol Ther 24: 268–277, 2008. [DOI] [PMC free article] [PubMed] [Google Scholar]
- 20.Kamei D, Yamakawa K, Takegoshi Y, Mikami-Nakanishi M, Nakatani Y, Oh-Ishi S, Yasui H, Azuma Y, Hirasawa N, Ohuchi K, Kawaguchi H, Ishikawa Y, Ishii T, Uematsu S, Akira S, Murakami M, Kudo I. Reduced pain hypersensitivity and inflammation in mice lacking microsomal prostaglandin E synthase-1. J Biol Chem 279: 33684–33695, 2004. [DOI] [PubMed] [Google Scholar]
- 21.Kathem SH, Mohieldin AM, Abdul-Majeed S, Ismail SH, Altaei QH, Alshimmari IK, Alsaidi MM, Khammas H, Nauli AM, Joe B, Nauli SM. Ciliotherapy: a novel intervention in polycystic kidney disease. J Geriatr Cardiol 11: 63–73, 2014. [DOI] [PMC free article] [PubMed] [Google Scholar]
- 22.Kerins DM, Koury MJ, Capdevila A, Rana S, Wagner C. Plasma S-adenosylhomocysteine is a more sensitive indicator of cardiovascular disease than plasma homocysteine. Am J Clin Nutr 74: 723–729, 2001. [DOI] [PubMed] [Google Scholar]
- 23.Kielstein JT, Boger RH, Bode-Boger SM, Frolich JC, Haller H, Ritz E, Fliser D. Marked increase of asymmetric dimethylarginine in patients with incipient primary chronic renal disease. J Am Soc Nephrol 13: 170–176, 2002. [DOI] [PubMed] [Google Scholar]
- 24.Kielstein JT, Salpeter SR, Bode-Boeger SM, Cooke JP, Fliser D. Symmetric dimethylarginine (SDMA) as endogenous marker of renal function—a meta-analysis. Nephrol Dial Transplant 21: 2446–2451, 2006. [DOI] [PubMed] [Google Scholar]
- 25.Klawitter J, Haschke M, Shokati T, Christians U. Quantification of 15-F2t-isoprostane in human plasma and urine: results from enzyme-linked immunoassay and liquid chromatography/tandem mass spectrometry cannot be compared. Rapid Commun Mass Spectrom 25: 463–468, 2011. [DOI] [PubMed] [Google Scholar]
- 26.Klepacki J, Brunner N, Schmitz V, Klawitter J, Christians U, Klawitter J. Development and validation of an LC-MS/MS assay for the quantification of the trans-methylation pathway intermediates S-adenosylmethionine and S-adenosylhomocysteine in human plasma. Clin Chim Acta 421: 91–97, 2013. [DOI] [PMC free article] [PubMed] [Google Scholar]
- 27.Laursen JB, Rajagopalan S, Galis Z, Tarpey M, Freeman BA, Harrison DG. Role of superoxide in angiotensin II-induced but not catecholamine-induced hypertension. Circulation 95: 588–593, 1997. [DOI] [PubMed] [Google Scholar]
- 28.Lee ME, Wang H. Homocysteine and hypomethylation. A novel link to vascular disease. Trends Cardiovasc Med 9: 49–54, 1999. [DOI] [PubMed] [Google Scholar]
- 29.Leiper J, Murray-Rust J, McDonald N, Vallance P. S-nitrosylation of dimethylarginine dimethylaminohydrolase regulates enzyme activity: further interactions between nitric oxide synthase and dimethylarginine dimethylaminohydrolase. Proc Natl Acad Sci USA 99: 13527–13532, 2002. [DOI] [PMC free article] [PubMed] [Google Scholar]
- 30.Levey AS, Bosch JP, Lewis JB, Greene T, Rogers N, Roth D. A more accurate method to estimate glomerular filtration rate from serum creatinine: a new prediction equation. Modification of Diet in Renal Disease Study Group. Ann Intern Med 130: 461–470, 1999. [DOI] [PubMed] [Google Scholar]
- 31.Lu TM, Chung MY, Lin CC, Hsu CP, Lin SJ. Asymmetric dimethylarginine and clinical outcomes in chronic kidney disease. Clin J Am Soc Nephrol 6: 1566–1572, 2011. [DOI] [PubMed] [Google Scholar]
- 32.Ma M, Tian X, Igarashi P, Pazour GJ, Somlo S. Loss of cilia suppresses cyst growth in genetic models of autosomal dominant polycystic kidney disease. Nat Genet 45: 1004–1012, 2013. [DOI] [PMC free article] [PubMed] [Google Scholar]
- 33.Marcovecchio ML, Dalton RN, Turner C, Prevost AT, Widmer B, Amin R, Dunger DB. Symmetric dimethylarginine, an endogenous marker of glomerular filtration rate, and the risk for microalbuminuria in young people with type 1 diabetes. Arch Dis Child 95: 119–124, 2009. [DOI] [PubMed] [Google Scholar]
- 34.Maser RL, Vassmer D, Magenheimer BS, Calvet JP. Oxidant stress and reduced antioxidant enzyme protection in polycystic kidney disease. J Am Soc Nephrol 13: 991–999, 2002. [DOI] [PubMed] [Google Scholar]
- 35.Menon V, Rudym D, Chandra P, Miskulin D, Perrone R, Sarnak M. Inflammation, oxidative stress, and insulin resistance in polycystic kidney disease. Clin J Am Soc Nephrol 6: 7–13, 2010. [DOI] [PMC free article] [PubMed] [Google Scholar]
- 36.Merta M, Tesar V, Zima T, Jirsa M, Rysava R, Zabka J. Cytokine profile in autosomal dominant polycystic kidney disease. Biochem Mol Biol Int 41: 619–624, 1997. [DOI] [PubMed] [Google Scholar]
- 37.Morrow JD. The isoprostanes—unique products of arachidonate peroxidation: their role as mediators of oxidant stress. Curr Pharm Des 12: 895–902, 2006. [DOI] [PubMed] [Google Scholar]
- 38.Nagoshi H, Uehara Y, Kanai F, Maeda S, Ogura T, Goto A, Toyo-oka T, Esumi H, Shimizu T, Omata M. Prostaglandin D2 inhibits inducible nitric oxide synthase expression in rat vascular smooth muscle cells. Circ Res 82: 204–209, 1998. [DOI] [PubMed] [Google Scholar]
- 39.Nakamura T, Ushiyama C, Suzuki S, Ebihara I, Shimada N, Koide H. Elevation of serum levels of metalloproteinase-1, tissue inhibitor of metalloproteinase-1 and type IV collagen, and plasma levels of metalloproteinase-9 in polycystic kidney disease. Am J Nephrol 20: 32–36, 2000. [DOI] [PubMed] [Google Scholar]
- 40.Nauli SM, Kawanabe Y, Kaminski JJ, Pearce WJ, Ingber DE, Zhou J. Endothelial cilia are fluid shear sensors that regulate calcium signaling and nitric oxide production through polycystin-1. Circulation 117: 1161–1171, 2008. [DOI] [PMC free article] [PubMed] [Google Scholar]
- 41.Negoro H, Soo Shin W, Hakamada-Taguchi R, Eguchi N, Urade Y, Goto A, Toyo-Oka T, Fujita T, Omata M, Uehara Y. Endogenous prostaglandin D2 synthesis reduces an increase in plasminogen activator inhibitor-1 following interleukin stimulation in bovine endothelial cells. J Hypertens 20: 1347–1354, 2002. [DOI] [PubMed] [Google Scholar]
- 42.Norman J. Fibrosis and progression of autosomal dominant polycystic kidney disease (ADPKD). Biochim Biophys Acta 1812: 1327–1336, 2011. [DOI] [PMC free article] [PubMed] [Google Scholar]
- 43.Perna AF, Ingrosso D, Galletti P, Zappia V, De Santo NG. Membrane protein damage and methylation reactions in chronic renal failure. Kidney Int 50: 358–366, 1996. [DOI] [PubMed] [Google Scholar]
- 44.Petramala L, Acca M, Francucci CM, D'Erasmo E. Hyperhomocysteinemia: a biochemical link between bone and cardiovascular system diseases? J Endocrinol Invest 32: 10–14, 2009. [PubMed] [Google Scholar]
- 45.Ricciotti E, FitzGerald GA. Prostaglandins and inflammation. Arterioscler Thromb Vasc Biol 31: 986–1000, 2011. [DOI] [PMC free article] [PubMed] [Google Scholar]
- 46.Roberts LJ, 2nd, Morrow JD. Isoprostanes. Novel markers of endogenous lipid peroxidation and potential mediators of oxidant injury. Ann NY Acad Sci 744: 237–242, 1994. [DOI] [PubMed] [Google Scholar]
- 47.Schrier RW. Renal volume, renin-angiotensin-aldosterone system, hypertension, and left ventricular hypertrophy in patients with autosomal dominant polycystic kidney disease. J Am Soc Nephrol 20: 1888–1893, 2009. [DOI] [PubMed] [Google Scholar]
- 48.Serhan CN, Chiang N, Van Dyke TE. Resolving inflammation: dual anti-inflammatory and pro-resolution lipid mediators. Nat Rev Immunol 8: 349–361, 2008. [DOI] [PMC free article] [PubMed] [Google Scholar]
- 49.Sugimoto Y, Yamasaki A, Segi E, Tsuboi K, Aze Y, Nishimura T, Oida H, Yoshida N, Tanaka T, Katsuyama M, Hasumoto K, Murata T, Hirata M, Ushikubi F, Negishi M, Ichikawa A, Narumiya S. Failure of parturition in mice lacking the prostaglandin F receptor. Science 277: 681–683, 1997. [DOI] [PubMed] [Google Scholar]
- 50.Suliman ME, Lindholm B, Barany P, Bergstrom J. Hyperhomocysteinemia in chronic renal failure patients: relation to nutritional status and cardiovascular disease. Clin Chem Lab Med 39: 734–738, 2001. [DOI] [PubMed] [Google Scholar]
- 51.Takayama K, Yuhki K, Ono K, Fujino T, Hara A, Yamada T, Kuriyama S, Karibe H, Okada Y, Takahata O, Taniguchi T, Iijima T, Iwasaki H, Narumiya S, Ushikubi F. Thromboxane A2 and prostaglandin F2alpha mediate inflammatory tachycardia. Nat Med 11: 562–566, 2005. [DOI] [PubMed] [Google Scholar]
- 52.Torremans A, Marescau B, Kranzlin B, Gretz N, Billiouw JM, Vanholder R, De Smet R, Bouwman K, Brouns R, De Deyn PP. Biochemical validation of a rat model for polycystic kidney disease: comparison of guanidino compound profile with the human condition. Kidney Int 69: 2003–2012, 2006. [DOI] [PubMed] [Google Scholar]
- 53.Torres VE, Chapman AB, Perrone RD, Bae KT, Abebe KZ, Bost JE, Miskulin DC, Steinman TI, Braun WE, Winklhofer FT, Hogan MC, Oskoui FR, Kelleher C, Masoumi A, Glockner J, Halin NJ, Martin DR, Remer E, Patel N, Pedrosa I, Wetzel LH, Thompson PA, Miller JP, Meyers CM, Schrier RW HALT. PKD Study Group. Analysis of baseline parameters in the HALT polycystic kidney disease trials. Kidney Int 81: 577–585, 2012. [DOI] [PMC free article] [PubMed] [Google Scholar]
- 54.Tripepi G, Mattace Raso F, Sijbrands E, Seck MS, Maas R, Boger R, Witteman J, Rapisarda F, Malatino L, Mallamaci F, Zoccali C. Inflammation and asymmetric dimethylarginine for predicting death and cardiovascular events in ESRD patients. Clin J Am Soc Nephrol 6: 1714–1721, 2011. [DOI] [PubMed] [Google Scholar]
- 55.Tsai JC, Perrella MA, Yoshizumi M, Hsieh CM, Haber E, Schlegel R, Lee ME. Promotion of vascular smooth muscle cell growth by homocysteine: a link to atherosclerosis. Proc Natl Acad Sci USA 91: 6369–6373, 1994. [DOI] [PMC free article] [PubMed] [Google Scholar]
- 56.Vallance P, Leone A, Calver A, Collier J, Moncada S. Accumulation of an endogenous inhibitor of nitric oxide synthesis in chronic renal failure. Lancet 339: 572–575, 1992. [DOI] [PubMed] [Google Scholar]
- 57.Wang D, Iversen J, Strandgaard S. Endothelium-dependent relaxation of small resistance vessels is impaired in patients with autosomal dominant polycystic kidney disease. J Am Soc Nephrol 11: 1371–1376, 2000. [DOI] [PubMed] [Google Scholar]
- 58.Wang D, Iversen J, Wilcox CS, Strandgaard S. Endothelial dysfunction and reduced nitric oxide in resistance arteries in autosomal-dominant polycystic kidney disease. Kidney Int 64: 1381–1388, 2003. [DOI] [PubMed] [Google Scholar]
- 59.Wang D, Strandgaard S, Borresen ML, Luo Z, Connors SG, Yan Q, Wilcox CS. Asymmetric dimethylarginine and lipid peroxidation products in early autosomal dominant polycystic kidney disease. Am J Kidney Dis 51: 184–191, 2008. [DOI] [PubMed] [Google Scholar]
- 60.Wang D, Strandgaard S, Iversen J, Wilcox CS. Asymmetric dimethylarginine, oxidative stress, and vascular nitric oxide synthase in essential hypertension. Am J Physiol Regul Integr Comp Physiol 296: R195–R200, 2009. [DOI] [PMC free article] [PubMed] [Google Scholar]
- 61.Watanabe T, Barker TA, Berk BC. Angiotensin II and the endothelium: diverse signals and effects. Hypertension 45: 163–169, 2005. [DOI] [PubMed] [Google Scholar]
- 62.Yilmaz MI, Sonmez A, Saglam M, Qureshi AR, Carrero JJ, Caglar K, Eyileten T, Cakir E, Oguz Y, Vural A, Yenicesu M, Lindholm B, Stenvinkel P, Axelsson J. ADMA levels correlate with proteinuria, secondary amyloidosis, and endothelial dysfunction. J Am Soc Nephrol 19: 388–395, 2008. [DOI] [PMC free article] [PubMed] [Google Scholar]