Abstract
Obstructive sleep apnea causes intermittent hypoxia (IH) during sleep and is associated with dysregulation of glucose metabolism. We developed a novel model of clinically realistic IH in mice to test the hypothesis that IH causes hyperglycemia, glucose intolerance, and insulin resistance via activation of the sympathetic nervous system. Mice were exposed to acute hypoxia of graded severity (21, 14, 10, and 7% O2) or to IH of graded frequency [oxygen desaturation index (ODI) of 0, 15, 30, or 60, SpO2 nadir 80%] for 30 min to measure levels of glucose fatty acids, glycerol, insulin, and lactate. Glucose tolerance tests and insulin tolerance tests were then performed under each hypoxia condition. Next, we examined these outcomes in mice that were administered phentolamine (α-adrenergic blockade) or propranolol (β-adrenergic blockade) or that underwent adrenal medullectomy before IH exposure. In all experiments, mice were maintained in a thermoneutral environment. Sustained and IH induced hyperglycemia, glucose intolerance, and insulin resistance in a dose-dependent fashion. Only severe hypoxia (7% O2) increased lactate, and only frequent IH (ODI 60) increased plasma fatty acids. Phentolamine or adrenal medullectomy both prevented IH-induced hyperglycemia and glucose intolerance. IH inhibited glucose-stimulated insulin secretion, and phentolamine prevented the inhibition. Propranolol had no effect on glucose metabolism but abolished IH-induced lipolysis. IH-induced insulin resistance was not affected by any intervention. Acutely hypoxia causes hyperglycemia, glucose intolerance, and insulin resistance in a dose-dependent manner. During IH, circulating catecholamines act upon α-adrenoreceptors to cause hyperglycemia and glucose intolerance.
Keywords: thermoneutral, sympathetic
obstructive sleep apnea (OSA) is a common condition that causes upper airway collapse during sleep. There is emerging evidence that OSA may be linked to the development of diabetes mellitus. For example, OSA is associated with diabetes in cross-sectional studies (64), and OSA increases risks of developing diabetes in longitudinal studies (12, 16, 53). Furthermore, core features of diabetes, such as insulin resistance (29, 32, 76) and hyperglycemia (4, 17, 18, 59), are improved by treatment of OSA with continuous positive airway pressure (57). Mechanisms by which OSA might induce metabolic impairment are poorly understood. Repetitive airway collapse causes many stressful consequences such as sleep fragmentation, intermittent hypoxia (IH), and hypercapnia, which increase sympathetic nervous system (SNS) activity. In turn, catecholamines oppose the regulatory actions of insulin by causing skeletal muscle insulin resistance (19), suppressing pancreatic insulin secretion (24), and stimulating hepatic glucose mobilization (5). Thus, excessive SNS activity might contribute to changes in glucose homeostasis observed in OSA patients.
Hypoxia, in particular, may be an important stimulus for metabolic dysfunction in OSA. Healthy humans exposed to acute intermittent (52) or sustained hypoxia (58) develop glucose intolerance. IH has also been found to induce features of the metabolic syndrome in rodents (21, 36, 37, 49). However, rodent experiments often induce hypoxia that is considerably more severe than that typically encountered in OSA. For example, a commonly used IH protocol lowers the ambient oxygen to ∼5%, 60 times/h. This stimulus can lower the PaO2 to <30 Torr (75) with a SaO2 nadir ranging from <50% (65) to 67% (38). By contrast, relatively mild degrees of hypoxia in human OSA are associated with glucose dyregulation (73). Second, rodent studies have been performed without warming the laboratory environment to maintain thermoneutrality (∼30°C in mice). In small mammals, cool ambient temperatures significantly raise the metabolic rate (15, 50), and hypoxia suppresses this reflex (31). Hence, interactions of cold and hypoxia can obscure the effects of hypoxia itself (41). Third, most studies involve IH exposures lasting days to weeks in an effort to simulate the chronic IH of OSA. However, brief and reversible changes in metabolism occur during IH (39, 47, 52, 77), high-altitude hypoxia (45, 78), and OSA (18, 59). To place chronic effects of IH in their proper context, these acute changes and their mechanisms must first be understood.
Based on the above considerations, we performed this study to examine the effects of acute hypoxia on glucose homeostasis and the role of the SNS in mediating effects of IH. We used a novel, thermoneutral model of IH that simulates a clinically realistic burden of hypoxia in OSA. To capture the full spectrum of OSA severity, we exposed mice to IH at different frequencies, simulating an oxygen desaturation index (ODI) of 0, 15, 30, or 60 with a fixed SaO2 nadir of 80%. This approach was used to probe dose-response relationships between simulated OSA severity and metabolism that have been observed in clinical studies (3).
MATERIALS AND METHODS
Ethical approval.
The study was approved by the Johns Hopkins University Animal Care and Use Committee and complied with the American Physiological Society Guidelines for Animal Studies.
Experimental animals.
Forty-eight 6- to 8-wk-old male C57BL6/J mice were purchased from Jackson Laboratory (Bar Harbor, ME) and acclimated to the laboratory for 2 wk before commencing experiments. All mice were maintained on an ad libitum chow diet. They were fasted for 5 h before the initiation of any experimental procedures involving blood tests. For surgical procedures, anesthesia was maintained with 2% isoflurane. The room lights were programmed to maintain a 12:12-h light-dark cycle, with lights on from 0900 to 2100. To maintain thermoneutrality, cages were placed in a Draeger IC 8000 incubator set to 30°C. To prevent accumulation of carbon dioxide and to ensure maintenance of cage temperature by the incubator, cage lids were left partially open to allow mixing of gas with the surrounding environment. Tubes for delivery of air, nitrogen, or oxygen were passed through ports in the incubator to deliver gas mixtures.
Hypoxia.
A gas control system was designed to regulate the flow of air, nitrogen, and oxygen into cages as described previously (38), with software modifications to induce IH of varying frequency (ODI of 0, 15, 30, or 60/h). A separate gas regulator system was used to clamp ambient oxygen levels for sustained hypoxia experiments. In a preliminary set of experiments, we simultaneously measured mouse oximetry (neck cuff; Starr Life Sciences, Oakmont, PA) and cage oxygen level (ProOx 110 analyzer; Biospherix, Redfield, NY) during IH. We found that the desired SaO2 nadir of 80% could be achieved targeting a cage oxygen nadir of 10–11%. Thereafter, mice were exposed to IH with continuous monitoring of cage O2 level. Intermittent air (IA) control was delivered at identical flow rates of 21% O2 and is denoted ODI 0 in IH experiments. Following IA or IH exposure for 30 min (or for 5 h in separate time course experiments), animals underwent rapid induction with isoflurane, and blood was obtained by retro-orbital puncture. For experiments where glucose was the outcome of interest, blood glucose was obtained from tail bleeding without anesthesia; tails were cut >4 h before procurement of samples to minimize stress during sampling.
Telemetry.
Mice were anesthetized with isoflurane and implanted with transmitters from Data Sciences International (St. Paul, MN). PA-C10 telemeters (pressure transducer) were placed in the left femoral arteries of mice. Signals were captured using PowerLabs 16/35 interfaced with LabChart Pro software from ADInstruments (Colorado Springs, CO).
Pharmacological inhibitors.
Mice were injected with either 0.9% phosphate-buffered saline as placebo, or with active drug 5 min before IH exposure. We used the α-adrenergic blocking agent phentolamine at 5 mg/kg and the β-blocking agent propranolol at 5 mg/kg. These doses were selected based on prior studies where these drugs effectively inhibited lipolysis (2, 23, 28) and hyperglycemia (30, 70) under various types of stressful stimuli. In addition, in a separate set of pilot experiments, phentolamine at this dose affected neither systemic blood pressure nor heart rate, whereas propranolol lowered blood pressure by ∼10% and heart rate by ∼15%.
Adrenal medullectomy.
Mice were anesthetized with 1–2% isoflurane. The lumbar area was shaved and prepped with chlorhexidine and alcohol. A 1-cm dorsal midline incision was performed between the first and third lumbar vertebra. The muscle wall was entered with mosquito forceps 1.5 cm lateral to the spine on each side. The left adrenal gland was located lateral and cranial to the spleen, and the right adrenal gland was located cranial to the right kidney. The adrenal glands were exteriorized. Small incisions were made on the adrenal capsule bilaterally, and medulla was gently squeezed out with atraumatic forceps. The adrenal capsule and attached fat pads were returned to the abdominal cavity, and the skin incision was closed. Burpenorphine (0.01 mg/kg) was administered subcutaneously at the end of surgery to minimize discomfort. Sham surgery was performed in an identical fashion, except that medulla was not removed. At least 1 wk of recovery time was allotted to mice before exposures to hypoxia for metabolic studies.
Intraperitoneal glucose tolerance test, insulin tolerance test, and biochemical assays.
For the glucose tolerance test (GTT) mice (n = 10/group) were injected with 1 g/kg glucose in the peritoneal cavity. Blood was collected from the tail in unanesthetized mice 0, 10, 20, 30, 60, 90, and 120 min after glucose injection. IH was begun immediately following the time 0 blood sample and continued for the 2 h of the assay. Blood glucose was tested with Accu-Chek Comfort Curve kits from Roche Diagnostics (Indianapolis, IN). For the insulin tolerance test (ITT), a similar procedure was followed except mice were injected with 0.5 U/kg insulin immediately at time 0 followed by exposure to acute IH. Free fatty acids (FFA) were measured by colorimetric assays (Wako Diagnostics, Richmond, VA). For GTT and ITT, IH was begun immediately following the time 0 blood sample and continued for the 2 h of the assay.
Glucose-stimulated insulin secretion.
Mice were fasted 5 h and injected with 2 mg/kg glucose in the peritoneal cavity. With the use of heparinized capillary tubes, 30 μl blood were collected from the tail before glucose injection and 5 min following injection. Blood was centrifuged to obtain plasma and insulin levels measured using an ultrasensitive ELISA assay from Alpco (Manchester, NH). Given the brief time available for obtaining samples, we exposed mice to IH for 10 min before the test and continued IH after glucose injection. Phentolamine injections were performed before the start of IH.
Statistical analysis.
For GTT and ITT data, we calculated the area under the curve (AUC) using a trapezoidal rule. The initial 40 min of the ITT curve were used in the AUC calculations, corresponding to the primary period of insulin action. For dose-response effects of sustained hypoxia or IH, a one-way ANOVA was used followed by Bonferroni posttests. For intervention experiments (phentolamine, propranolol, medullectomy) a two-way ANOVA was performed to examine the independent effects of the intervention and IH, followed by Bonferroni posttests. Statistics were calculated using GraphPad Prism (GraphPad Software, La Jolla, CA). All values are reported as means ± SE. A P value of <0.05 was considered significant.
RESULTS
IH model.
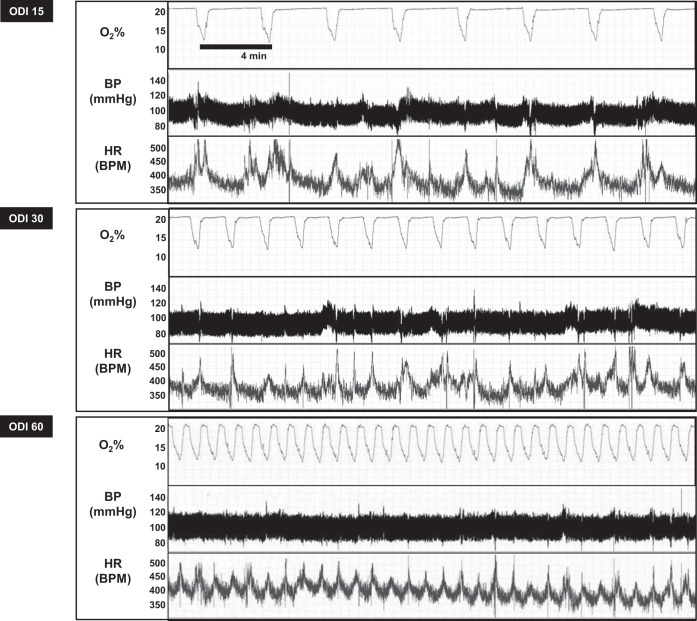
We developed an IH system capable of inducing IH at variable frequency while maintaining a constant oxygen nadir. Figure 1 shows cage oxygen saturation, blood pressure, and heart rate in a mouse during exposures to 30 min of IH at varying ODI. Table 1 shows average mouse SaO2 during these exposures. As expected, increasing ODI lowered the average 30-min oxygen level, without altering the amplitude of fluctuations in SaO2. Telemetry monitoring also revealed that each oxygen desaturation was accompanied by a brief acceleration of heart rate, without altering blood pressure in a significant manner.
Fig. 1.
Intermittent hypoxia (IH) protocol. Representative tracing of cage O2%, blood pressure (BP), and heart rate (HR) during 30 min of IH, simulating an oxygen desaturation index (ODI) of 15, 30, or 60 events/h. Each desaturation lasted 1 min with a nadir of 10–12%, which resulted in a SpO2 nadir of 80%.
Table 1.
Mouse oximetry
| Hypoxia Condition | Mean SaO2, % | Average Low SaO2, % | High SaO2, % |
|---|---|---|---|
| ODI 0 (control) | 97 ± 1 | 81 ± 4 | 97 ± 1 |
| ODI 15 | 96 ± 3 | 80 ± 7 | 97 ± 1 |
| ODI 30 | 93 ± 5 | 77 ± 4 | 97 ± 1 |
| ODI 60 | 88 ± 4 | 78 ± 7 | 97 ± 1 |
ODI, oxygen desaturation index.
Effects of acute IH and sustained hypoxia.
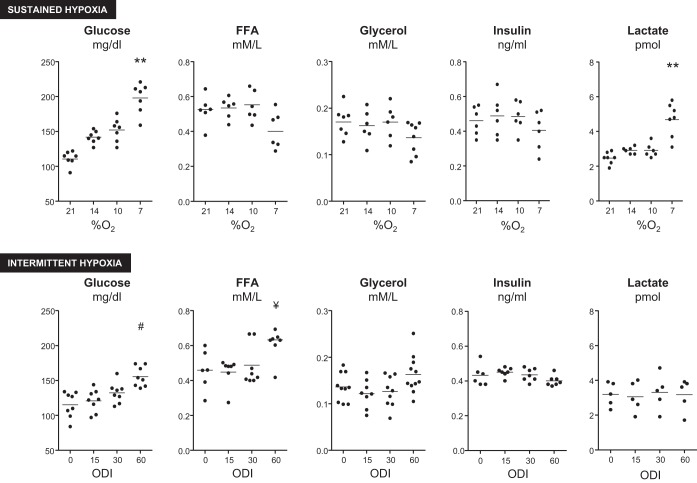
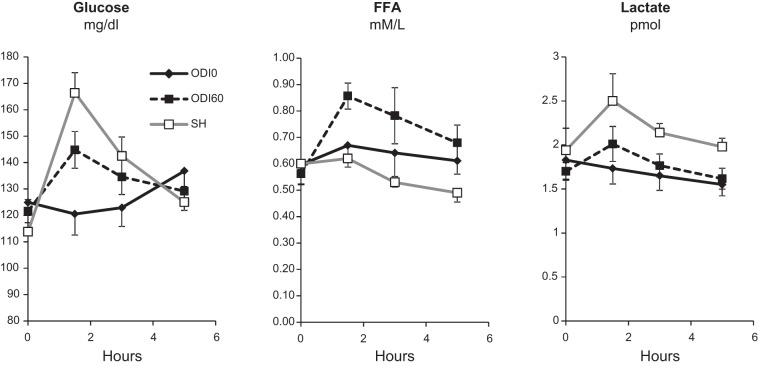
Next, we examined the effect of acute sustained or IH (Fig. 2) on plasma glucose, FFA, glycerol, insulin, and lactate. Sustained hypoxia and IH both caused a dose-dependent increase in plasma glucose. Sustained hypoxia did not affect glycerol or insulin levels. During the most severe hypoxic condition (7%), FFA trended lower (P = 0.072) and lactate levels significantly increased. IH, by contrast, increased FFA at ODI 60, and had no effect on insulin or lactate at any frequency of ODI. To further examine kinetics of substrate elevations, we performed 5-h exposures to ODI 60 or 10% sustained hypoxia and measured glucose, FFA, and lactate at 1- to 1.5-h intervals (Fig. 3). Both IH and sustained hypoxia increased glucose to the greatest extent in the first 2 h of exposure, followed by a decrease toward baseline by the end of the exposure. A similar pattern was observed for IH-induced FFA elevations. Sustained hypoxia decreased FFA after 5 h (P < 0.01). Sustained 10% hypoxia increased lactate throughout the 5-h exposure.
Fig. 2.
Effect of sustained hypoxia (SH) or IH on plasma glucose, free fatty acid (FFA), glycerol, insulin, and lactate. Both forms of hypoxia caused dose-dependent increases in glucose, whereas only ODI 60 increased FFA levels. Severe SH increased lactate. *P < 0.001 vs. 21% O2; **P < 0.01 vs. 21% O2; #P < 0.01 vs. ODI 0; ¥P < 0.05 vs. ODI 0.
Fig. 3.
Time course of glucose, FFA, and lactate levels during 5 h of 10% O2 SH or IH (ODI 60). Glucose was elevated by both forms of hypoxia, with the greatest increase observed in the first 2 h (P < 0.05 for ODI 0 vs. ODI 60 and SH for the 1.5-h time point). A similar early rise in FFA was observed during IH (P < 0.05 for ODI 0 vs. ODI 60 at the 1.5- and 3-h time points). SH decreased FFA relative to the other conditions at 5 h (P < 0.01). Lactate was increased only by SH (P < 0.05 for SH vs. other groups at 1.5-, 3-, and 5-h time points).
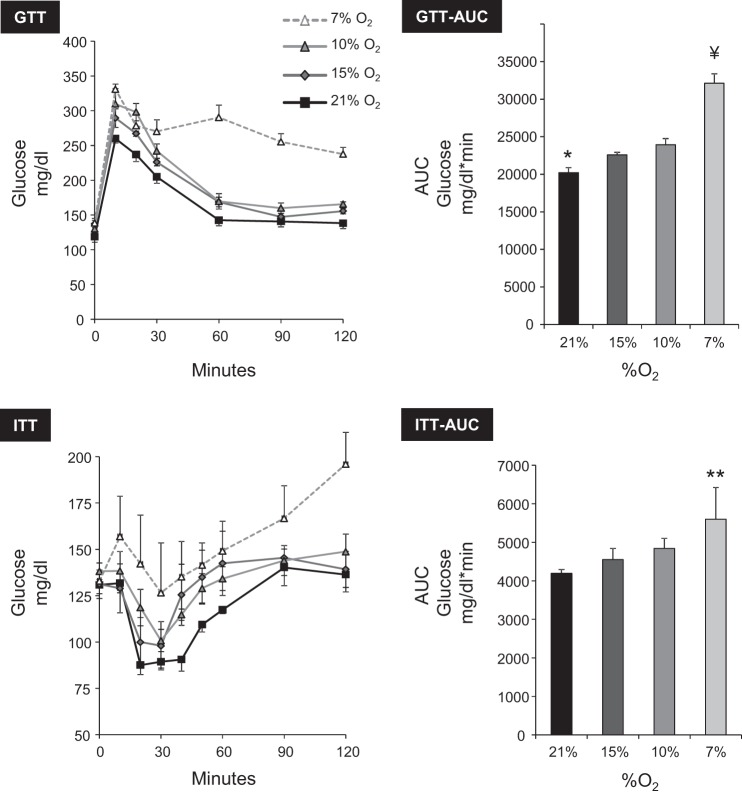
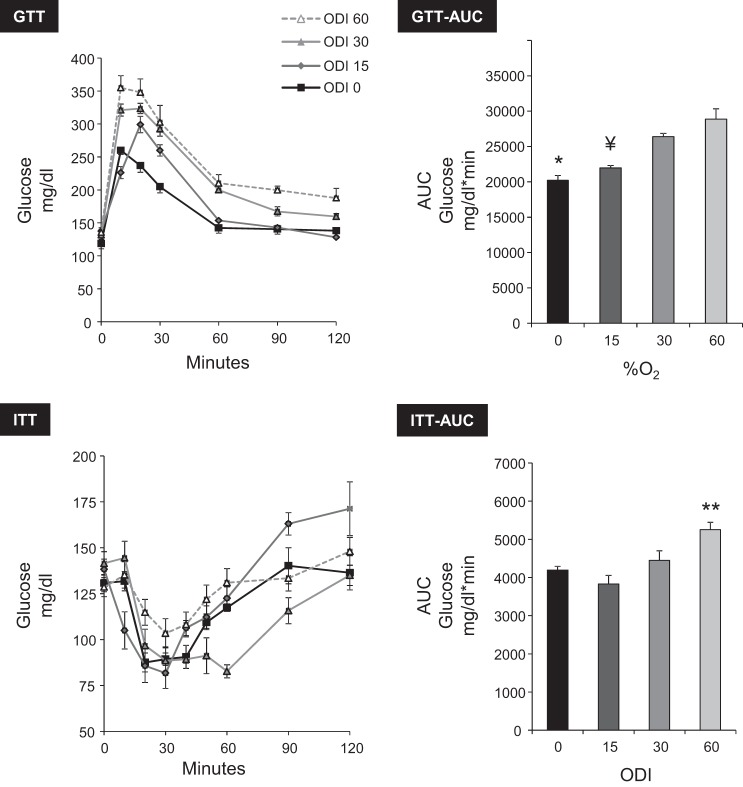
Sustained hypoxia caused glucose intolerance and insulin resistance (Fig. 4); the greater the severity of hypoxia, the more pronounced the effect on both parameters. A qualitatively similar pattern was observed during IH (Fig. 5) in which the extent of glucose intolerance and insulin resistance was dependent upon the ODI.
Fig. 4.
Effect of SH on glucose tolerance [ip glucose tolerance test (GTT)] and insulin sensitivity [insulin tolerance test (ITT)]. The glucose area under the curve (AUC) was used for statistical analysis. The degree of glucose intolerance and insulin resistance correlated with severity of hypoxia. GTT AUC: ANOVA P < 0.0001; *P < 0.05 vs. 15 or 10% O2. ITT AUC: ANOVA P < 0.0001; **P < 0.01 vs. other groups; ¥P < 0.01 vs. ODI 30 or ODI 60.
Fig. 5.
Effect of IH on glucose tolerance (ip GTT) and IH insulin sensitivity (ip ITT). The degree of glucose intolerance and insulin resistance correlated with ODI. GTT AUC: ANOVA P < 0.001; *P < 0.01 vs. ODI 30 or ODI 60; ¥P < 0.01 vs. ODI 30 or ODI 60. ITT AUC: ANOVA P = 0.006; **P < 0.01 vs. ODI 0 or ODI 15.
Metabolic effects of acute IH during SNS blockade.
Sustained hypoxia has been shown to mediate hyperglycemia and impaired insulin secretion and signaling by SNS activation (8, 9, 34, 35). We therefore investigated the SNS in mediating IH-induced metabolic changes by administering the α-adrenergic antagonist phentolamine or the β-antagonist propranolol 10 min before IH exposure. We also performed adrenal medullectomy to examine the role of circulating catecholamines, having previously demonstrated increased epinephrine and norepinephrine following acute sustained hypoxia (40) or IH (68).
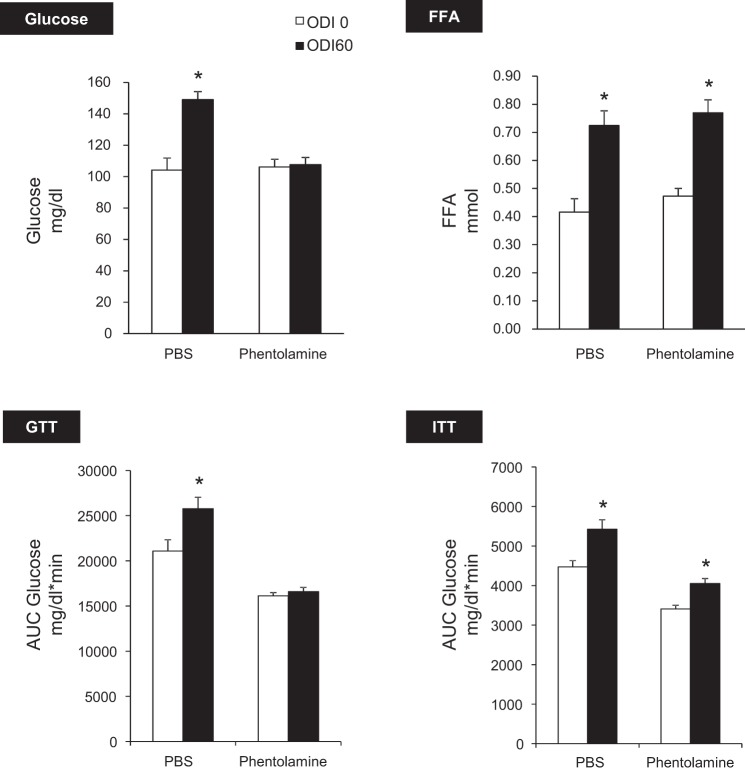
Figure 6 shows that phentolamine abolished IH-induced hyperglycemia and glucose intolerance without affecting FFA levels. Based on GTT, phentolamine independently improved glucose tolerance (P < 0.001) and abolished IH-induced glucose intolerance (IH × drug interaction, P < 0.05). Phentolamine improved insulin sensitivity in both ODI 60 and ODI 0 groups (P < 0.001). However, there was no interaction between effects of phentolamine and IH.
Fig. 6.
Effects of α-adrenoreceptor (AR) blockade with phentolamine. IH caused hyperglycemia and glucose intolerance (*P < 0.01 vs. ODI 0), and both effects were abolished by phentolamine. Phentolamine independently increased glucose tolerance (P < 0.001) and insulin sensitivity (P < 0.001). Phentolamine did not modify IH-induced lipolysis or insulin resistance.
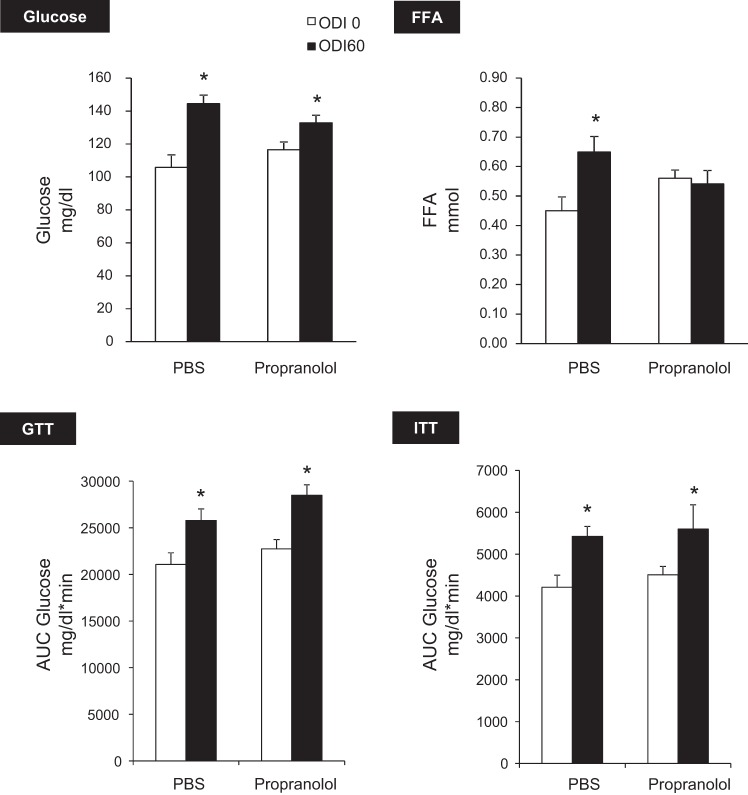
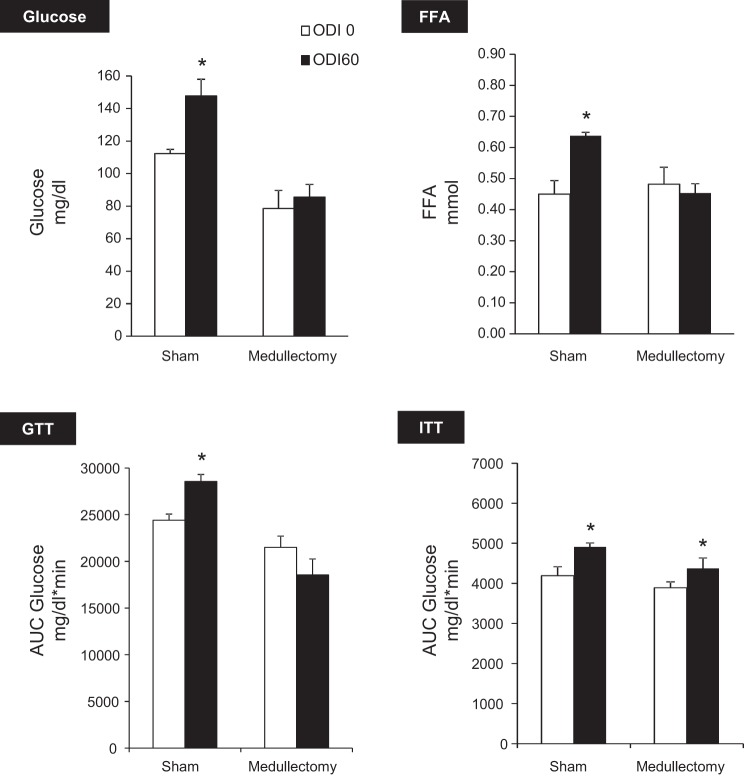
Collectively, these experiments demonstrate that IH induces hyperglycemia and glucose intolerance in a manner dependent upon intact α-adrenergic signaling. Metabolic effects of β-blockade with propranolol are shown in Fig. 7. Propranolol prevented IH-induced FFA elevation but did not affect glucose levels, glucose tolerance, or insulin sensitivity. These results suggest that β-adrenergic signaling mediates lipolysis during IH but does not play a significant role in glucose homeostasis. Adrenal medullectomy independently lowered fasting glucose (P < 0.0001) and improved glucose tolerance (Fig. 8). In addition, medullectomy abolished IH-induced hyperglycemia, glucose intolerance, and lipolysis.
Fig. 7.
Effect of β-AR blockade with propranolol. Propranolol abolished IH-induced FFA elevation but did not affect any glucose parameters. *P < 0.01 vs. ODI 0.
Fig. 8.
Effect of adrenal medullectomy. Medullectomy independently decreased glucose (P < 0.0001) and increased glucose tolerance (P < 0.01) and prevented IH-induced hyperglycemia, glucose intolerance, and lipolysis without affecting IH-induced insulin resistance. *P < 0.05 vs. ODI 0.
To determine if phentolamine improved glucose sensitivity by promoting insulin secretion, we examined in vivo glucose-stimulated insulin secretion (GSIS, Fig. 9). IH (ODI 60) inhibited insulin secretion (P < 0.01). Phentolamine greatly enhanced GSIS under both ODI 0 and ODI 60, and the rise in insulin was greater during IH. Hence, glucose intolerance during acute IH is mediated, at least in part, by α-adrenergic suppression of insulin secretion.
Fig. 9.
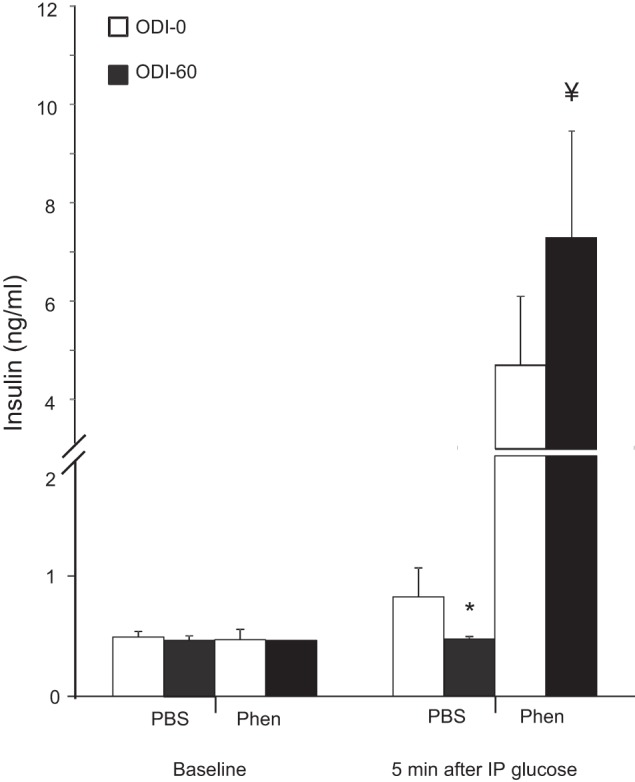
Glucose-stimulated insulin secretion. IH decreased insulin secretion (*P < 0.05, ODI 60 vs. ODI 0), whereas phentolamine independently increased insulin secretion (P < 0.0001) and insulin secretion during IH (¥P < 0.05, ODI 60 vs. ODI 0).
DISCUSSION
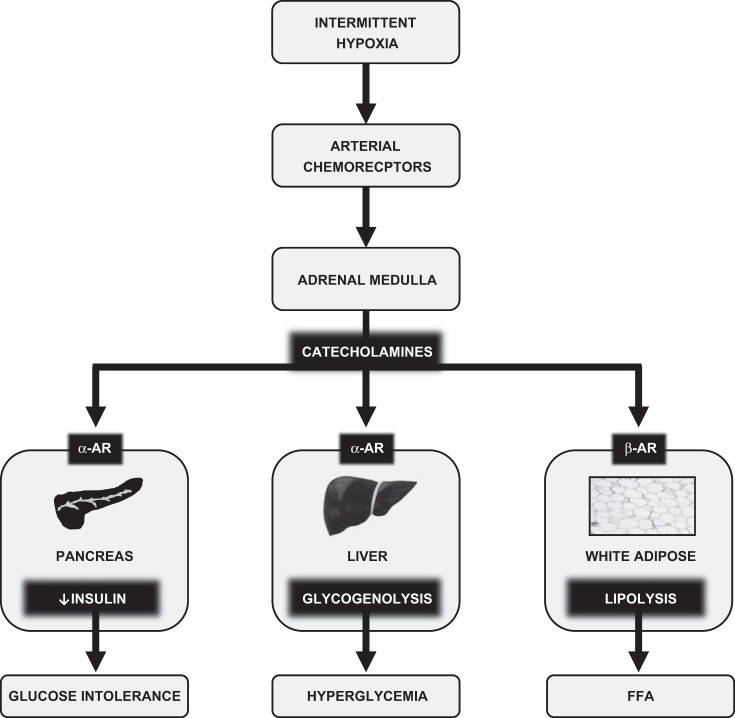
In this study we examined metabolic consequences of acute IH and the role of the SNS in mediating these effects. Comparing sustained hypoxia with IH, we noted many similarities. Both stimuli caused hyperglycemia, glucose intolerance, and insulin resistance. During sustained hypoxia, the magnitude of effect was proportional to the depth of hypoxia; during IH, effects were proportional to the frequency of hypoxia (ODI). In addition, effects of IH on glucose intolerance and hyperglycemia were abolished by α-adrenergic blockade or adrenal medullectomy and unaffected by β-blockade. These findings offer a physiological explanation for the metabolic consequences of IH, and perhaps for the metabolic consequences of OSA. Figure 10 is a schematic that summarizes our findings. In the discussion that follows, we will elaborate upon these findings and their significance.
Fig. 10.
Effects of acute IH on glucose homeostasis. IH stimulates arterial chemoreceptors that in turn activate the sympathetic nervous system (SNS). Downstream activation of α-AR in the pancreas and liver, respectively, inhibit insulin secretion and stimulate glycogenolysis. Activation of β-AR stimulates white adipose tissue lipolysis. The net effect of IH is glucose intolerance, hyperglycemia, and FFA elevation. Similar pathways have been demonstrated for other forms of acute stress, including SH.
Within minutes, we observed that hypoxia caused a significant increase in plasma glucose, glucose intolerance, and insulin resistance. Glucose levels remained elevated for ∼3 h and later normalized during ongoing exposure to IH or sustained hypoxia (Fig. 3). Similarly, humans exposed to 30 min of sustained hypoxia (58) or 5 h of IH exhibited impaired insulin sensitivity in association with markers of heightened sympathetic activity (52). These results agree with other studies of acute hypoxia in animals (54, 74, 77). Lee et al. (47) demonstrated nearly equivalent effects of acute IH or sustained hypoxia on insulin sensitivity. After chronic IH, insulin sensitivity continued to resemble that of acute hypoxia, whereas, after chronic sustained hypoxia, insulin sensitivity improved (47). Thus, our results underscore similarities between IH and sustained hypoxia in the acute setting. We also revealed a strong relationship between ODI and plasma glucose. In OSA, disordered breathing severity correlates with HbA1c (60, 69) and glucose levels during sleep (10, 17, 18, 22, 59). Taken together, these results suggest that OSA has dynamic effects on glucose metabolism that may correlate with the burden of hypoxia during sleep. Even transient changes in glucose homeostasis could have chronic implications for the development of diabetes mellitus (14, 22, 26).
The impact of IH on fasting hyperglycemia and impaired glucose tolerance was abolished by phentolamine, a finding that can be understood considering the metabolic consequences of α- and β-adrenoreceptor (AR) stimulation (1, 24, 27, 44, 51). Systemic α-adrenergic stimulation raises plasma glucose via hepatic glycogenolysis and gluconeogenesis and suppresses pancreatic insulin secretion. Hyperglycemia during IH, without changes in plasma insulin (Fig. 2), suggests mobilization of glucose by α-AR stimulation of glycogenolysis. Glucose intolerance during IH is at least partially attributable to impaired pancreatic GSIS (Fig. 9). Interestingly, phentolamine interacted with IH to increase insulin secretion, and this effect was likely caused by an “unmasking” of the high insulin demand during systemic hyperglycemia and insulin resistance. To our knowledge, this is the first study to demonstrate that IH causes hyperglycemia and lowered insulin secretion by α-adrenergic pathways. In this regard, IH is analogous to exercise (13, 42), surgical stress (56), epinephrine infusion (30, 62), and acute sustained hypoxia (9, 35, 61). Our results may shed light on the finding that IH caused insulin resistance without a compensatory increase in insulin secretion in humans (52).
A crucial implication of this work is that clinically realistic IH does not cause glucose intolerance or hyperglycemia by inducing cellular oxygen insufficiency. Rather, metabolic effects of IH can be ascribed to SNS activation. This implicates the arterial chemoreflexes in the metabolic consequences of IH (72). Our findings do not refute literature demonstrating that IH can induce inflammation and oxidative stress through direct cellular pathways (46, 55, 67). Perhaps these direct effects of IH are responsible for insulin resistance, which could not be prevented by any method of SNS blockade in this study. Alternatively, hypoxia may have caused circulatory changes that reduced delivery of glucose and/or insulin to tissues. Iyori et al. also found that autonomic blockade with hexamethonium (33) failed to prevent IH-induced insulin resistance. Further studies will be needed to clarify mechanisms of IH-induced insulin resistance.
In terms of lipid metabolism, ODI 60 stimulated lipolysis, which was not observed with IH at a lower ODI, or with sustained hypoxia (Fig. 3). We (41) and others have demonstrated that hypoxia can stimulate or suppress lipolysis depending on experimental conditions (6, 7, 43, 66). Perhaps ODI 60 induces a lipolytic SNS response without elevating lactate, which can inhibit lipolysis (25). Propranolol or medullectomy prevented IH-induced lipolysis, which is consistent with the role of β-AR in the regulation of hormone-stimulated lipolysis. Excessive FFA inhibit insulin-stimulated glucose uptake in skeletal muscle (11). However, lowering FFA during IH did not alleviate insulin resistance, suggesting that FFA were not responsible under these experimental conditions.
This study is subject to certain limitations. First, we examined only acute forms of hypoxia. OSA is a chronic condition, and the physiological consequences of chronic IH may differ. In particular, IH can lead to long-lasting SNS activation that persists beyond the period of hypoxia (20, 48). We plan subsequent studies in this model examining the effects of chronic IH. Second, we induced IH without other aspects of OSA such as sleep arousals and thoracic pressure changes. However, this approach also provides unique insights into the isolated significance of IH in OSA. Third, we did not directly measure catecholamine levels or their peripheral interactions at the tissue level. We have previously shown acute elevations of serum epinephrine and norepinephrine during sustained hypoxia or IH (40, 68) and the effectiveness of adrenal medullectomy (68). Classic studies have defined the metabolic effects of catecholamine stimulation in liver (71), fat (44), and pancreas (63). Thus, substantial evidence supports the central role of circulating catecholamines in mediating glucose mobilization and intolerance during IH.
In summary, IH or sustained hypoxia both acutely cause a similar pattern of hyperglycemia, glucose intolerance, and insulin resistance. During IH, circulating catecholamines, through their action on α-ARs, promote glycogenolysis and inhibit pancreatic insulin secretion. Insulin resistance during IH may occur independently of SNS activation.
GRANTS
This work was supported by National Heart, Lung, and Blood Institute Grants 1-K08-HL-109475–01A1 and R01-HL-080105 and National Institutes of Health Diabetes Research and Training Pilot & Feasibility Grant 114525-JHU-UMD.
DISCLOSURES
No conflicts of interest, financial or otherwise, are declared by the authors.
AUTHOR CONTRIBUTIONS
Author contributions: J.C.J. and V.Y.P. conception and design of research; J.C.J., M.-K.S., R.D., Q.Y., and S.B.-F. performed experiments; J.C.J., R.D., and S.B.-F. analyzed data; J.C.J., R.D., O.M., and V.Y.P. interpreted results of experiments; J.C.J. prepared figures; J.C.J. drafted manuscript; J.C.J., O.M., and V.Y.P. edited and revised manuscript; J.C.J. and V.Y.P. approved final version of manuscript.
REFERENCES
- 1.Ahlquist RP. Development of the concept of alpha and beta adrenotropic receptors. Ann NY Acad Sci 139: 549–552, 1967. [DOI] [PubMed] [Google Scholar]
- 2.Allison SP, Chamberlain MJ, Miller JE, Ferguson R, Gillett AP, Bemand BV, Saunders RA. Effects of propranolol on blood sugar, insulin and free fatty acids. Diabetologia 5: 339–342, 1969. [DOI] [PubMed] [Google Scholar]
- 3.Aronsohn RS, Whitmore H, Van CE, Tasali E. Impact of untreated obstructive sleep apnea on glucose control in type 2 diabetes. Am J Respir Crit Care Med 181: 507–513, 2010. [DOI] [PMC free article] [PubMed] [Google Scholar]
- 4.Babu AR, Herdegen J, Fogelfeld L, Shott S, Mazzone T. Type 2 diabetes, glycemic control, and continuous positive airway pressure in obstructive sleep apnea. Arch Intern Med 165: 447–452, 2005. [DOI] [PubMed] [Google Scholar]
- 5.Barth E, Albuszies G, Baumgart K, Matejovic M, Wachter U, Vogt J, Radermacher P, Calzia E. Glucose metabolism and catecholamines. Crit Care Med 35: S508–S518, 2007. [DOI] [PubMed] [Google Scholar]
- 6.Baum D. Inhibition of lipolysis by hypoxia in puppies. Proc Soc Exp Biol Med 125: 1190–1194, 1967. [DOI] [PubMed] [Google Scholar]
- 7.Baum D. The inhibition of norepinephrine-stimulated lipolysis by acute hypoxia. J Pharmacol Exp Ther 169: 87–94, 1969. [PubMed] [Google Scholar]
- 8.Baum D, Porte D., Jr Beta adrenergic receptor dysfunction in hypoxic inhibition of insulin release. Endocrinology 98: 359–366, 1976. [DOI] [PubMed] [Google Scholar]
- 9.Baum D, Porte D., Jr Stress hyperglycemia and the adrenergic regulation of pancreatic hormones in hypoxia. Metabolism 29: 1176–1185, 1980. [DOI] [PubMed] [Google Scholar]
- 10.Bialasiewicz P, Czupryniak L, Pawlowski M, Nowak D. Sleep disordered breathing in REM sleep reverses the downward trend in glucose concentration. Sleep Med 12: 76–82, 2011. [DOI] [PubMed] [Google Scholar]
- 11.Boden G. Fatty acid-induced inflammation and insulin resistance in skeletal muscle and liver. Curr Diab Rep 6: 177–181, 2006. [DOI] [PubMed] [Google Scholar]
- 12.Botros N, Concato J, Mohsenin V, Selim B, Doctor K, Yaggi HK. Obstructive sleep apnea as a risk factor for type 2 diabetes. Am J Med 122: 1122–1127, 2009. [DOI] [PMC free article] [PubMed] [Google Scholar]
- 13.Brisson GR, Malaisse-Lagae F, Malaisse WJ. Effect of phentolamine upon insulin secretion during exercise. Diabetologia 7: 223–226, 1971. [DOI] [PubMed] [Google Scholar]
- 14.Brotman DJ, Girod JP. The metabolic syndrome: a tug-of-war with no winner. Cleve Clin J Med 69: 990–994, 2002. [DOI] [PubMed] [Google Scholar]
- 15.Cannon B, Nedergaard J. Nonshivering thermogenesis and its adequate measurement in metabolic studies. J Exp Med 214: 242–253, 2011. [DOI] [PubMed] [Google Scholar]
- 16.Celen YT, Hedner J, Carlson J, Peker Y. Impact of gender on incident diabetes mellitus in obstructive sleep apnea: a 16-year follow-up. J Clin Sleep Med 6: 244–250, 2010. [PMC free article] [PubMed] [Google Scholar]
- 17.Czupryniak L, Loba J, Pawlowski M, Nowak D, Bialasiewicz P. Treatment with continuous positive airway pressure may affect blood glucose levels in nondiabetic patients with obstructive sleep apnea syndrome. Sleep 28: 601–603, 2005. [DOI] [PubMed] [Google Scholar]
- 18.Dawson A, Abel SL, Loving RT, Dailey G, Shadan FF, Cronin JW, Kripke DF, Kline LE. CPAP therapy of obstructive sleep apnea in type 2 diabetics improves glycemic control during sleep. J Clin Sleep Med 4: 538–542, 2008. [PMC free article] [PubMed] [Google Scholar]
- 19.Deibert DC, Defronzo RA. Epinephrine-induced insulin resistance in man. J Clin Invest 65: 717–721, 1980. [DOI] [PMC free article] [PubMed] [Google Scholar]
- 20.Dick TE, Hsieh YH, Wang N, Prabhakar N. Acute intermittent hypoxia increases both phrenic and sympathetic nerve activities in the rat. Exp Physiol 92: 87–97, 2007. [DOI] [PubMed] [Google Scholar]
- 21.Drager LF, Li J, Reinke C, Bevans-Fonti S, Jun JC, Polotsky VY. Intermittent hypoxia exacerbates metabolic effects of diet-induced obesity. Obesity (Silver Spring) 19: 2167–2174, 2011. [DOI] [PMC free article] [PubMed] [Google Scholar]
- 22.Elizur A, Maliar A, Shpirer I, Buchs AE, Shiloah E, Rapoport MJ. Decreased nocturnal glucose variability in non-diabetic patients with sleep apnea: a pilot study. Israel Med Assoc J 15: 465–469, 2013. [PubMed] [Google Scholar]
- 23.Fabian HE, Chemerinski E, Merlo AB, Izquierdo JA. Effect of propranolol on free fatty acids of mice plasma during a passive avoidance test. Psychopharmacologia 30: 369–374, 1973. [DOI] [PubMed] [Google Scholar]
- 24.Fagerholm V, Haaparanta M, Scheinin M. alpha2-adrenoceptor regulation of blood glucose homeostasis. Basic Clin Pharmacol Toxicol 108: 365–370, 2011. [DOI] [PubMed] [Google Scholar]
- 25.Frayn KN. Fat as a fuel: emerging understanding of the adipose tissue-skeletal muscle axis. Acta Physiol (Oxf) 199: 509–518, 2010. [DOI] [PubMed] [Google Scholar]
- 26.Gimeno-Orna JA, Castro-Alonso FJ, Boned-Juliani B, Lou-Arnal LM. Fasting plasma glucose variability as a risk factor of retinopathy in type 2 diabetic patients. J Diabetes Comp 17: 78–81, 2003. [DOI] [PubMed] [Google Scholar]
- 27.Haffner CA, Kendall MJ. Metabolic effects of beta 2-agonists. J Clin Pharm Ther 17: 155–164, 1992. [DOI] [PubMed] [Google Scholar]
- 28.Hall PE, Smith SR, Jack DB, Kendall MJ. The influence of beta-adrenoceptor blockade on the lipolytic response to exercise. J Clin Pharm Ther 12: 101–106, 1987. [DOI] [PubMed] [Google Scholar]
- 29.Harsch IA, Schahin SP, Radespiel-Troger M, Weintz O, Jahreiss H, Fuchs FS, Wiest GH, Hahn EG, Lohmann T, Konturek PC, Ficker JH. Continuous positive airway pressure treatment rapidly improves insulin sensitivity in patients with obstructive sleep apnea syndrome. Am J Respir Crit Care Med 169: 156–162, 2004. [DOI] [PubMed] [Google Scholar]
- 30.Hermansen K, Hyttel I. The hyperglycaemic activity of some catecholamines and the effect of alph- and beta-adrenergic blocking compounds in the mouse. Acta Pharmacol Toxicol 29: 87–94, 1971. [DOI] [PubMed] [Google Scholar]
- 31.Hill J. The oxygen consumption of new-born and adult mammals. Its dependence on the oxygen tension in the inspired air and on the environmental temperature. J Physiol 149: 346–373, 1959. [DOI] [PMC free article] [PubMed] [Google Scholar]
- 32.Iftikhar IH, Khan MF, Das A, Magalang UJ. Meta-analysis: continuous positive airway pressure improves insulin resistance in patients with sleep apnea without diabetes. Ann Am Thoracic Soc 10: 115–120, 2013. [DOI] [PMC free article] [PubMed] [Google Scholar]
- 33.Iiyori N, Alonso LC, Li J, Sanders MH, Garcia-Ocana A, O'Doherty RM, Polotsky VY, O'Donnell CP. Intermittent hypoxia causes insulin resistance in lean mice independent of autonomic activity. Am J Respir Crit Care Med 175: 851–857, 2007. [DOI] [PMC free article] [PubMed] [Google Scholar]
- 34.Jackson BT, Cohn HE, Morrison SH, Baker RM, Piasecki GJ. Hypoxia-induced sympathetic inhibition of the fetal plasma insulin response to hyperglycemia. Diabetes 42: 1621–1625, 1993. [DOI] [PubMed] [Google Scholar]
- 35.Jones CT, Ritchie JW, Walker D. The effects of hypoxia on glucose turnover in the fetal sheep. J Dev Physiol 5: 223–235, 1983. [PubMed] [Google Scholar]
- 36.Jun J, Polotsky VY. Metabolic consequences of sleep-disordered breathing. ILAR J 50: 289–306, 2009. [DOI] [PMC free article] [PubMed] [Google Scholar]
- 37.Jun J, Polotsky VY. Sleep disordered breathing and metabolic effects: evidence from animal models. Sleep Med Clin 2: 263–277, 2007. [DOI] [PMC free article] [PubMed] [Google Scholar]
- 38.Jun J, Reinke C, Bedja D, Berkowitz D, Bevans-Fonti S, Li J, Barouch LA, Gabrielson K, Polotsky VY. Effect of intermittent hypoxia on atherosclerosis in apolipoprotein E-deficient mice. Atherosclerosis 209: 381–386, 2010. [DOI] [PMC free article] [PubMed] [Google Scholar]
- 39.Jun JC, Drager LF, Najjar SS, Gottlieb SS, Brown CD, Smith PL, Schwartz AR, Polotsky VY. Effects of sleep apnea on nocturnal free fatty acids in subjects with heart failure. Sleep 34: 1207–1213, 2011. [DOI] [PMC free article] [PubMed] [Google Scholar]
- 40.Jun JC, Shin MK, Yao Q, Bevans-Fonti S, Poole J, Drager LF, Polotsky VY. Acute hypoxia induces hypertriglyceridemia by decreasing plasma triglyceride clearance in mice. Am J Physiol Endocrinol Metab 303: E377–E388, 2012. [DOI] [PMC free article] [PubMed] [Google Scholar]
- 41.Jun JC, Shin MK, Yao Q, Devera R, Fonti-Bevans S, Polotsky VY. Thermoneutrality modifies the impact of hypoxia on lipid metabolism. Am J Physiol Endocrinol Metab 304: E424–E435, 2013. [DOI] [PMC free article] [PubMed] [Google Scholar]
- 42.Karlsson S, Ahren B. Insulin and glucagon secretion in swimming mice: effects of autonomic receptor antagonism. Metabolism 39: 724–732, 1990. [DOI] [PubMed] [Google Scholar]
- 43.Kuwahira I, Gonzalez NC, Heisler N, Piiper J. Changes in regional blood flow distribution and oxygen supply during hypoxia in conscious rats. J Appl Physiol 74: 211–214, 1993. [DOI] [PubMed] [Google Scholar]
- 44.Lafontan M, Barbe P, Galitzky J, Tavernier G, Langin D, Carpene C, Bousquet-Melou A, Berlan M. Adrenergic regulation of adipocyte metabolism. Human Reprod 12, Suppl 1: 6–20, 1997. [DOI] [PubMed] [Google Scholar]
- 45.Larsen JJ, Hansen JM, Olsen NV, Galbo H, Dela F. The effect of altitude hypoxia on glucose homeostasis in men. J Physiol 504: 241–249, 1997. [DOI] [PMC free article] [PubMed] [Google Scholar]
- 46.Lavie L. Obstructive sleep apnoea syndrome–an oxidative stress disorder. Sleep Med Rev 7: 35–51, 2003. [DOI] [PubMed] [Google Scholar]
- 47.Lee EJ, Alonso LC, Stefanovski D, Strollo HC, Romano LC, Zou B, Singamsetty S, Yester KA, McGaffin KR, Garcia-Ocana A, O'Donnell CP. Time-dependent changes in glucose and insulin regulation during intermittent hypoxia and continuous hypoxia. Eur J Appl Physiol 113: 467–478, 2013. [DOI] [PMC free article] [PubMed] [Google Scholar]
- 48.Leuenberger UA, Hogeman CS, Quraishi SA, Linton-Frazier L, Gray KS. Short-term intermittent hypoxia enhances sympathetic responses to continuous hypoxia in humans. J Appl Physiol 103: 835–842, 2007. [DOI] [PubMed] [Google Scholar]
- 49.Li J, Grigoryev DN, Ye SQ, Thorne L, Schwartz AR, Smith PL, O'Donnell CP, Polotsky VY. Chronic intermittent hypoxia upregulates genes of lipid biosynthesis in obese mice. J Appl Physiol 99: 1643–1648, 2005. [DOI] [PubMed] [Google Scholar]
- 50.Lodhi IJ, Semenkovich CF. Why we should put clothes on mice. Cell Metab 9: 111–112, 2009. [DOI] [PubMed] [Google Scholar]
- 51.Lohmann FW, Loesment WA, Kaehler H. Beta-receptor blockade, physical activity, and metabolism. J Cardiovasc Pharmacol 16, Suppl 5: S45–S52, 1990. [PubMed] [Google Scholar]
- 52.Louis M, Punjabi NM. Effects of acute intermittent hypoxia on glucose metabolism in awake healthy volunteers. J Appl Physiol 106: 1538–1544, 2009. [DOI] [PMC free article] [PubMed] [Google Scholar]
- 53.Marshall NS, Wong KK, Phillips CL, Liu PY, Knuiman MW, Grunstein RR. Is sleep apnea an independent risk factor for prevalent and incident diabetes in the Busselton Health Study? J Clin Sleep Med 5: 15–20, 2009. [PMC free article] [PubMed] [Google Scholar]
- 54.McElroy W. Hypoxia as a stimulus for free fatty acid mobilization in dogs. J Appl Physiol 16: 760–762, 1961. [DOI] [PubMed] [Google Scholar]
- 55.McNicholas WT. Obstructive sleep apnea and inflammation. Prog Cardiovasc Dis 51: 392–399, 2009. [DOI] [PubMed] [Google Scholar]
- 56.Nakao K, Miyata M. The influence of phentolamine, an adrenergic blocking agent, on insulin secretion during surgery. Eur J Clin Invest 7: 41–45, 1977. [DOI] [PubMed] [Google Scholar]
- 57.Nannapaneni S, Ramar K, Surani S. Effect of obstructive sleep apnea on type 2 diabetes mellitus: a comprehensive literature review. World J Diabetes 4: 238–244, 2013. [DOI] [PMC free article] [PubMed] [Google Scholar]
- 58.Oltmanns KM, Gehring H, Rudolf S, Schultes B, Rook S, Schweiger U, Born J, Fehm HL, Peters A. Hypoxia causes glucose intolerance in humans. Am J Respir Crit Care Med 169: 1231–1237, 2004. [DOI] [PubMed] [Google Scholar]
- 59.Pallayova M, Donic V, Tomori Z. Beneficial effects of severe sleep apnea therapy on nocturnal glucose control in persons with type 2 diabetes mellitus. Diabetes Res Clin Pract 81: e8–e11, 2008. [DOI] [PubMed] [Google Scholar]
- 60.Papanas N, Steiropoulos P, Nena E, Tzouvelekis A, Maltezos E, Trakada G, Bouros D. HbA1c is associated with severity of obstructive sleep apnea hypopnea syndrome in nondiabetic men. Vasc Health Risk Manag 5: 751–756, 2009. [DOI] [PMC free article] [PubMed] [Google Scholar]
- 61.Peltonen GL, Scalzo RL, Schweder MM, Larson DG, Luckasen GJ, Irwin D, Hamilton KL, Schroeder T, Bell C. Sympathetic inhibition attenuates hypoxia induced insulin resistance in healthy adult humans. J Physiol 590: 2801–2809, 2012. [DOI] [PMC free article] [PubMed] [Google Scholar]
- 62.Porta S, Hofmann HM, Ertl U, Rinner I, Puerstner P, Weiss PA, Felsner P, Korsatko W. Preventive action of phentolamine on adrenaline induced blood glucose elevation in humans. Acta Endocrinol 117: 166–172, 1988. [DOI] [PubMed] [Google Scholar]
- 63.Porte D, Jr, Robertson RP. Control of insulin secretion by catecholamines, stress, and the sympathetic nervous system. Fed Proc 32: 1792–1796, 1973. [PubMed] [Google Scholar]
- 64.Reichmuth KJ, Austin D, Skatrud JB, Young T. Association of sleep apnea and type II diabetes: a population-based study. Am J Respir Crit Care Med 172: 1590–1595, 2005. [DOI] [PMC free article] [PubMed] [Google Scholar]
- 65.Reinke C, Bevans-Fonti S, Drager LF, Shin MK, Polotsky VY. Effects of different acute hypoxic regimens on tissue oxygen profiles and metabolic outcomes. J Appl Physiol 111: 881–890, 2011. [DOI] [PMC free article] [PubMed] [Google Scholar]
- 66.Rosell S. Release of free fatty acids from subcutaneous adipose tissue in dogs following sympathetic nerve stimulation. Acta Physiol Scand 67: 343–351, 1966. [DOI] [PubMed] [Google Scholar]
- 67.Ryan S, Taylor CT, McNicholas WT. Selective activation of inflammatory pathways by intermittent hypoxia in obstructive sleep apnea syndrome. Circulation 112: 2660–2667, 2005. [DOI] [PubMed] [Google Scholar]
- 68.Shin MK, Han W, Bevans-Fonti S, Jun JC, Punjabi NM, Polotsky VY. The effect of adrenal medullectomy on metabolic responses to chronic intermittent hypoxia. Respir Physiol Neurobiol 203: 60–67, 2014. [DOI] [PMC free article] [PubMed] [Google Scholar]
- 69.Shpirer I, Rapoport MJ, Stav D, Elizur A. Normal and elevated HbA1C levels correlate with severity of hypoxemia in patients with obstructive sleep apnea and decrease following CPAP treatment. Sleep Breathing 16: 461–466, 2012. [DOI] [PubMed] [Google Scholar]
- 70.Skoglund G, Lundquist I, Ahren B. Effects of alpha 1- and alpha 2-adrenoceptor stimulation and blockade on plasma insulin levels in the mouse. Pancreas 1: 415–420, 1986. [DOI] [PubMed] [Google Scholar]
- 71.Snell K. Regulation of hepatic glucose metabolism by insulin and counter-regulatory hormones. Proc Nutr Soc 50: 567–575, 1991. [DOI] [PubMed] [Google Scholar]
- 72.Somers VK, Abboud FM. Chemoreflexes–responses, interactions and implications for sleep apnea. Sleep 16: S30–S33, 1993. [PubMed] [Google Scholar]
- 73.Stamatakis K, Sanders MH, Caffo B, Resnick HE, Gottlieb DJ, Mehra R, Punjabi NM. Fasting glycemia in sleep disordered breathing: lowering the threshold on oxyhemoglobin desaturation. Sleep 31: 1018–1024, 2008. [PMC free article] [PubMed] [Google Scholar]
- 74.Stickney JC, Northup DW, Van Liere EJ. Blood sugar and dextrose tolerance during anoxia in the dog. Am J Physiol 154: 423–427, 1948. [DOI] [PubMed] [Google Scholar]
- 75.Tagaito Y, Polotsky VY, Campen MJ, Wilson JA, Balbir A, Smith PL, Schwartz AR, O'Donnell CP. A model of sleep-disordered breathing in the C57BL/6J mouse. J Appl Physiol 91: 2758–2766, 2001. [DOI] [PubMed] [Google Scholar]
- 76.West SD, Nicoll DJ, Wallace TM, Matthews DR, Stradling JR. Effect of CPAP on insulin resistance and HbA1c in men with obstructive sleep apnoea and type 2 diabetes. Thorax 62: 969–974, 2007. [DOI] [PMC free article] [PubMed] [Google Scholar]
- 77.Yokoe T, Alonso LC, Romano LC, Rosa TC, O'Doherty RM, Garcia-Ocana A, Minoguchi K, O'Donnell CP. Intermittent hypoxia reverses the diurnal glucose rhythm and causes pancreatic beta-cell replication in mice. J Physiol 586: 899–911, 2008. [DOI] [PMC free article] [PubMed] [Google Scholar]
- 78.Young PM, Rose MS, Sutton JR, Green HJ, Cymerman A, Houston CS. Operation Everest II: plasma lipid and hormonal responses during a simulated ascent of Mt. Everest. J Appl Physiol 66: 1430–1435, 1989. [DOI] [PubMed] [Google Scholar]


