Abstract
Quantitative modeling of physiological processes in vasculatures requires an accurate representation of network topology, including vessel branching. We propose a new approach for reconstruction of vascular network, which determines how vessel bifurcations distribute red blood cells (RBC) in the microcirculation. Our method follows the foundational premise of Murray's law in postulating the existence of functional optimality of such networks. It accounts for the non-Newtonian behavior of blood by allowing the apparent blood viscosity to vary with discharge hematocrit and vessel radius. The optimality criterion adopted in our approach is the physiological cost of supplying oxygen to the tissue surrounding a blood vessel. Bifurcation asymmetry is expressed in terms of the amount of oxygen consumption associated with the respective tissue volumes being supplied by each daughter vessel. The vascular networks constructed with our approach capture a number of physiological characteristics observed in in vivo studies. These include the nonuniformity of wall shear stress in the microcirculation, the significant increase in pressure gradients in the terminal sections of the network, the nonuniformity of both the hematocrit partitioning at vessel bifurcations and hematocrit across the capillary bed, and the linear relationship between the RBC flux fraction and the blood flow fraction at bifurcations.
Keywords: hematocrit, bifurcation, vascular network, Murray's law, red blood cell distribution
quantitative modeling of physiological processes in vasculatures requires an accurate representation of network topology, including vessel branching. The standard conceptualization of a vascular network assumes both that each blood vessel bifurcates at successive levels of the network and that each bifurcation follows Murray's law (34, 35) or its empirical modifications that are usually based on morphometric data (25, 36, 42). In its general form, Murray's law states that a parent blood vessel of radius Rp branches into N daughter vessels of (possibly different) radii Rdi (i = 1, . . . , N) such that Rp3 = Rd13 + . . . + RdN3; bifurcating networks correspond to N = 2. A fundamental consequence of Murray's law is the predicted uniformity of wall shear stress (WSS) throughout the vasculature (25, 38, 45). While Murray's law generally holds in the macrocirculation (28, 33), a number of in vivo studies demonstrate its breakdown in microcirculatory networks.
Of particular physiological significance are observations (e.g., Refs. 24, 37, 42, among many others) of the WSS variability between various generations of the blood vessels in vascular networks. While the WSS remains relatively constant over much of the vascular network, it increases significantly in the microcirculation, particularly in the smallest segments of the precapillary arteriolar network (24, 30, 42). This deviation from Murray's law has been attributed to the non-Newtonian shear-thinning behavior of blood in the vessels of small radii (1, 45). Murray's law fails to capture such a behavior, since it is derived by assuming blood to be a Newtonian fluid, whose flow within each vessel obeys the Poiseuille law (35). Alternative optimality criteria used to describe vascular bifurcations include the minimum energy hypothesis (24) and generalizations of Murray's law that account for the role of muscle tone (53), alternative blood rheology (1, 45), and turbulent (54) or pulsatile (37) flow conditions. These and other similar optimality criteria aim to predict the radii of daughter vessels, relying on empirical closure assumptions to prescribe partitioning of suspended red blood cells (RBCs) between daughter vessels.
Both blood viscosity and its shear-thinning behavior vary with concentrations of dissolved chemicals, e.g., fibrinogen, and density of RBCs in the blood column, i.e., hematocrit. Of direct relevance to the present study are observations suggesting that blood viscosity and shear-thinning behavior increase with hematocrit (38, 41, 44, 47). This phenomenon was ignored by Revellin et al. (45), who modified Murray's law by treating blood as an Ostwald de Waele fluid whose rheology and apparent viscosity are independent of either hematocrit or vessel radius. The latter assumptions contradict in vitro (41) and in vivo (44) observations that revealed the strong dependence of apparent viscosity on both hematocrit and vessel radius. Alarcon et al. (1) accounted for these effects by employing the Pries et al. (44) constitutive relation, according to which apparent blood viscosity varies with vessel radius and hematocrit. In applying this generalization of Murray's law to modeling a network, they assumed that hematocrits in daughter vessels at bifurcations are given by the ratio of average velocities in each daughter vessel. This leads to predictions of hematocrit values in the terminal regions of the network, which are unrealistically low (1).
The question of how hematocrit is partitioned between the parent and daughter vessels remains open. In vivo and in vitro experimental data on hematocrit partitioning at bifurcations typically relate the flux fraction FRBC, i.e., the fraction of RBCs flowing from the parent vessel into the larger daughter vessel, to the flow fraction Fblood, i.e., the fraction of total fluid flow from the parent vessel that enters the larger daughter vessel (see Ref. 4 and the references therein). Mathematical models (2, 3) of hematocrit partitioning at bifurcations are limited to two-dimensional channel flows. They suggest an approximately linear dependence of FRBC on Fblood over a wide range of Fblood. While some experimental studies (12, 16, 26, 50) observed a linear relation between FRBC and Fblood, others (22, 40, 43) found this relationship to be nonlinear. Even when the linear behavior is observed, the corresponding slopes and intercepts tend to be different. Furthermore, experimental data indicate that endothelial dysfunction significantly affects the distribution of hematocrit at arterial bifurcations with important implications for the adequacy of tissue perfusion (14, 15). Thus an analysis of baseline RBC partition at bifurcations solely dependent on network properties is warranted (17).
We propose a mathematical framework for construction of vascular networks, which possess both optimal daughter vessel radii and optimal partition of hematocrit between daughter vessels. These two goals are achieved by postulating that healthy vasculatures are constructed in a way that optimizes oxygen delivery to the surrounding tissue. Our model builds upon the analysis of Alarcon et al. (1) in the sense that it generalizes Murray's law by accounting for both the non-Newtonian nature of blood flow in microcirculation and the dependence of blood rheology on hematocrit. Unlike Alarcon et al. (1), we impose no prior restrictions on the hematocrit partition between daughter vessels. Instead it is determined by solving an optimization problem and describes how vessel bifurcations distribute RBCs in the microcirculation.
The outcome of our model is a vascular network in which both the bifurcation asymmetry and WSS vary from one generation of the network to the next. We demonstrate that the resulting vascular networks satisfy a number of properties of vascular networks identified from in vivo studies, such as nonuniform shear stress and capillary hematocrit, branching exponents, and sharply amplified pressure gradients at the terminal vessels.
PROBLEM FORMULATION
We consider blood flow in a regular vascular network composed of branching (bifurcating) vessels. Blood is treated as a non-Newtonian fluid whose apparent dynamic viscosity μ varies with a vessel radius R and the discharge hematocrit H in accordance with an empirical rheological law of Pries et al. (44)
| (1) |
Here μp is the dynamic viscosity of plasma; the dynamic viscosity of blood at hematocrit H = 0.45 is related to the vessel radius R by
| (2) |
and the exponent θ varies with the vessel radius R according to
| (3) |
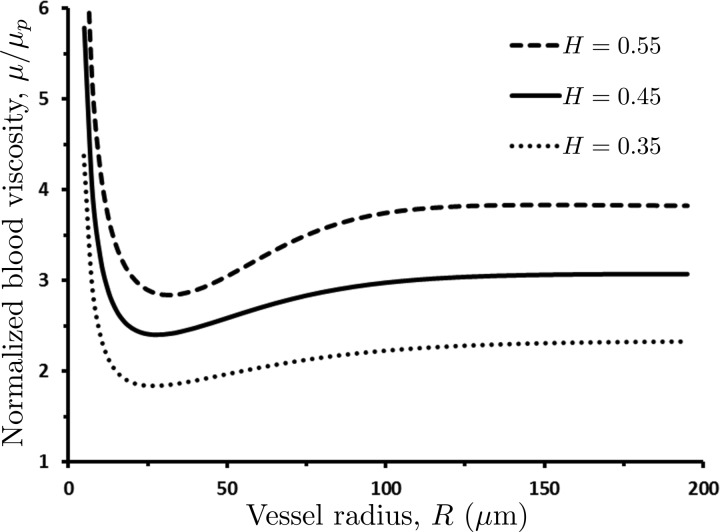
The dependence of blood viscosity μ on vessel radius R and hematocrit H is shown in Fig. 1.
Fig. 1.
Dependence of the normalized apparent blood viscosity, μ/μp, on the vessel radius R and hematocrit H predicted with the rheological law of Pries et al. (44).
Following Ref. 4, we assume flow within each vessel to be steady, laminar, and fully developed, i.e., to obey a Poiseuille-like relationship between Q (the volumetric flow rate) and J (the pressure drop over the vessel's length L),
| (4) |
In the nth generation of the network, a parent vessel of radius Rn bifurcates into smaller daughter vessels with radii Rn,1 and Rn,2. The discharge hematocrit Hn in the parent vessel partitions into the discharge hematocrits Hn,1 and Hn,2 in the corresponding daughter vessels. If the oxygen flux in a parent vessel is QO2, then mass conservation requires the oxygen fluxes in its daughter vessels to be aQO2 and (1 − a)QO2, where the flux-asymmetry parameter a is a number between 0 and 1. In the following sections, we compute the daughter vessel radii and hematocrits by postulating that daughter vessels bifurcate in a way that minimizes the total cost associated with oxygen delivery to the tissue downstream of the bifurcation.
STATE-OF-THE-ART IN VASCULATURE REPRESENTATION
Optimal vessel radius.
The starting point of our analysis is the Murray cost function (34),
| (5) |
which combines the mechanical work (QJL) necessary to drive blood through a blood vessel of radius R and length L with the “metabolic cost” (απR2L). The latter is linearly proportional to the vessel's volume πR2L with the coefficient of proportionality α. According to Murray's law, blood vessels have radii that minimize the cost function W for given flow rate Q and pressure gradient J, i.e., they satisfy an equation dW/dR = 0. Combined with Eq. 4, this defines the optimal vessel radius R* as a solution of
| (6) |
If the blood viscosity μ were independent of the vessel radius R, this equation would yield Murray's law, according to which Q is proportional to R3 (34). For the blood viscosity μ(R,H) that varies with the vessel radius R in accordance with Eq. 1, the optimal radius R* is a solution of Alarcon et al. (1)
| (7) |
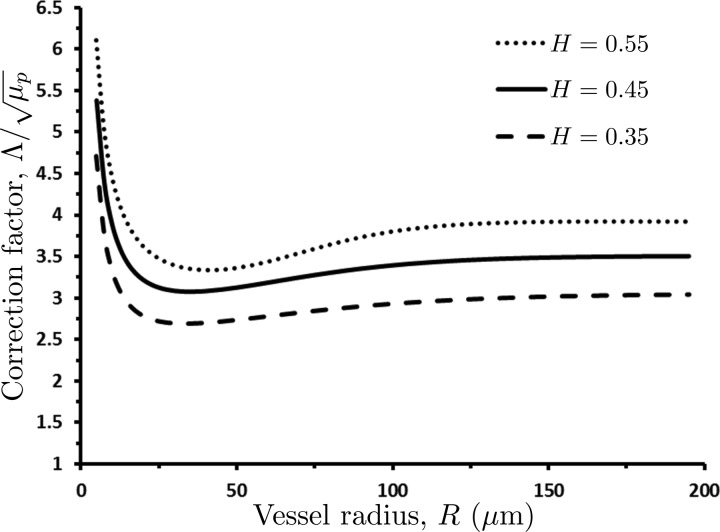
For small H and large R (larger than 200 μm), the correction factor Λ is approximately constant (Fig. 2) and Murray's law is recovered. For physiological values of hematocrit and vessel radii typically seen in the microcirculation (less than 100 μm), Λ has a strong dependence on R that is not captured by Murray's law.
Fig. 2.
Dependence of the normalized correction factor, Λ/, in the modified version (1) of Murray's law on vessel radius R and hematocrit H. For vessel radii R ≥ 200 μm and small values of hematocrit H, Λ is approximately constant and Murray's law is recovered.
Substituting the optimal Q and R* into Eq. 5 gives the optimal (minimum) cost of supplying a volume of blood to a block of tissue,
| (8) |
This analysis enables one to determine the optimal radius of a single blood vessel, if the discharge hematocrit H and the flow rate Q are known. Determining the radii of daughter vessels (and hematocrits) from a bifurcating parent vessel requires additional assumptions.
Models of vessel bifurcation.
The bifurcation of a parent vessel of radius Rn into daughter vessels with radii Rn,1 and Rn,2 is accompanied by the partitioning of the discharge hematocrit Hn in the parent vessel into the discharge hematocrits Hn,1 and Hn,2. The volumetric blood flow rates in the parent (Qn) and daughter (Qn,1 and Qn,2) vessels satisfy mass conservation,
| (9) |
Mass conservation of red blood cells imposes a constraint on the discharge hematocrits in the parent parent (Qn) and daughter (Qn,1 and Qn,2) vessels,
| (10) |
The volumetric flow rates in each vessel are given by the modified Murray's law (Eq. 7)
| (11) |
Substituting Eq. 11 into Eqs. 9 and 10 yields
| (12a) |
and
| (12b) |
Since these two equations contain four unknowns (Rn,1, Rn,2, Hn,1, and Hn,2), the determination of the optimal bifurcation radii requires additional assumptions. For example, one can postulate that the daughter vessels have identical radii, Rn,1 = Rn,2 ≡ Rn,d (i.e., Qn,1 = Qn,2 = Qn/2), and assume that the discharge hematocrit in all the vessels is the same, Hn = Hn,1 = Hn,2 ≡ H. This model implies that the discharge hematocrit remains constant throughout the vascular network and relates the daughter-vessel radius to the radius of its parent by an implicit relation 2Rn,d3 / Λ(Rn,d,H) = Rn3/Λ(Rn,H). Unfortunately symmetrically bifurcating networks are not representative of typical vasculatures.
The construction of asymmetrically bifurcating vascular networks relies on Eqs. 12a and 12b, supplemented with the following two assumptions. First, one assumes the ratio of the two daughter-vessel radii, Rn,1/Rn,2, to be known (1, 24, 36). Second, one postulates a constitutive relation that governs the partition of discharge hematocrit between the two daughter vessels (1). The shortcomings of the latter assumption are discussed in the introduction.
BIFURCATIONS OPTIMIZED FOR OXYGEN DELIVERY
We posit that biological vascular networks are structured in a way that maximizes their ability to deliver oxygen. Specifically, we postulate that 1) asymmetric bifurcations occur because the volumes of tissue downstream of each daughter vessel have different oxygen needs; 2) these needs are quantified by a known constant a (0 < a < 1), which serves to partition the oxygen flux QO2 in any given parent vessel into the oxygen fluxes aQO2 and (1 − a)QO2 in its two daughter vessels; 3) an optimal bifurcation is one in which the oxygen demands of each downstream tissue volume are supplied at a “minimal total cost”; and 4) the amount of oxygen transported through a blood vessel is proportional to the number of RBCs flowing through that vessel (51), i.e., the oxygen flux is given by QO2 = ρQnHn, where the constant ρ denotes the amount of oxygen transported by a unit volume of RBCs. The value of a depends on the physiology of the downstream volumes of tissue supplied by each daughter vessel (symmetric bifurcations imply that these volumes are identical, so that a = 0.5).
If the oxygen flux in the nth vessel is QO2, then the oxygen fluxes in the two daughter vessels are aQO2 = ρQn,1Hn,1 and (1 − a)QO2 = ρQn,2Hn,2. It follows from Eq. 11 that the oxygen flux in the nth vessel,
| (13) |
partitions into the oxygen fluxes in its two daughter vessels, aQO2 and (1 − a)QO2, according to
| (14) |
A constraint on the hematocrit partitioning between the two daughter vessels is obtained by substituting Qn = QO2/(ρHn), Qn,1 = aQO2/(ρHn,1), and Qn,2 = (1 − a)QO2/(ρHn,2) into Eq. 9, which yields
| (15) |
Three Eqs. 14 and 15 contain four unknowns (Rn,1, Rn,2, Hn,1, Hn,2). The fourth equation needed to close this system is obtained by assuming that vascular networks are formed in a way that minimizes the work necessary to distribute oxygen throughout the vasculature. The cumulative work of forcing the blood through the two daughter vessels of the nth parent vessel is computed from Eq. 5 as W = (Qn,1Jn,1Ln,1 + απRn,12Ln,1) + (Qn,2Jn,2Ln,2 + απRn,22Ln,2) where Ln,1 and Ln,2 are the (yet unknown) lengths of the daughter vessels. By analogy with Eq. 8, for any given partitioning of the hematocrit the minimum Murray's work has the form
| (16) |
The optimal hematocrit partitioning minimizes the total work in Eq. 16, giving rise to a fourth equation,
| (17) |
where Eq. 15 is used to express Hn,2 in terms of Hn,1.
The system of Eqs. 14, 15, and 17 remains unclosed due to the presence of two additional unknowns: the daughter vessel lengths Ln,1 and Ln,2. These are often related to the corresponding vessel radii Rn,1 and Rn,2, e.g., by assuming the radius-to-length ratio Rn,1/Ln,1 = Rn,2/Ln,2 to be constant throughout the vascular network (i.e., for any n) (10, 11, 24, 36). This assumption is supported by in vivo morphological studies of arterial trees (19, 32). Rather than forcing the radius-to-length ratio to be constant, we supplement the four postulates listed above with the following hypothesis: 5) a blood vessel's volume, πR2L, is linearly proportional to the volume of tissue it oxygenates.
We show in the appendix that this assumption leads to a radius-to-length relationship,
| (18) |
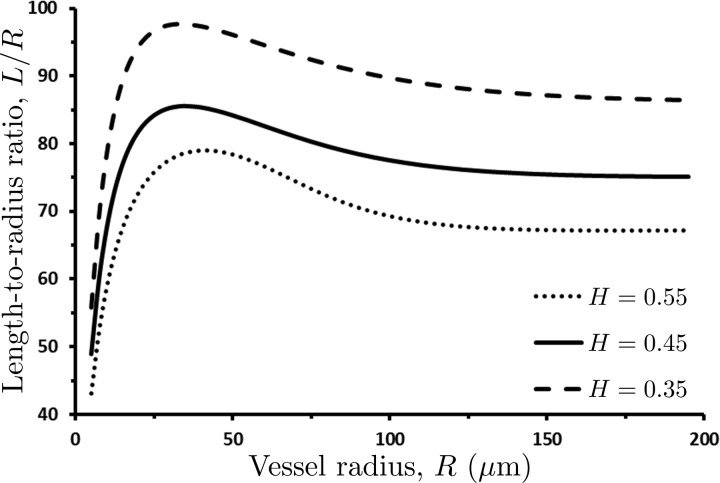
where κ is a constant model parameter. Setting κ = 650 in Eq. 18 results in the L/R ratios between 50 and 100 depending on the value of discharge hematocrit H (Fig. 3), which falls within the range of the reported length-to-radius ratios (10, 19, 24, 36). Figure 3 reveals that in blood vessels with R > 150 μm, the length-radius ratios do become constant, with their value decreasing with hematocrit H. This leads us to conclude that the length-to-radius ratio (L/R) may be assumed constant over the bulk of a vascular tree, with deviations from its constant value occurring in small, precapillary arterioles.
Fig. 3.
Variation of length-to-radius ratio L/R with vessel radius R, for several values of discharge hematocrit H. The length-to-radius ratio L/R may be assumed constant over the bulk of a vascular tree, with deviations from its constant value occurring in small, precapillary arterioles.
Given values of the discharge hematocrit Hn and the oxygen flux QO2 in the parent vessel n and its radius Rn, the radii (Rn,1 and Rn,2) and lengths (Ln,1 and Ln,2) of, and the hematocrits (Hn,1 and Hn,2) in, the bifurcating daughter vessels are uniquely determined by the system of nonlinear Eqs. 14, 15, 17, and 18.
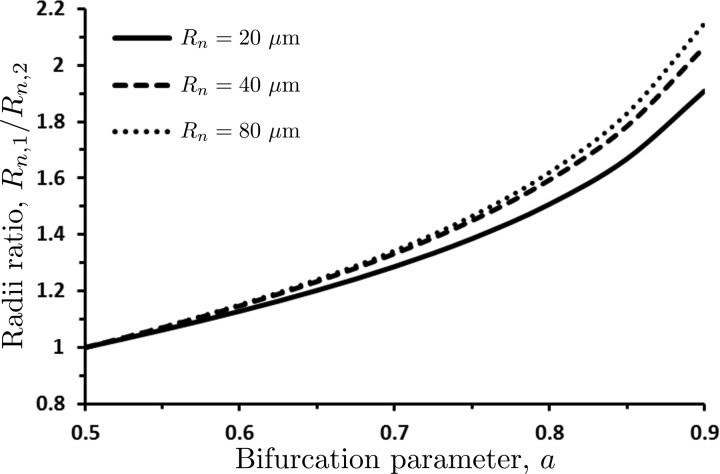
The radii of the daughter vessels, Rn,1 and Rn,2, predicted with our model are reported in Fig. 4 in terms of their ratio Rn,1/Rn,2. The symmetric bifurcation (Rn,1 = Rn,2) occurs when the bifurcation parameter a = 0.5. The values 0.5 < a < 1.0 result in Rn,1 > Rn,2, while values 0 < a < 0.5 (not shown in Fig. 4) yield Rn,1 < Rn,2. The bifurcation asymmetry increases with the parent vessel's radius Rn, as long as Rn ≤ 80 μm. After that threshold the ratio Rn,1/Rn,2 is independent of Rn, so that the curves Rn,1/Rn,2 vs. a overlap with that for Rn = 80 μm.
Fig. 4.
Ratio Rn,1/Rn,2 of the radii of the two daughter vessels as a function of the bifurcation parameter a for several values of the parent vessel radius Rn and hematocrit Hn = 0.45. The symmetric bifurcation (Rn,1 = Rn,2) occurs when the bifurcation parameter a = 0.5.
Figure 5 shows the partitioning of hematocrit Hn = 0.45 in the parent vessel into hematocrits Hn,1 and Hn,2 in the daughter vessels for several values of the parent vessel radius Rn and the bifurcation parameter a. While hematocrit in the larger daughter vessel (Hn,1) is nearly the same as hematocrit in the parent vessel (Hn), hematocrit in the smaller daughter vessel (Hn,2) is significantly different from Hn. This is consistent with the observations reported in Refs. 12, 16, and 22 and supports the idea that discharge hematocrit at the bifurcation partitions in a way that minimizes the work necessary to induce blood flow in microcirculation.
Fig. 5.
Partitioning of hematocrit Hn = 0.45 in the parent vessel into hematocrits Hn,1 and Hn,2 in the daughter vessels as a function of the bifurcation parameter a, for the parent vessel radius Rn = 20 μm (A), Rn = 40 μm (B), and Rn = 80 μm (C). The symmetric bifurcation (a = 0.5) results in the uniform hematocrit in all three vessels, Hn = Hn,1 = Hn,2 = 0.45.
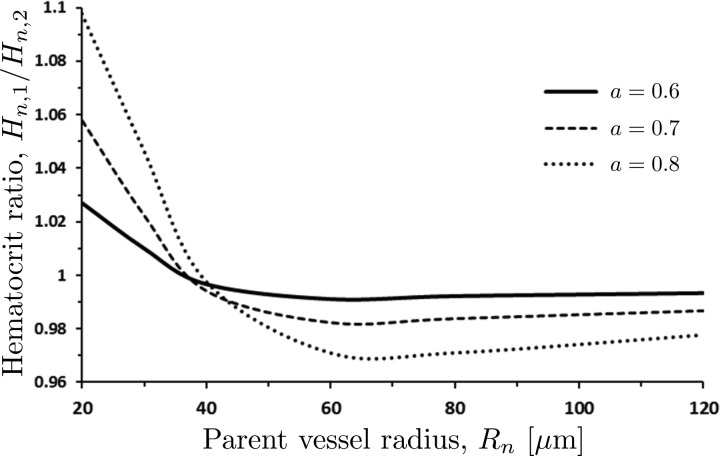
Dependence of the hematocrit ratio Hn,1/Hn,2 on the parent vessel radius Rn is elucidated further in Fig. 6. Bifurcations of parent vessels with Rn < 40 μm result in the hematocrit ratios Hn,1/Hn,2 > 1, i.e., hematocrit in the larger daughter vessel exceeds hematocrit in the smaller daughter vessel. The situation is reversed in parent vessels with Rn > 40 μm, which yield Hn,1/Hn,2 < 1. As Rn increases, the hematocrit ratio Hn,1/Hn,2 asymptotically tends to 1. The inflection point of the Hn,1/Hn,2 vs. Rn curves corresponds to the inflection point in the relationship between the apparent viscosity and vessel radius in Fig. 1.
Fig. 6.
Ratio Hn,1/Hn,2 of the hematocrits the two daughter vessels as a function of the parent vessel radius Rn for several values of the bifurcation parameter a and hematocrit Hn = 0.45. Bifurcations of large vessels (Rn > 200 μm) preserves the hematocrit Hn, i.e., Hn = Hn,1 = Hn,2.
Experimental data on flow behavior at vessel bifurcations are typically reported in terms of the RBC flux fraction FRBC and the blood flow fraction Fblood (12, 16, 40, 50). These are defined as
| (19) |
Our model predicts the RBC flux fraction FRBC to vary linearly with the flow fraction Fblood (Fig. 7), in agreement with the results reported in Refs. 12, 16, 50 but disputed by others (22, 40, 43). Our model also indicates that the relationship between FRBC and Fblood is relatively insensitive to Rn and Hn. Moreover, Fig. 7 suggests that FRBC ≈ Fblood for all cases which, combined with Eq. 19, implies that Hn,1 is within a few percent of Hn (see also Figs. 5 and 6). However, the analysis in the section below demonstrates that these small differences in hematocrit cannot be neglected since they accumulate from one generation of vessels to the next, resulting in large intravessel variability of hematocrit in terminal sections of the vascular network.
Fig. 7.
Dependence of the red blood cell (RBC) flux fraction FRBC on the blood flow fraction Fblood, for several values of the parent vessel radius Rn (with Hn = 0.45) and several values of parent vessel hematocrit Hn (with Rn = 20 μm).
RESULTS
Comparison with Murray's law.
The radii of the daughter vessels are but one metric by which to compare the vascular networks predicted with our model and that given by Murray's law; while the former requires one to solve a system of nonlinear Eqs. 14, 15, 17, and 18 in order to obtain these radii, the latter is given by a closed-form relation Rn3 = Rn,13 + Rn,23. Other metrics include the distributions of pressure P and WSS τ throughout the vascular network.
According to our model, the WSS τn ≡ JnRn/2 in an nth generation vessel is computed from Eqs. 4 and 7 as
| (20) |
Since J = ΔP/L, it follows from Eqs. 4, 7, and 18 that the pressure drop ΔP across a vessel of length L is given by ΔP = 4κπ2√αHμ/Λ2. Let us suppose that a vascular network consists of N generations of vessels, and ends in the capillary bed where the blood pressure is Pcap. Then intraluminal pressure Pn at the start of an nth generation vessel is
| (21) |
A vascular network that obeys Murray's law has the constant length-to-radius ratio ε = Ln/Rn and the bifurcation relation Rn3 = Rn,13 + Rn,23 for all n ≤ N. Murray (34, 35) and subsequent studies (49) treat the viscosity of blood, μM, flowing through such a network as constant. Under these assumptions, Eqs. 4 and 7 predict the WSS τM that is constant throughout the vasculature,
| (22) |
and the intraluminal pressure PnM in an nth generation vessel that is given by
| (23) |
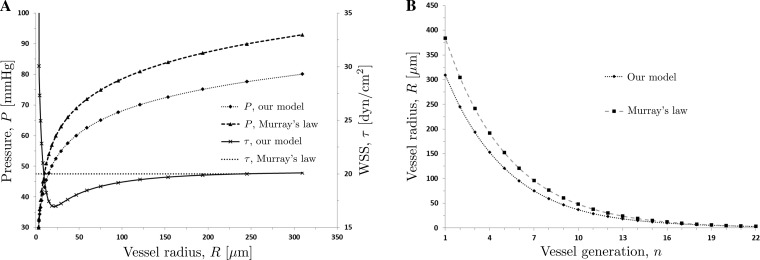
In the simulations reported in Fig. 8, we consider a symmetrically bifurcating network (a = 0.5 or Rn,1 = Rn,2 for all n ≤ N) that consists of N = 22 generations, terminating with capillaries of radius RN = 3.0 μm. The capillary pressure is set to Pcap = 30.0 mmHg (9). To facilitate the comparison between the two models, we chose the value of the constant blood viscosity μM in the Murray model to coincide with the asymptotic value of μ(R,H), which corresponds to large vessel radii. Setting H = 0.45 and R = 1,000.0 μm, this gives μM = 3.198 cP.
Fig. 8.
Distributions of vessel radii R (B) and intraluminal pressure P and WSS τ (A) predicted with our model and the model based on Murray's law.
The vessel radii of the vascular networks reconstructed with the two models are shown in Fig. 8B. The difference between the two predictions exceeds 20% for the larger vessels (early generations of the network). The predicted distributions of the WSS τ (Fig. 8A) highlight the physiological differences between the two models. While Murray's law implies a constant WSS τM across the entire network (37), our model captures the experimentally observed variability in the WSS τ between the vessels of different generations. Specifically, it predicts the amplification of the WSS in the microcirculation (vessel radii R < 25 μm), wherein the WSS appreciably increases as the vessel radii R become smaller (the vessel generation n becomes larger), reaching its maximum in the terminal, precapillary arterioles. This behavior is in agreement with the observed amplification of WSS in the microcirculation (24, 30, 31, 42). In larger vessels (R > 25 μm), the WSS increases by a small amount with R, reaching a constant value in large arterioles. This is in general agreement with the observations reported in Refs. 42 and 52.
Both models predict that the intraluminal blood pressure P increases with vessel radius R, with the bulk of the pressure drop occurring in the smaller vessels (Fig. 8A). As R approaches the values typical of large arterioles and small arteries, blood pressure in these vessels becomes almost equal to systemic arterial pressure. This indicates that the smaller arterioles contribute most to vascular resistance. These small vessels are often referred to as “resistance vessels.” The predicted dependence of intraluminal pressure P vessel radius R is in qualitative agreement with the observations (9, 30, 42).
Impact of branching asymmetry.
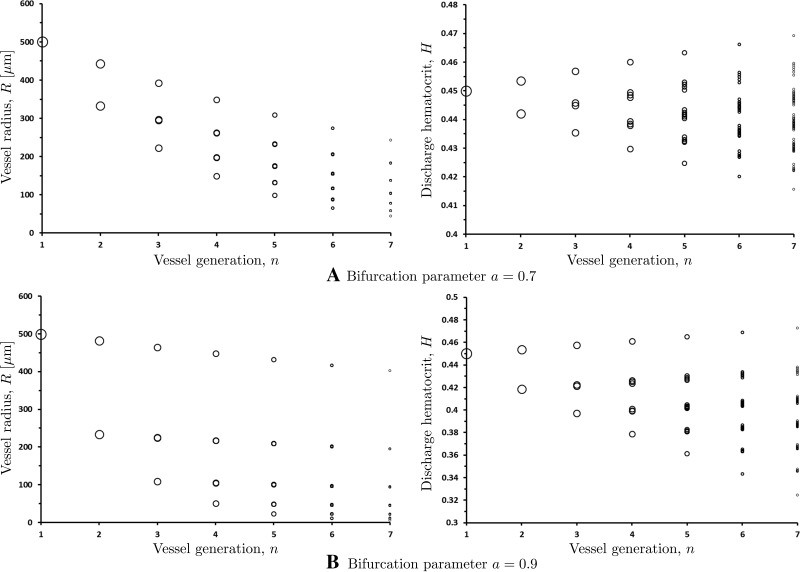
The results presented in Fig. 8 are obtained for a symmetric vascular network (the bifurcation parameter a = 0.5). Figure 9 demonstrates the effect of network asymmetry on the distributions of vessel radii and hematocrit throughout the networks with a = 0.7 and a = 0.9. The largest vessel in these simulations has radius R1 = 500.0 μm and hematocrit H1 = 0.45. Each branch of the network is assumed to terminate once daughter vessel radius reaches R = 3.0 μm, corresponding to termination of the arteriolar network, which feeds the capillary bed. The network asymmetry (a ≠ 0.5) causes the number of vessels in each branch to vary. This implies that asymmetric vascular networks defy idealized fractal descriptions, which is in line with several in vivo studies (20, 24, 26, 36, 39). Only the first seven generations of the vessels (i.e., before any branch reaches the R = 3.0 μm threshold) are shown in Fig. 9, with each circle representing a blood vessel with the radius R or hematocrit H at a given vessel generation n. Note that the number of bifurcating vessels in each generation increases as 2n−1, which might not be apparent in Fig. 9 since many of the data points overlap.
Fig. 9.
Variation of vessel radii R and discharge hematocrit H within the first n = 7 generations of asymmetric vascular networks with bifurcation parameters a = 0.7 and a = 0.9.
Our model predicts a large variability of hematocrit values across the vessels of the same generation (Fig. 9), including at the terminal regions of the network and in the capillary beds supplied by these terminal branches. This finding is supported by the in vivo measurements in capillary beds (20, 26, 39) that show large variations of observed hematocrit values across capillary beds, even among vessels of similar diameters. Our model accounts for this effect by allowing for the asymmetric partitioning of hematocrit at every bifurcating vessel.
A measure of the deviation of vascular network from Murray's law is provided by a network branching exponent ξ defined such that
| (24) |
Murray's law states that the sum of powers of all the vessel radii in the nth generation must equal to the sum of the powers of all the vessel radii in the (n + 1)-th generation, and sets ξ = 3. Reported values of ξ range from 2.7 to 3 (10, 27, 28, 33, 36, 46), which suggests small but meaningful deviations from Murray's law. For the networks presented in Fig. 9, Eq. 24 holds across all generations with ξ = 2.96 for a = 0.7 and ξ = 2.97 for a = 0.9. These values are within 1% of the values reported in Refs. 27 and 33.
Model validation.
The vascular networks constructed with using our model exhibit the following characteristics observed in a number of in vivo and in vitro studies. 1) RBC flux fraction FRBC at bifurcations varies approximately linearly with the blood flow fraction Fblood over a broad range of hematocrits and vessel radii. This is in agreement with the data reported in Refs. 3, 12, 16, and 50. 2) The asymmetry in discharge hematocrit at asymmetric bifurcations increases with the degree of asymmetry. This is in agreement with the data reported in Refs. 12, 16, and 22. 3) WSS is nonuniform in the microcirculation, significantly increasing in the terminal sections of the network. This is in agreement with the data reported in Refs. 24, 30, 31, 37, and 42. 4) Pressure gradients increase sharply in the terminal sections of the network. This is in agreement with the data reported in Refs. 9 and 30. 5) Both the hematocrit partitioning at vessel bifurcations and hematocrit across the capillary bed in asymmetric networks is nonuniform. This is in agreement with the data reported in Refs. 20, 26, and 39. 6) Microvascular discharge hematocrit is comparable (within 10–20%) to the macrocirculatory systemic hematocrit (see Fig. 9 for a = 0.7). This is in qualitative agreement with the direct measurements of discharge hematocrit (13) that observed analogous results, albeit with a significant amount of scatter. 7) Predicted values of the branching exponent ξ fall within the range of their measured counterparts (27, 28, 33, 46).
Inverse modeling of vascular networks.
The modeling framework described above treated the bifurcation parameter a as an input in order to construct a vascular network, e.g., to identify the ratio of the radii of daughter vessels Rn,1/Rn,2. A problem with such “forward modeling” is that the model parameter a, which determines the hematocrit partitioning at bifurcations, is harder to measure than the model output Rn,1/Rn,2, which is more readily measured in morphometric studies (10, 21, 24, 32, 33, 36). The goal of “inverse modeling” is to infer the bifurcation parameter a from measurements of the parent vessel radius Rn, the ratio of the daughter vessel radii Rn,1/Rn,2 and the hematocrit Hn in the nth parent vessel.
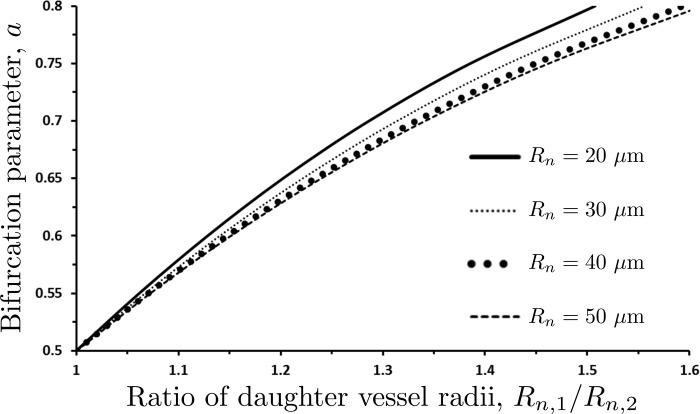
This goal is facilitated by the one-to-one relationship between the bifurcation parameter a and the daughter vessel radii Rn,1/Rn,2, for any given value of Rn and Hn (Fig. 10). This figure is constructed by running our forward model for multiple values of a, while keeping the values of Rn and Hn fixed. The four curves in Fig. 10 correspond to Hn = 0.45 and four values of the parent vessel radius Rn. We found these curves to be essentially independent of Hn over a physiologically relevant range of its values. The dependence of a on the radii ratio Rn,1/Rn,2 in Fig. 10 is fitted with a second-degree polynomial
| (25a) |
The fitting coefficients ca0, ca1, and ca2 vary with the parent vessel radius Rn, such that
| (25b) |
and
| (25c) |
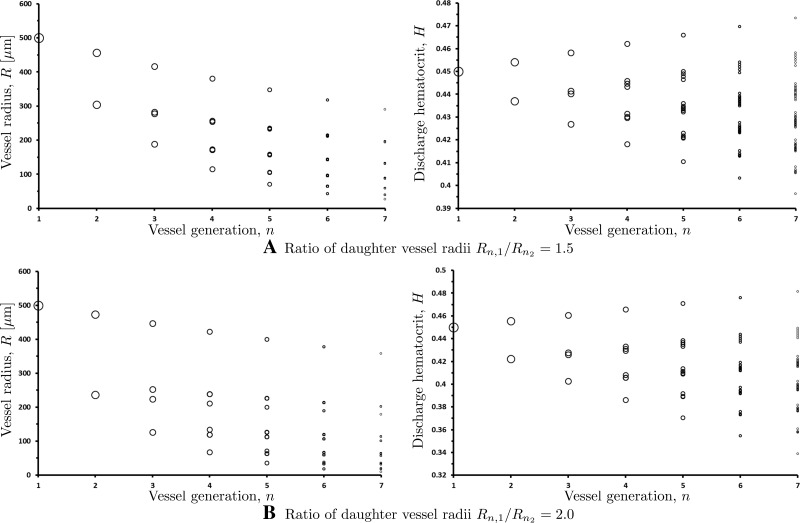
Figure 10 enables one to infer a value of the bifurcation parameter a from a measurement (or the average of multiple measurements) of the ratio of daughter vessel radii Rn,1/Rn,2. Then one can use our model to reconstruct the whole vascular network. Examples of such reconstructions are shown in Fig. 11. Large degrees of asymmetry imply large spreads of discharge hematocrits and vessel radii across a given generation of vessels.
Fig. 10.
Variation of the bifurcation parameter a with the ratio of daughter vessel radii Rn,1/Rn,2 for several values of the parent vessel radius Rn.
Fig. 11.
Variation of vessel radii and discharge hematocrit from one generation to the next for Rn,1/Rn,2 = 1.5 (top panels) and Rn,1/Rn,2 = 2.0 (bottom panels).
DISCUSSION AND CONCLUSIONS
We proposed a new approach for simulation of vascular networks. Our method follows the foundation premise of Murray's law (34) in postulating the existence of functional optimality of such networks. The optimality criterion adopted in our approach is the physiological cost of supplying oxygen to the tissue surrounding a blood vessel. Bifurcation asymmetry is expressed in terms of the amount of oxygen consumption associated with the respective tissue volumes being supplied by each daughter vessel. Similar to Ref. 1, our approach accounts for the non-Newtonian behavior of blood by allowing the apparent blood viscosity to vary with discharge hematocrit and vessel radius in accordance with Ref. 44.
Our approach to network reconstruction offers significant advantages over Murray's law. Chief among them is its ability to capture the observed variability of WSS in the microcirculation. Our model predicts the sharp amplification of WSS in the smallest vessels of a network (R < 50.0 μm), which is consistent with in vivo observations (25, 30, 38, 42). WSS in intermediate vessels gradually increases with vessel radius, before reaching a constant value at large vessel radii (R > 200.0 μm). This WSS variability is absent in networks reconstructed with Murray's law, which exhibit constant WSS throughout the vasculature.
The proposed approach captures both the asymmetric partitioning of hematocrit at vessel bifurcations and its effects on hematocrit variability in the terminal vessels of vascular networks. It provides theoretical support for the experimentally observed linear relationship between the RBC flux fraction and the blood flow fraction (3, 12, 16, 50), and for the in vivo observations of pronounced variability of hematocrit in capillary beds (20, 26, 39). The high-precision measurements reported in Ref. 48 suggest that this linear relationship is a result of averaging over multiple observations. To account for the scatter in the observed RBC distributions at various vessel bifurcations, one can treat the bifurcation parameter a as a random (e.g., Gaussian) variable whose realizations are assigned either to every bifurcation in the network or to all bifurcations of the same level.
Microvascular dispersion of hematocrit due to the asymmetric branching has important physiological implications. The variability of discharge hematocrit at bifurcation is cumulative, leading to the presence of capillaries with hematocrits higher than systemic, while the average capillary hematocrit is generally half of the systemic value (29). The literature refers to these high-hematocrit vessels as shunts or thoroughfare channels; they were proposed to arise from the distribution of RBCs at capillary bifurcations where they concentrate in the branch with the greater velocity (18, 23). Our analysis provides an alternative explanation: the location of these red blood cell shunts is determined by the nature of the preceding bifurcations. Therefore the microcirculation appears to be designed so that the asymmetry of bifurcations generates capillary vessels that act as RBC shunts between the arterial and venous circulatory compartments.
If the presence of shunts is indeed a consequence of properties of the capillary network, then their functional properties are difficult to control extrinsically since the mechanisms that control capillary flow within the capillary network are limited. Conversely, if the function of these shunts is regulated already at the arteriolar level, it can be controlled by the many interventions that influence arteriolar function. These findings may help in designing treatment strategies in clinical conditions of organ hypoxia and capillary ischemia wherein local blood flow is normal or even increased related to the malfunction of microvascular regulation (7, 8, 14, 15).
GRANTS
This research was supported in part by contract from United States Army Medical Research Acquisition Activity (W81XWH1120012) (A. G. Tsai) and by National Heart, Lung, and Blood Institute Grant 5P01-HL-110900 (J. M. Friedman).
DISCLOSURES
No conflicts of interest, financial or otherwise, are declared by the author(s).
AUTHOR CONTRIBUTIONS
Author contributions: K.S. and D.M.T. conception and design of research; K.S. prepared figures; K.S. drafted manuscript; K.S., M.I., and D.M.T. edited and revised manuscript; K.S., M.I., and D.M.T. approved final version of manuscript; D.M.T. analyzed data.
Glossary
- Qn, Qn,1, Qn,2
Flow rate in parent vessel and two daughter vessels
- Hn, Hn,1, Hn,2
Discharge hematocrit in parent vessel and two daughter vessels
- Rn, Rn,1, Rn,2
Radii of parent vessel and two daughter vessels
- μ
Blood viscosity
- μp
Plasma viscosity
- QO2
Oxygen flux
- a
Flux asymmetry parameter
- W
Cost function
- L
Vessel length
- τ
Wall shear stress (WSS)
- J
Pressure gradient
- P
Intraluminal pressure
Appendix
The premise of Murray's law is that a blood vessel's volume is determined by a compromise between minimizing the vessel's resistance to blood flow and minimizing the total volume of blood needed to serve the body's metabolic needs (5, 49, 56). The latter condition is equivalent to positing that a blood vessel supplying a given oxygen flux QO2 = QH (i.e., blood flow rate Q at a constant hematocrit H) to the surrounding tissue has an optimal volume at which this compromise between minimizing resistance to flow and minimizing vessel volume is met. This implies an “optimal” vessel volume (and since the vessel is filled with blood, an optimal volume of blood) for a given tissue volume. (The existence of an optimal blood volume has been suggested in Refs. 6 and 51.) In other words, the volume of the tissue oxygenated by a vessel is related to both the vessel volume πR2L and the oxygen flux QH supplied by the vessel. We assume the linear relationships, V ∝ πR2L and V ∝ QH, which gives
| (26) |
Substituting the flow rate Q predicted by the modified Murray's law in Eq. 7, we obtain R2L ∝ R3H/Λ. This is equivalent to LΛ/(HR) = κ, where κ is a constant of proportionality, which leads to Eq. 18.
As an aside, we note that V ∝ πR2L implies that the ratio of the vessel volume and the volume of the surrounding tissue it oxygenates are constant throughout a vascular network. Since the oxygen flux QO2 = QH is conserved from one vessel generation to the next (due to conservation of mass), the assumption that V ∝ πR2L ∝ QH for each generation of vessels implies that the vascular network is volume preserving (i.e., each successive generation of blood vessels has the same total volume as the preceding generation). This implies that any given tissue volume at any length scale (larger than the length of a capillary) will have a fixed volume fraction that is occupied by blood vessels. The assumption of a volume preserving network has previously been used in studies on scaling in biological systems (55).
REFERENCES
- 1.Alarcon T, Byrne HM, Maini PK. A design principle for vascular beds: the effects of complex blood rheology. Microvasc Res 69: 156–172, 2005. [DOI] [PubMed] [Google Scholar]
- 2.Barber JO, Alberding JP, Restrepo JM, Secomb TW. Simulated two-dimensional red blood cell motion, deformation, and partitioning in microvessel bifurcations. Ann Biomed Eng 36: 1690–1698, 2008. [DOI] [PMC free article] [PubMed] [Google Scholar]
- 3.Barber JO, Restrepo JM, Secomb TW. Simulated red blood cell motion in microvessel bifurcations: effects of cell-cell interactions on cell partitioning. Cardiovasc Eng Tech 2: 349–360, 2011. [DOI] [PMC free article] [PubMed] [Google Scholar]
- 4.Baskurt OK, Hardeman MR, Rampling MW, Meiselman HJ. (Ed.). Handbook of Hemorheology and Hemodynamics. IOS, 2005 (vol. 69 of Biomed Health Res). [Google Scholar]
- 5.Bejan A, Rocha LA, Lorente S. Thermodynamic optimization of geometry: T-and Y-shaped constructs of fluid streams. Int J Therm Sci 39: 949–960, 2000. [Google Scholar]
- 6.Birchard GF. Optimal hematocrit: theory, regulation and implications. Am Zool 37: 65–72, 1997. [Google Scholar]
- 7.Boulton AJ, Scarpello JH, Ward JD. Venous oxygenation in the diabetic neuropathic foot: evidence of arteriovenous shunting? Diabetologia 22: 6–8, 1982. [DOI] [PubMed] [Google Scholar]
- 8.Cameron NE, Cotte MA. The relationship of vascular changes to metabolic factors in diabetes mellitus and their role in the development of peripheral nerve complications. Diabetes Metab Rev 10: 189–224, 1994. [DOI] [PubMed] [Google Scholar]
- 9.Chilian WM, Layne SM, Klausner EC, Eastham CL, Marcus ML. Redistribution of coronary microvascular resistance produced by dipyridamole. Am J Physiol Heart Circ Physiol 256: H383–H390, 1989. [DOI] [PubMed] [Google Scholar]
- 10.Cousins W, Gremaud PA. Boundary conditions for hemodynamics: the structured tree revisited. J Comput Phys 231: 6086–6096, 2012. [Google Scholar]
- 11.Cousins W, Gremaud PA, Tartakovsky DM. A new physiological boundary condition for hemodynamics. SIAM J Appl Math 73: 1203–1223, 2013. [Google Scholar]
- 12.Dellimore JW, Dunlop MJ, Canham PB. Ratio of cells and plasma in blood flowing past branches in small plastic channels. Am J Physiol Heart Circ Physiol 244: H635–H643, 1983. [DOI] [PubMed] [Google Scholar]
- 13.Desjardins C, Duling BR. Microvessel hematocrit: measurement and implications for capillary oxygen transport. Am J Physiol Heart Circ Physiol 252: H494–H503, 1987. [DOI] [PubMed] [Google Scholar]
- 14.Edmonds ME, Roberts VC, Watkins JP. Blood flow in the diabetic neuropathic foot. Diabetologia 22: 9–15, 1982. [DOI] [PubMed] [Google Scholar]
- 15.Fagrell B, Jörneskog G, Intaglietta M. Disturbed microvascular reactivity and shunting- a major cause for diabetic complications. Vasc Med 4: 125–127, 1999. [DOI] [PubMed] [Google Scholar]
- 16.Fenton BM, Carr RT, Cokelet GR. Nonuniform red cell distribution in 20 to 100 micrometers bifurcations. Microvasc Res 29: 103–126, 1985. [DOI] [PubMed] [Google Scholar]
- 17.Frisbee JC, Wu F, Goodwill AG, Butcher JT, Beard DA. Spatial heterogeneity in skeletal muscle microvascular blood flow distribution is increased in the metabolic syndrome. Am J Physiol Regul Integr Comp Physiol 301: R975–R986, 2011. [DOI] [PMC free article] [PubMed] [Google Scholar]
- 18.Fung YC. Stochastic flow in capillary blood vessels. Microvasc Res 5: 34–48, 1973. [DOI] [PubMed] [Google Scholar]
- 19.Hahn HK, Georg M, Peitgen HO. Fractal aspects of three-dimensional vascular constructive optimization. In: Fractals in Biology and Medicine, Basel: Birkhauser, 2005, p. 55–66. [Google Scholar]
- 20.House SD, Lipowsky HH. Microvascular hematocrit and red cell flux in rat cremaster muscle. Am J Physiol Heart Circ Physiol 252: H211–H222, 1987. [DOI] [PubMed] [Google Scholar]
- 21.Iberall AS. Anatomy and steady flow characteristics of the arterial system with an introduction to its pulsatile characteristics. Math Biosci 1: 375–395, 1967. [PubMed] [Google Scholar]
- 22.Jaggi RD, Sandoz R, Effenhauser CS. Microfluidic depletion of red blood cells from whole blood in high-aspect-ratio microchannels. Microfluid Nanofluid 3: 47–53, 2007. [Google Scholar]
- 23.Kanzow G, Pries AR, Gaehtgens P. Analysis of the hematocrit distribution in the mesenteric microcirculation. Int J Microcirc Clin Exp 1: 67–79, 1982. [PubMed] [Google Scholar]
- 24.Kassab GS, Navia JA. Biomechanical considerations in the design of graft: the homeostasis hypothesis. Annu Rev Biomed Eng 8: 499–535, 2006. [DOI] [PubMed] [Google Scholar]
- 25.Kassab GS. Scaling laws of vascular trees: of form and function. Am J Physiol Heart Circ Physiol 290: H894–H903, 2006. [DOI] [PubMed] [Google Scholar]
- 26.Klitzman B, Johnson PC. Capillary network geometry and red cell distribution in hamster cremaster muscle. Am J Physiol Heart Circ Physiol 242: H211–H219, 1982. [DOI] [PubMed] [Google Scholar]
- 27.Kobari M, Gotoh F, Fukuuchi Y, Tanaka K, Suzuki N, Uematsu D. Blood flow velocity in the pial arteries of cats, with particular reference to the vessel diameter. J Cereb Blood Flow Metab 4: 110–114, 1984. [DOI] [PubMed] [Google Scholar]
- 28.LaBarbera M. Principles of design of fluid transport systems in zoology. Science 249: 992–1000, 1990. [DOI] [PubMed] [Google Scholar]
- 29.Lipowsky HH, Firrell JC. Microvascular hemodynamics during systemic hemodilution and hemoconcentration. Am J Physiol Heart Circ Physiol 250: H908–H922, 1986. [DOI] [PubMed] [Google Scholar]
- 30.Lipowsky HH, Kovalcheck S, Zweifach BW. The distribution of blood rheological parameters in the microvasculature of cat mesentery. Circ Res 43: 738–749, 1978. [DOI] [PubMed] [Google Scholar]
- 31.Lipowsky HH, Zweifach BW. Network analysis of microcirculation of cat mesentery. Microvasc Res 7: 73–83, 1974. [DOI] [PubMed] [Google Scholar]
- 32.Masters BR. Fractal analysis of the vascular tree in the human retina. Annu Rev Biomed Eng 6: 427–452, 2004. [DOI] [PubMed] [Google Scholar]
- 33.Mayrovitz HN, Roy J. Microvascular blood flow: evidence indicating a cubic dependence on arteriolar diameter. Am J Physiol Heart Circ Physiol 245: H1031–H1038, 1983. [DOI] [PubMed] [Google Scholar]
- 34.Murray CD. The physiological principle of minimum work applied to the angle of branching of arteries. J Gen Physiol 9: 835–841, 1926. [DOI] [PMC free article] [PubMed] [Google Scholar]
- 35.Murray CD. The physiological principle of minimum work. I. The vascular system and the cost of blood volume. Proc Natl Acad Sci USA 12: 207–214, 1926. [DOI] [PMC free article] [PubMed] [Google Scholar]
- 36.Olufsen MS. Structured tree outflow condition for blood flow in larger systemic arteries. Am J Physiol Heart Circ Physiol 276: H257–H268, 1999. [DOI] [PubMed] [Google Scholar]
- 37.Popel AS, Johnson PC. Microcirculation and hemorheology. Annu Rev Fluid Mech 37: 43–69, 2005. [DOI] [PMC free article] [PubMed] [Google Scholar]
- 38.Painter PR, Eden P, Bengtsson H. Pulsatile blood flow, shear force, energy dissipation and Murray's law. Theor Biol Medical Model 3: 31, 2006. [DOI] [PMC free article] [PubMed] [Google Scholar]
- 39.Pries AR, Fritzsche A, Ley K, Gaehtgens P. Redistribution of red blood cell flow in microcirculatory networks by hemodilution. Circ Res 70: 1113–1121, 1992. [DOI] [PubMed] [Google Scholar]
- 40.Pries AR, Ley K, Claassen M, Gaehtgens P. Red cell distribution at microvascular bifurcations. Microvasc Res 38: 81–101, 1989. [DOI] [PubMed] [Google Scholar]
- 41.Pries AR, Neuhaus D, Gaehtgens P. Blood viscosity in tube flow: dependence on diameter and hematocrit. Am J Physiol Heart Circ Physiol 263: H1770–H1778, 1992. [DOI] [PubMed] [Google Scholar]
- 42.Pries AR, Secomb TW, Gaehtgens P. Design principles of vascular beds. Circ Res 77: 1017–1023, 1995. [DOI] [PubMed] [Google Scholar]
- 43.Pries AR, Secomb TW, Gaehtgens P, Gross JF. Blood flow in microvascular networks. Experiments and simulation. Circ Res 67: 826–834, 1990. [DOI] [PubMed] [Google Scholar]
- 44.Pries AR, Secomb TW, Gessner T, Sperandio MB, Gross JF, Gaehtgens P. Resistance to blood flow in microvessels in vivo. Circ Res 75: 904–915, 1994. [DOI] [PubMed] [Google Scholar]
- 45.Revellin R, Rousset F, Baud D, Bonjour J. Extension of Murray's law using a non-Newtonian model of blood flow. Theor Biol Med Model 6: 7, 2009. [DOI] [PMC free article] [PubMed] [Google Scholar]
- 46.Rossitti S, Lofgren J. Vascular dimensions of the cerebral arteries follow the principle of minimum work. Stroke 24: 371–377, 1993. [DOI] [PubMed] [Google Scholar]
- 47.Schmid-Schönbein GW. Biomechanics of microcirculatory blood perfusion. Annu Rev Biomed Eng 1: 73–102, 1999. [DOI] [PubMed] [Google Scholar]
- 48.Schmid-Schönbein GW, Usami S, Skalak R, Chien S. The interaction of leukocytes and erthrocytes in capillary and postcapillary. Microvasc Res 19: 45–70, 1980. [DOI] [PubMed] [Google Scholar]
- 49.Sherman TF. On connecting large vessels to small. The meaning of Murray's law. J Gen Physiol 78: 431–453, 1981. [DOI] [PMC free article] [PubMed] [Google Scholar]
- 50.Sherwood JM, Kaliviotis E, Dusting J, Balabani S. Hematocrit, viscosity and velocity distributions of aggregating and non-aggregating blood in a bifurcating microchannel. Biomech Model Mechanobiol 11: 1–15, 2012. [DOI] [PubMed] [Google Scholar]
- 51.Stark H, Schuster S. Comparison of various approaches to calculating the optimal hematocrit in vertebrates. J Appl Physiol 113: 355–367, 2012. [DOI] [PubMed] [Google Scholar]
- 52.Stepp DW, Nishikawa Y, Chilian WM. Regulation of shear stress in the canine coronary microcirculation. Circulation 100: 1555–1561, 1999. [DOI] [PubMed] [Google Scholar]
- 53.Taber LA. An optimization principle for vascular radius including the effects of smooth muscle tone. Biophys J 74: 109–114, 1998. [DOI] [PMC free article] [PubMed] [Google Scholar]
- 54.Uylings HBM. Optimization of diameters and bifurcation angles in lung and vascular tree structures. Bull Math Biol 39: 509–520, 1977. [DOI] [PubMed] [Google Scholar]
- 55.West GB, Brown JH, Enquist BJ. A general model for the origin of allometric scaling laws in biology. Science 276: 122–126, 1997. [DOI] [PubMed] [Google Scholar]
- 56.Williams HR, Trask RS, Weaver PM, Bond IP. Minimum mass vascular networks in multifunctional materials. J R Soc Interface 5: 55–65, 2008. [DOI] [PMC free article] [PubMed] [Google Scholar]


