

Abstract
Amplification of insulin secretion by cAMP is mediated by protein kinase A (PKA) and exchange protein directly activated by cAMP (Epac). Using selective activators, we determined how each effector influences the cytosolic free Ca2+ concentration ([Ca2+]c) and insulin secretion in mouse islets. Alone PKA activator amplified glucose- and tolbutamide-induced insulin secretion, with a greater impact on second than first phase. Epac activator strongly amplified both phases in response to either secretagogue. Amplification was even greater when activators were combined. Although both activators similarly amplified glucose-induced insulin secretion, Epac activator was particularly efficient on tolbutamide-induced insulin secretion. That greater efficacy is attributed to higher [Ca2+]c rather than interaction of tolbutamide with Epac, because it was also observed during KCl stimulation. Moreover, in contrast to Epac activator, tolbutamide was inactive when insulin secretion was increased by gliclazide, and its effect on glucose-induced insulin secretion was unaffected by an inhibitor of Epac2. PKA activator increased [Ca2+]c during acute or steady-state glucose stimulation, whereas Epac activator had no effect alone or in combination. Neither activator affected [Ca2+]c response to tolbutamide or KCl. Metabolic (glucose-mediated) amplification of insulin secretion was unaffected by PKA activator. It was attenuated when insulin secretion was augmented by Epac activator but insensitive to Epac2 inhibitor, which suggests distinct although somewhat overlapping mechanisms. In conclusion, activators of PKA and Epac amplify insulin secretion by augmenting the action of Ca2+ on exocytosis and, for PKA only, slightly increasing glucose-induced [Ca2+]c rise. The influence of Epac seems more important than that of PKA during first phase.
Precise control of kinetics and amplitude of insulin secretion by the endocrine pancreas is essential to ensure glucose homeostasis. At the β-cell level, this control is largely achieved by nutrients, in particular glucose, the metabolism of which generates signals that trigger and amplify insulin secretion. The triggering signal for exocytosis of insulin granules is an increase in the cytosolic free Ca2+ concentration ([Ca2+]c), which results from the well-established sequence of closure of ATP-sensitive potassium (KATP) channels, membrane depolarization, and influx of Ca2+ through voltage-dependent calcium channels (1–4). The metabolic amplifying signals that approximately double the exocytotic response to [Ca2+]c have not yet been formally identified (2), but their action has been attributed to a microfilament-independent acceleration of the acquisition of release competence (accelerated priming) by insulin granules (5, 6).
Various hormones and neurotransmitters are also important for optimal β-cell function (7). Their interaction with receptors in the β-cell membrane alters the production of intracellular second messengers, among which cAMP is a major player in neurohormonal amplification of insulin secretion (8, 9). For many years, the prevailing view was that cAMP exerted its effects exclusively through activation of protein kinase A (PKA) (10). However, studies based on membrane capacitance measurements in single β-cells reported that cAMP potentiated exocytosis of insulin granules by a mechanism that was resistant to PKA inhibitors (11). The underlying mechanism is now known to involve alternative effectors, the exchange proteins directly activated by cAMP (Epacs) (4, 12–14). After binding cAMP, Epac proteins facilitate exchange of GDP for GTP in the small G proteins Rap (15). Of the several existing isoforms, the pair Epac2A/Rap1 is operative in β-cells (4, 16, 17). Raising cAMP levels in β-cells activates both PKA and Epac, but how each effector contributes to the global response is uncertain. Although higher cAMP concentrations are needed to activate Epac than PKA in vitro, the difference may be compensated by oscillations of cAMP levels (18) and spatial compartmentalization of ligand and effector in intact β-cells (19).
To identify downstream effects of each effector, we compared the influence of separate activation of PKA and Epac on the kinetics of [Ca2+]c and insulin secretion changes in normal mouse islets stimulated by various agents. To this end, we used 2 recently developed activators, which can cross plasma membranes in their acetoxy-methylester form. Once in the cell, they are converted in their nonester active form by cytosolic esterases (20–22). The selectivity of N6-benzoyladenosine-3′,5′-cyclic monophosphate, acetoxymethyl ester for PKA and of 8-(4-chlorophenylthio)-2′-O-methyladenosine-3′, 5′-cyclic monophosphate, acetoxymethyl ester for Epac has been established in various systems, including β-cells. Thus, the Epac activator did not activate PKA and was without effects in Epac2 knockout islets, when the PKA activator remained active (16, 17, 23). Our results show that the 2 activators share the property of amplifying insulin secretion but have distinct effects depending on the phase of secretion and the stimulus and differently influence islet [Ca2+]c.
Materials and Methods
The study was approved by, and the experiments were conducted in accordance with the guidelines of, the University of Louvain Animal Research Committee.
Preparation, solutions, and reagents
Islets were isolated by collagenase digestion of the pancreas of female C57BL/6N mice purchased from Janvier-Europe. After selection by hand, islets were cultured for approximately 20 hours in RPMI 1640 medium kept at 37°C in a 95% air-5% CO2 atmosphere (24). Control medium used for experiments was a bicarbonate-buffered solution containing 10mM glucose and 1-mg/mL bovine serum albumin. It was gassed with O2/CO2 (94/6) to maintain a pH of 7.4 (24). A similar solution was used as test medium after adjustment of the glucose or KCl concentration and addition of the studied substances. Tolbutamide, nateglinide, gliclazide, and diazoxide were from Sigma. The membrane permeant selective activators of PKA (N6-benzoyladenosine-3′,5′-cyclic monophosphate, acetoxymethyl ester) and of Epac (8-(4-chlorophenylthio)-2′-O-methyladenosine- 3′,5′-cyclic monophosphate, acetoxymethyl ester), their inactive analog (phosphate-tris-acetoxymethylester), and a membrane permeant selective inhibitor of Epac2 (4-methylphenyl-2,4,6-trimethylphenylsulfone or compound ESI-05) were obtained from Biolog Life Science Institute and added, separately or together, from 5mM stock solutions in dimethylsulfoxide.
To facilitate reading, the above compounds will be referred to as PKA and Epac activators rather than by their chemical names throughout the article. Because acetoxymethylester hydrolysis liberates acetic acid and formaldehyde intracellularly, we also used phosphate-tris-acetoxymethylester in some control experiments of each protocol. Because the analog was consistently inactive, control experiments with and without it were pooled in all figures.
Measurements of insulin secretion
In most experiments, the kinetics of insulin secretion was monitored using perifused islets. Cultured islets were first preincubated for 90 minutes in control medium containing 10mM glucose. Depending on the applied stimulus, batches of 15–40 preincubated islets were then perifused at 37°C (24). Forty minutes after the start of perifusions, islets were stimulated as indicated at the top of the figures. Effluent fractions were collected at 2-minute intervals and saved for insulin assay, using rat insulin as a standard. At the end of the experiments, islets were recovered, and their insulin content was determined after extraction in acid-ethanol (25). Fractional insulin secretion rates were then calculated as the percentage of islet insulin content that was secreted per minute (24). In a few experiments, preincubated islets were distributed in batches of 3 and incubated at 37°C in 0.75-mL medium supplemented with test substances. After 60 minutes, samples of the medium were taken and saved for insulin assay.
Measurements of islet [Ca2+]c
Cultured islets were loaded with the Ca2+ indicator fura PE3/AM (2μM) for 2 hours at 37°C, in 2-mL control medium containing 10mM glucose. Stimulus-induced [Ca2+]c changes were then measured in individual islets as described (6) and averaged for presentation as mean traces.
Presentation of results
All experiments have been performed with islets from 3 to 6 preparations. Results are presented as mean ± SD. The statistical significance of differences between means was assessed by ANOVA, followed by Newman-Keuls test for comparisons between groups.
Results
Influence of pretreatment with activators of PKA and Epac on glucose-induced [Ca2+]c and insulin responses
Figure 1, A and D, shows the mean time course of islet [Ca2+]c and insulin secretion changes occurring when the glucose concentration was increased from 1mM to 15mM. In control untreated islets, [Ca2+]c displayed the well-established initial decrease followed by a biphasic increase (Figure 1A). The oscillations of [Ca2+]c occurring during second phase (Figure 1A, lower inset) are masked in average traces, because they are not synchronized between isolated islets (2). Glucose-induced insulin secretion was biphasic (Figure 1D). For statistical comparisons, mean [Ca2+]c and insulin secretion changes were computed during each phase and are shown in Figure 1, B, C, E, and F.
Figure 1.

Influence of activators of PKA and Epac on the kinetics of glucose-induced changes in [Ca2+]c and insulin secretion in mouse islets. At 0 minutes, islets were stimulated by an increase in glucose concentration either from 1mM (G1) to 15mM (G15) (A–F) or from 5mM (G5) to 10mM (G10) (G–I). When tested, the activators of PKA or Epac were added separately or together (6μM each) at −10 minutes (vertical arrow) and remained present until the end. A, Average [Ca2+]c changes in control islets (thin trace) and islets treated with the combination of PKA and Epac activators (thick trace). Values are mean ± SD for 45–48 islets from 4 preparations. Insets illustrate changes in representative single islets stimulated with glucose alone or with glucose and combined PKA and Epac activators. B and C, Mean values of [Ca2+]c during first phase (3–10 min) and second phase (11–25 min) in control islets and islets treated with activators as indicated by numbers. D and G, Insulin secretion by the 4 groups of islets identified by different symbols. Values are mean ± SD for 6 and 5 islet preparations. E, F, H, and I, Integrated insulin secretion during first phase (3–10 min) and second phase (11–25 min) in the 4 groups of islets. +, P < .05; §, P < .01; and *, P < .001 vs untreated controls.
Simultaneous addition of activators of PKA and Epac (6μM each) to a medium containing 1mM glucose had no significant effect on basal [Ca2+]c or on the initial decrease produced by 15mM glucose. The subsequent increase remained biphasic, was unaffected during first phase, but was slightly larger than in controls during second phase (Figure 1, A–C). A similar response was observed after addition of the activator of PKA alone, whereas the activator of Epac alone had no significant effect on [Ca2+]c (Figure 1, B and C).
None of the activators affected basal insulin secretion in 1mM glucose, but each increased the secretory response to 15mM glucose applied 10 minutes later (Figure 1, D–F). With PKA activator alone, first phase was slightly lengthened, but the integrated response was only marginally increased (∼1.3-fold vs controls, not significant by ANOVA, P < .05 by t test), whereas second phase was augmented approximately 1.8-fold. With Epac activator alone, both first and second phases were increased approximately 2.2-fold. When both activators were combined, first and second phases were amplified approximately 3- and 5-fold (Figure 1, D–F).
Because of the smaller effect of PKA activator on first than second phase, islets were pretreated with the activator for a longer period (25 min) before glucose stimulation (Supplemental Figure 1). First phase was again modestly larger (∼1.5-fold, P < .05 by t test) than in controls, and second phase was increased approximately 1.7-fold.
In a further series, islets were not exposed to very low glucose (1mM) but maintained in 5mM glucose, and the activators were applied 10 minutes before stimulation with 10mM glucose (Figure 1G). The activator of PKA increased first phase by 1.45-fold (P < .05), which remained less than the 1.8-fold increase (P < .01) by the Epac activator, whereas the effect of both activators was similar (∼1.9-fold) during second phase (Figure 1, G–I). The combination of PKA and Epac activators increased first and second phases by approximately 2.6- and 4.3-fold, respectively. As shown in Supplemental Figure 2, first and second phases of the [Ca2+]c rise induced by 10mM glucose were similarly increased by the PKA activator alone or in combination with the Epac activator, whereas the latter was without effect.
Influence of pretreatment with activators of PKA and Epac on tolbutamide-induced [Ca2+]c and insulin responses
Figure 2 shows mean changes in islet [Ca2+]c and insulin secretion occurring when 500μM tolbutamide was added to a medium containing 3mM glucose. In control untreated islets, [Ca2+]c rapidly increased to a peak before declining slightly to a plateau with only small and rapid fluctuations (no large oscillations) in individual islets (Figure 2A, lower inset). Insulin secretion was biphasic with a low but sustained second phase (Figure 2D).
Figure 2.

Influence of activators of PKA and Epac on the kinetics of tolbutamide-induced changes in [Ca2+]c and insulin secretion in mouse islets. Islets were stimulated by addition of 500μM tolbutamide (G3 Tolb) to a medium containing 3mM glucose (G3) at 0 minutes. When tested, the activators of PKA or Epac were added separately or together (6μM each) at −10 minutes (vertical arrow) and remained present until the end. A, Average [Ca2+]c changes in control islets (thin trace) and islets treated with the combination of PKA and Epac activators (thick trace). Values are mean ± SD for 34–35 islets from 3 preparations. Insets illustrate changes in representative single islets stimulated with tolbutamide alone or with tolbutamide and combined PKA and Epac activators. B and C, Mean values of [Ca2+]c during first phase (2–9 min) and second phase (11–25 min) in control islets and islets treated with activators as indicated by numbers. D, Insulin secretion by the 4 groups of islets identified by different symbols. Values are mean ± SD for 6 islet preparations. E and F, Integrated insulin secretion during first phase (2–9 min) and second phase (11–25 min) in the 4 groups of islets. *, P < .001 vs untreated controls.
Simultaneous addition of activators of PKA and Epac to the medium containing 3mM glucose had no significant effect on basal [Ca2+]c or on the increase induced by addition of tolbutamide 10 minutes later (Figure 2, A–C). The 2 activators were also ineffective when tested separately (Figure 2, B and C).
Basal insulin secretion in 3mM glucose was unaffected by PKA and Epac activators (Figure 2D). The PKA activator had no effect on first phase of tolbutamide-induced insulin secretion and slightly (1.8-fold) amplified second phase (not significant by ANOVA but P < .01 by t test). In contrast, Epac activator markedly amplified first (2.8-fold) and second (5.6-fold) phases. Amplification was even greater when both activators were combined, reaching about 10-fold for second phase (Figure 2, D–F).
Influence of activators of PKA and Epac on metabolic amplification of insulin secretion
Metabolic amplification of insulin secretion can be evaluated by comparing the changes in islet [Ca2+]c and insulin secretion produced by high glucose to those produced by tolbutamide in low glucose (6). This comparison was done for the experiments presented in Figures 1, A and D, and 2, A and D, and is summarized as ratios of the responses to glucose and tolbutamide in Figure 3, A and B. In untreated control islets, insulin secretion was approximately 2-fold greater in response to glucose than tolbutamide, whereas the [Ca2+]c response was lower, which reflects metabolic amplification (2). PKA activator alone did not affect metabolic amplification. In contrast, Epac activator alone or in combination with PKA activator suppressed it (Figure 3B). This alteration results from the relatively larger augmentation of tolbutamide- than glucose-induced insulin secretion by Epac activator.
Figure 3.
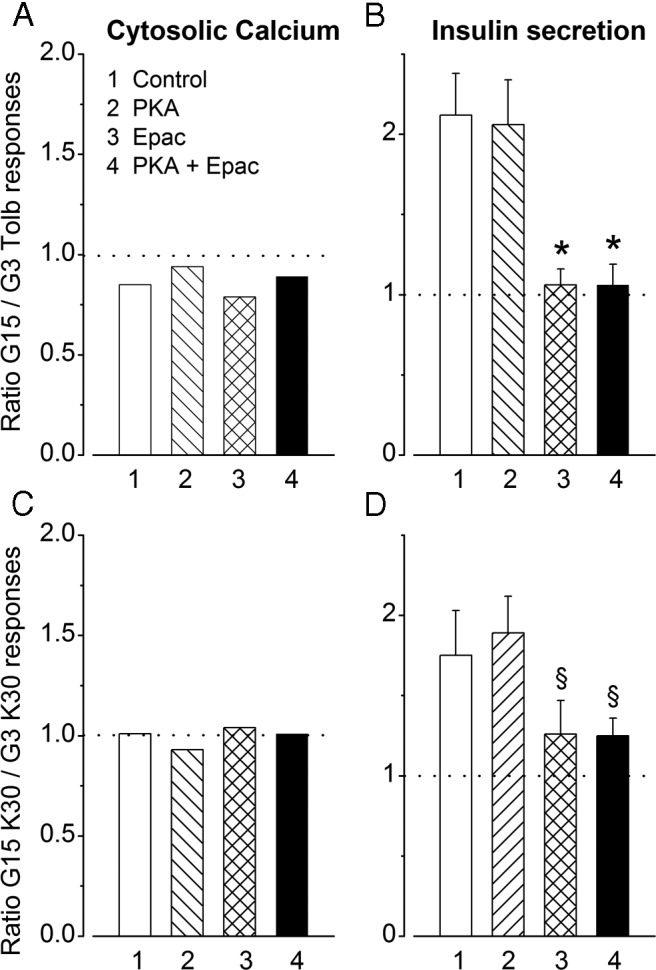
Influence of activators of PKA and Epac on metabolic amplification of insulin secretion. A and B, Metabolic amplification is estimated by comparing [Ca2+]c and insulin secretion changes induced by 15mM glucose (G15) and 500μM tolbutamide in 3mM glucose (G3 Tolb) in islets treated or not with PKA and Epac activators, as indicated by numbers. For [Ca2+]c the ratio of responses was computed from means of experiments performed with different islet preparations. For insulin secretion, ratios were calculated in each of the 6 experiments shown in Figures 1D and 2D, where islets from the same preparation were stimulated by either 15mM glucose or tolbutamide (hence the presentation as mean ± SD). C and D, Metabolic amplification is estimated by comparing [Ca2+]c and insulin secretion changes induced by 30mM KCl in 15mM glucose (G15 K30) or 3mM glucose (G3 K30). §, P < .01 and *, P < .001 vs untreated controls.
Metabolic amplification is also classically studied by comparing the effects of KCl in the presence of diazoxide at low and high glucose (26). As shown in Figure 4A, insulin secretion induced by 30mM KCl in 3mM glucose (G3K30) was unaffected by PKA activator but markedly and similarly increased (P < .01) by Epac activator alone or in combination with PKA activator. Similar effects of the activators were observed during stimulation with 30mM KCl in 15mM glucose (G15K30) (Figure 4B). None of the activators affected the rise in [Ca2+]c produced by KCl (Supplemental Figure 3). This rise was also similar in 3mM and 15mM glucose as shown by ratios close to 1 in Figure 3C. In contrast, the ratio of insulin secretion in G15K30 vs G3K30 was approximately 1.75 in control islets, which reflects metabolic amplification (Figure 3D). This amplification was unaffected by PKA activator but markedly attenuated (ratios of ∼1.25) by Epac activator alone or combined with PKA activator (Figure 3D).
Figure 4.

Influence of activators of PKA and Epac on KCl-induced changes in insulin secretion in mouse islets. A and B, At 0 minutes, perifused islets were stimulated by 30mM KCl in a medium containing 3mM glucose (G3) or 15mM glucose (G15) and supplemented with 100μM diazoxide (Dz) throughout. When tested, the activators of PKA or Epac were added separately or together (6μM each) at −10 minutes (vertical arrow) and remained present until the end. Values on the right of each panel correspond to total insulin secretion (0–25 min) in each group as a percentage of controls. C, Influence of an inhibitor of Epac 2 (ESI-05) on insulin secretion by mouse islets incubated for 60 minutes in medium containing 30mM KCl + 100μM Dz and either 3mM glucose (G3Dz K30) or 15mM glucose (G15Dz K30). In some groups, the medium also contained 6μM Epac activator as indicated. Test islets (black columns) were preincubated (45 min) and incubated in the presence of 10μM ESI-05. Values are mean ± SD for 21 batches of 3 islets. *, P < .001 vs controls. D and E, Comparison of the amplification of insulin secretion by 15mM glucose and Epac activator in low glucose at increasing levels of [Ca2+]c. In a medium containing 100μM Dz throughout, the concentration of CaCl2 was increased stepwise during stimulation with 30mM KCl, as indicated at the top of the figure. D, Average [Ca2+]c changes in control islets perifused with 3mM glucose (G3). Values are mean ± SD for 24 islets. E, Insulin secretion by islets maintained in 3mM or 15mM glucose alone throughout (G3 and G15) or in 3mM glucose with addition of Epac activator (6 μM) at −10 minutes (vertical arrow). Values are mean ± SD for 5 islet preparations.
Because this attenuation might suggest that Epac is involved in metabolic amplification by glucose, islets were incubated with compound ESI-05, an established inhibitor of Epac2 in other systems (27, 28). Compound ESI-05 had no effect on KCl-induced insulin secretion (Figure 4C), and the ratio of the responses in G15K30/G3K30 was similar with and without inhibitor (1.84 vs 1.81). In contrast, the augmentation of KCl-induced insulin secretion by Epac activator was largely although not completely antagonized by compound ESI-05 (Figure 4C). This incomplete inhibition might be due to distinct efficacies of activator and inhibitor on Epac2 or to a contribution of Epac1 that is present in small amounts in β-cells (29) and not inhibited by compound ESI-05 (27, 28). Confirming results obtained with perifused islets (Figure 3D), the response to G15K30 was only slightly larger (∼1.2-fold, P < .01) than that to G3K30 when insulin secretion was augmented by Epac activator. However, a greater effect of glucose (∼1.55-fold) was unmasked by compound ESI-05. Collectively, these results indicate that metabolic amplification is not mediated by Epac2.
In a last series of experiments, we compared the amplifying actions of Epac activator and glucose on insulin secretion induced by graded increases of islet [Ca2+]c during depolarization with KCl (Figure 4D). As previously reported (30), metabolic amplification by glucose was minimal when [Ca2+]c was only slightly elevated and increased with increasing [Ca2+]c (Figure 4E). In contrast, a clear amplification by Epac activator was already observed at the lowest [Ca2+]c, which suggests an increased sensitivity of exocytosis to Ca2+ by Epac. At least partially different mechanisms may thus be involved in the 2 amplification pathways.
Influence of activators of PKA and Epac on islet [Ca2+]c and insulin secretion during steady-state stimulation with glucose
In the experiments shown in Figure 5, activators were added and withdrawn during the second phase of stimulation with glucose. In untreated control islets steadily stimulated with 15mM or 8mM glucose, [Ca2+]c was elevated compared with islets in 1mM glucose and slightly increased with time (Figure 5, A and B). This spontaneous increase between the periods minus 10 to 0 minutes and 15 to 25 minutes is quantified in Figure 5, C and D. Addition of the PKA activator alone (Figure 5A) or with the Epac activator (Figure 5B) increased [Ca2+]c to a larger extent than in untreated controls, and this effect was reversible after withdrawal of the agents. In contrast, the Epac activator alone had no significant effect (Figure 5, C and D). Representative responses in individual islets are shown in Supplemental Figure 4.
Figure 5.

Influence of addition and withdrawal of activators of PKA and Epac on [Ca2+]c (A–D) and insulin secretion (E–H) in mouse islets continuously stimulated with 15mM (G15) or 8mM (G8) glucose. Activators (6μM each) were added separately or together for the indicated period. A and B, Average [Ca2+]c in control islets (thin trace) and in islets treated with one selected activator (thick trace). Values in 1mM glucose are shown for comparison (dotted lines labeled G1). C and D, Difference in [Ca2+]c between the 10-minute periods ending and preceding addition of test agents. Values are mean ± SD for 45–51 islets from 4 preparations (A and C) and of 34–36 islets from 3 preparations (B and D). E and F, Insulin secretion by the 4 groups of islets identified by different symbols. G and H, Fold increase in insulin secretion between the 10-minute periods ending and preceding addition of test agents. Values are mean ± SD for 5 (G8) or 6 (G15) islet preparations. §, P < .01 and *, P < .001 vs untreated controls.
Steady-state insulin secretion induced by 15mM and 8mM glucose was reversibly amplified by separate and combined addition of PKA and Epac activators (Figure 5, E and F). The onset of increase was slower with PKA than Epac activator, but the magnitude of the effect was similar (2.2- to 2.5-fold) after 20–30 minutes (Figure 5, G and H). Amplification was greater when activators were combined (4.1-fold in 15mM glucose and 5.3-fold in 8mM glucose). Notably, although relative changes in secretion were similar in 8mM and 15mM glucose (Figure 5, G and H), absolute increases were much larger (∼5-fold) in 15mM glucose as indicated by the different scales in Figure 5, E and F. These and preceding results thus show that amplification of glucose-induced insulin secretion by PKA activation is accompanied by a slight increase in islet [Ca2+]c, whereas that produced by Epac activation is not.
In preceding experiments, PKA activator was found to increase islet [Ca2+]c in the presence of 8mM, 10mM, and 15mM glucose, whereas Epac activator did not. To confirm such differences in action, experiments were run in the presence of a threshold concentration of 6mM glucose throughout (Figure 6). Of all tested islets, 63% spontaneously showed 1 or several [Ca2+]c oscillations (active islets). Application of PKA activator alone or with Epac activator increased the size of these oscillations (Figure 6B) or induced their appearance in previously silent islets, so that almost all islets became active (Figure 6A). As a result, the difference between average [Ca2+]c measured before and during application of PKA activator alone (37 ± 15nM) or with Epac activator (39 ± 15nM) was clearly larger (P < .001) than the spontaneous increase occurring in control islets (11 ± 9nM). In contrast, no increase in [Ca2+]c was produced by Epac activator (10 ± 9nM). Finally, all islets displayed a similar, rapid, and large increase in [Ca2+]c upon stimulation by a low concentration of tolbutamide (Figure 6A). Altogether, these and preceding results indicate that changes in β-cell [Ca2+]c are mediated by PKA rather than Epac activation.
Figure 6.
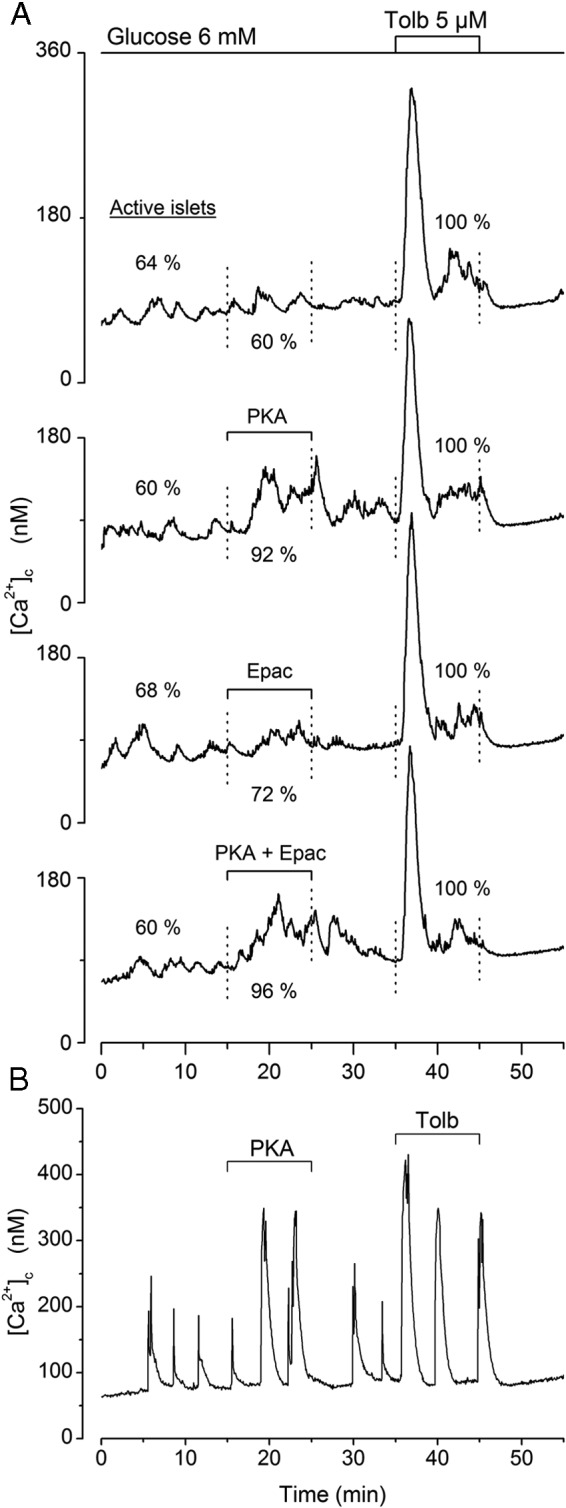
Influence of activators of PKA and Epac on [Ca2+]c in mouse islets maintained in a threshold concentration of 6mM glucose. A 10-minute period already in 6mM glucose preceded the start of the recordings. Test agents (6μM) were added separately or simultaneously between 15 and 25 minutes. Tolbutamide (5μM) was then added between 35 and 45 minutes. A, Means for 25 islets. Values within the figure give the percentage of these 25 islets that were active (showing 1 or several peaks of [Ca2+]c during the corresponding period). B, Effects of PKA activator in a representative islet.
Influence of activators of PKA and Epac on islet [Ca2+]c and insulin secretion during steady-state stimulation with tolbutamide
In the experiments shown in Figure 7, A and B, the glucose concentration was kept at 3mM or 8mM throughout, and stimulation with tolbutamide was applied 40 minutes before addition of test agents (only the last 10 min are shown). Islet [Ca2+]c was steadily elevated in the presence of tolbutamide, and this high [Ca2+]c was not further increased by addition of PKA and Epac activators (data not shown). During stimulation with 500μM tolbutamide in 3mM glucose (Figure 7, A and C) and with 100μM tolbutamide in 8mM glucose (Figure 7, B and D), PKA activation progressively increased insulin secretion rate by 1.7- and 1.9-fold, respectively. The increase in insulin secretion was faster and greater upon activation of Epac alone and even larger during combined activation of PKA and Epac (Figure 7, A–D). It is thus striking that insulin secretion was much more efficiently amplified by Epac than PKA activation when tolbutamide was present in either 3mM or 8mM glucose. This contrasts with the similar efficacy of the 2 activators in the presence of 8mM or 15mM glucose alone (Figure 5).
Figure 7.
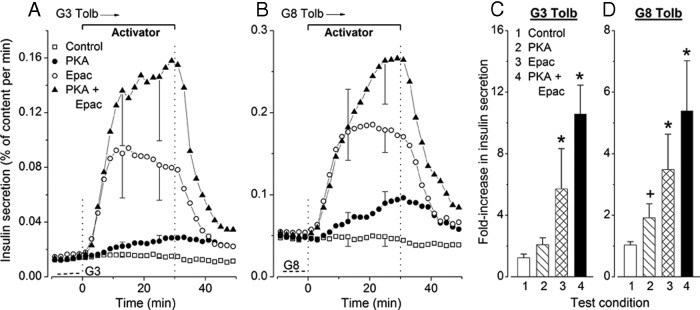
Influence of addition and withdrawal of activators of PKA and Epac on insulin secretion in mouse islets continuously stimulated by (A) 500μM tolbutamide in 3mM glucose (G3 Tolb) and (B) 100μM tolbutamide in 8mM glucose (G8 Tolb). Activators (6μM each) were added separately or together for the indicated period. The dotted lines in the lower left corners indicate the rate of secretion in the absence of tolbutamide. C and D, Fold increase in insulin secretion between the 10-minute periods ending and preceding addition of test agents. Values are mean ± SD for 6 islet preparations. +, P < .05 and *, P < .001 vs untreated controls. C, The effect of PKA activator is P > .05 by ANOVA and P < .01 by t test vs controls.
Influence of Epac activator and tolbutamide on insulin secretion during steady-state stimulation with gliclazide or nateglinide
To determine whether an interaction of tolbutamide with Epac2 in β-cells (31) might explain the large effects of Epac activator in the presence of the sulfonylurea (Figure 7B), we performed similar experiments with another sulfonylurea, gliclazide, and with the nonsulfonylurea nateglinide, which also close KATP channels but do no interact with Epac2 (31). As shown in Figure 8, A and B, insulin secretion was strongly stimulated when islets were perifused with 8mM glucose plus 10μM gliclazide (0.054 ± 0.011% per min) or 10μM nateglinide (0.050 ± 0.006% per min). This rate of secretion was similar to that produced by the combination of 8mM glucose and 100μM tolbutamide (0.048 ± 0.012% per min) (Figure 7B). In the continuous presence of either gliclazide or nateglinide, addition of Epac activator caused a large, reversible increase in insulin secretion, whereas addition of 100μM tolbutamide was ineffective (Figure 8, A and B). Because sulfonylureas and activator synergistically act to stimulate Epac2 (32), their combination was also tested in the presence of gliclazide but was not more effective than Epac activator alone (Figure 8A). Finally, Figure 8C shows that the augmentation of insulin secretion produced by Epac activator was suppressed by the Epac2 inhibitor ESI-05 (27, 28), whereas the effect of tolbutamide was unaffected. Collectively, these results suggest that activation of Epac does not significantly contribute to the effects of tolbutamide on insulin secretion.
Figure 8.

Assessment of the role of Epac in tolbutamide-induced insulin secretion. A and B, Influence of tolbutamide (Tolb, 100μM) and Epac activator (6μM) on insulin secretion in mouse islets continuously stimulated by 10μM gliclazide (A) or 10μM nateglinide (B) in 8mM glucose (G8). The 2 agents were added separately or simultaneously for the indicated period. Dotted lines labeled G8 show the rate of insulin secretion in the absence of gliclazide or nateglinide. Values are mean ± SD for 5–6 islet preparations. C, Influence of an inhibitor of Epac 2 (ESI-05) on insulin secretion by mouse islets incubated for 60 minutes in medium containing 10mM glucose alone (G10), with 6μM Epac activator (G10 + Epac) or with 100μM tolbutamide (G10 + Tolb). Test islets were preincubated (45 min) and incubated in the presence of 10μM ESI-05. Values are mean ± SD for 17 batches of 3 islets. *, P < .001 vs controls.
Discussion
Raising cAMP levels in β-cells similarly amplifies glucose- and tolbutamide-induced insulin secretion (33). Using normal mouse islets, we investigated the responses to separate and combined activation of PKA and Epac, the 2 effectors of cAMP on insulin secretion (10–14). Our approach based on the use of selective activators provides qualitative but not quantitative information on how endogenous cAMP affects β-cell function. Thus, because PKA and Epac have different sensitivities to cAMP, the concentration of which displays spatial differences within the cell (19), one does not know to what extent each of the 2 effectors is activated by a given increase in endogenous cAMP production. Selecting extracellular concentrations of the activators that would produce a similar relative activation of the 2 effectors is presently not possible.
The results show that the effect of cAMP on the 2 phases of the response to glucose is qualitatively reproduced by combining Epac and PKA activators and by Epac activator alone. The PKA activator amplified second phase of glucose-induced secretion as did Epac activator but had less impact on first phase even after extended pretreatment and avoidance of islet exposure to very low glucose. Another difference was that Epac activator proved more effective during tolbutamide than glucose stimulation. In previous studies, the same Epac activator potentiated both (23, 34) or only second phase (17) of glucose-induced insulin secretion by normal islets. The PKA activator (17, 23) and genetic disinhibition or activation of PKA (35, 36) augmented glucose-induced insulin secretion by isolated islets. Tolbutamide-induced insulin secretion in incubated INS-1 cells was increased by Epac activator (37), but effects of selective PKA activation on the response to tolbutamide have not previously been reported. Interestingly, the effects of both activators were progressively reversible upon withdrawal of permeant inactive precursors from the medium, which indicates intracellular degradation by phosphodiesterases and/or slow exit of the nonmethylated active forms.
Our results suggest that amplification of insulin secretion by cAMP is mainly mediated by Epac during first phase, whereas both Epac and PKA individually contribute during second phase. Thus, irrespective of the experimental conditions, the amplifying action of PKA activation was smaller on first than second phase of glucose-induced insulin secretion. We emphasize, however, that our conclusion pertains to the amplification by cAMP of glucose-induced insulin secretion and does not challenge the proposal that PKA activity is relevant to the immediate β-cell response to glucose alone (38, 39). We also found that PKA activator was poorly efficient on insulin secretion induced by tolbutamide or KCl in low glucose. This might suggest that its action requires an additional signal derived of metabolism and produced with some delay upon stimulation by high glucose. Our conclusion that Epac plays a greater role than PKA during first phase agrees with a study using total internal reflection fluorescence microscopy to visualize exocytosis of insulin granules during cAMP potentiation of glucose-induced secretion by control and Epac2-KO β-cells (40). It is also consistent with measurements of membrane capacitance in single β-cells showing that amplification of Ca2+-induced exocytosis by cAMP is initially PKA independent (11). Conversely, expression of a constitutively active catalytic subunit of PKA in β-cells was very efficient in amplifying first phase (36). The difference with our results may be linked to a week-long rather than acute stimulation of PKA. In any case, our observation that the combination of PKA and Epac activators was more efficient than either activator alone indicates that operation of both effectors is needed for optimal response, including first phase. A similar proposal has been made by others (23, 38). How this interaction occurs is not known. In agreement with previous results in mouse islets (34, 40), but at variance with others in human islets (23), we found that amplification of glucose-induced insulin secretion by Epac activator was not antagonized by an inhibitor of PKA (2.6-fold in the absence and 2.4-fold in the presence of 10μM compound H89).
Raising cAMP levels increases electrical activity and [Ca2+]c in intact islets or isolated β-cells stimulated by glucose (33, 41–44). In the present study, we found that PKA activator did not affect islet basal [Ca2+]c in low, nonstimulatory glucose (1mM to 5mM) but reversibly augmented [Ca2+]c during acute or steady-state stimulation with 8mM, 10mM, or 15mM glucose. In contrast, Epac activator was consistently ineffective on [Ca2+]c when used alone, and its combination with PKA activator did not modify the action of the latter. Neither activator affected [Ca2+]c in islets depolarized with tolbutamide or KCl. In other studies using INS-1 cells maintained in 1mM glucose, the same PKA activator markedly increased basal [Ca2+]c and did not augment the response to tolbutamide (16). In the same cell line, the Epac activator slightly augmented basal [Ca2+]c and potentiated the rise in [Ca2+]c induced by tolbutamide (16, 37). The Epac activator also caused a transient increase in [Ca2+]c in glucose-stimulated human β-cells (23) and mouse islets (44) maintained in 5.6mM–7.5mM glucose. These discrepancies with our results, yet obtained under many conditions, led us to test activators in the continuous presence of 6mM glucose. Also at that threshold concentration of glucose, we found Epac activator to be inactive, whereas PKA activator (alone or combined with Epac activator) augmented [Ca2+]c oscillations in spontaneously active islets or induced their appearance in previously silent islets (Figure 6). The ability of cAMP to increase [Ca2+]c in β-cells has been attributed to Ca2+-induced Ca2+ release from intracellular stores and facilitation of KATP channel closure (review in 44). Our measurements in whole islets do not formally rule out a contribution of Ca2+-induced Ca2+ release in the small increase of [Ca2+]c produced by PKA activator during glucose stimulation, but that possibility is not supported by the lack of appearance of typical large [Ca2+]c peaks, even when the activator was tested in the presence of high KCl. On the other hand, facilitation of KATP channel closure would be compatible with the lack of effect of PKA activator on high [Ca2+]c during depolarization with tolbutamide or with KCl in the presence of diazoxide. We note, however, that the effects of PKA activator alone or with Epac activator on [Ca2+]c at threshold glucose were small compared with those of a low concentration (5μM) of tolbutamide. With the reservation that we cannot explain discrepancies between the present and other results, in particular the consistent lack of effect of Epac activator, we propose that the effects of cAMP on [Ca2+]c in glucose-stimulated mouse islets are mediated through PKA rather than Epac.
The small increase in [Ca2+]c brought about by PKA activator may contribute to the augmentation of glucose-induced insulin secretion but is unlikely to explain entirely the amplifying action of PKA. Thus, insulin secretion induced by tolbutamide (in 3mM and 8mM glucose) was amplified by PKA activator without a further rise in [Ca2+]c. The dissociation is much more obvious for the Epac activator, which consistently augmented insulin secretion without affecting [Ca2+]c. Earlier studies using permeabilized islets (45, 46), single β-cells (11, 47–49), or intact islets (33) concluded that the major site of action of cAMP is distal to the rise in triggering [Ca2+]c. From the experiments presented here, we propose that the distal action of cAMP on insulin secretion is mainly mediated by Epac and to a lesser extent by PKA. Studies using electrophysiological and/or optical methods to monitor movements and exocytosis of individual insulin granules would be necessary to identify the underlying mechanisms. These may involve changes in the size of distinct granular pools, facilitation of granule recruitment from these pools to the plasma membrane, and acceleration of the priming process that confers granules with release competence (4, 44). Several of the many proteins composing the sophisticated exocytotic machinery are being recognized as critical mediators in that action of the 2 effectors of cAMP on insulin granule exocytosis (review in Ref. 50).
It has been suggested that besides sulfonylurea receptor 1, the regulatory subunit of KATP channels, Epac2 is also a target for sulfonylureas and that its activation in intact β-cells contributes to the insulin-secreting action of these drugs (31). Subsequent studies measuring Epac activation in various systems have supported (51) and challenged (16, 52, 53) that proposal. Our results show that Epac activator exerted a greater amplification of tolbutamide- than glucose-induced insulin secretion, particularly during second phase (5- vs 2-fold) (Figures 2F and 1F). That difference in relative efficacy cannot be attributed to a lower glucose concentration or lower rate of secretion during tolbutamide stimulation. Thus, amplification by Epac activator was again greater during stimulation with tolbutamide in 8mM glucose (3.5-fold) (Figure 7D) than with 8mM glucose alone (2-fold) (Figure 5H), although the control rate of secretion was now highest in the presence of the sulfonylurea. Finally, although Epac and PKA activators were similarly effective in 8mM and 15mM glucose alone (Figure 5, E and F), Epac activator was consistently more active than PKA activator in the presence of tolbutamide, in 3mM or 8mM glucose (Figure 7, A and B). To evaluate whether that difference reflects functional interactions of tolbutamide with Epac (31, 32), we used another sulfonylurea, gliclazide, and the nonsulfonylurea nateglinide, which have the same action as tolbutamide on KATP channels but do not interact with Epac (31). In 8mM glucose, both drugs induced the same rate of insulin secretion as tolbutamide, and their effect was strongly augmented by Epac activator but not by tolbutamide alone or in combination with Epac activator. In addition, compound ESI-05, an inhibitor of Epac2 (27, 28), antagonized the increase in glucose-induced insulin secretion produced by Epac activator but was without effect on that produced by tolbutamide. We therefore conclude that the possible interaction of tolbutamide with Epac is unimportant for the stimulation of insulin secretion. A similar conclusion was reached in a recent study comparing the influence of Epac activator on tolbutamide and gliclazide effects in INS-1 cells (37). What could then explain the great efficacy of Epac activator in the presence of tolbutamide? We speculate that the higher [Ca2+]c achieved during stimulation with tolbutamide (or gliclazide and nateglinide) than with glucose alone is involved, perhaps by facilitating translocation of Epac2 to the plasma membrane (19). Thus, Epac activator also proved very effective when [Ca2+]c was strongly elevated by KCl. Along the same line, we previously reported that tolbutamide failed to increase insulin secretion when added during stimulation with KCl (54) in contrast with the strong amplification produced by Epac activator (Figure 4).
Some overlap exists between cAMP-mediated and metabolic (glucose) amplification of insulin secretion (55–57). However, by comparing glucose- and tolbutamide-induced insulin secretion in the presence of cAMP-raising agents, we recently concluded that the 2 pathways are distinct (33). A similar comparison here agrees with our previous proposal as far as PKA activation is concerned but apparently not during Epac activation. Thus, metabolic amplification was abolished in the presence of the Epac activator that augmented tolbutamide-induced secretion much more than glucose-induced secretion. Similarly, metabolic amplification studied during β-cell depolarization with KCl in high and low glucose (26) was strongly attenuated by Epac activator. However, the inhibitor of Epac2 did not impair metabolic amplification by glucose while antagonizing the augmentation of KCl-induced insulin secretion caused by Epac activator. One plausible explanation for the incomplete additivity of metabolic and cAMP-mediated (mainly Epac-mediated) amplifications is that both pathways converge to the same pool of insulin granules, possibly nondocked, newcomer granules (6, 40, 58, 59). Amplification of Ca2+-induced exocytosis might reach maximum rates of secretion when both pathways are activated.
Acknowledgments
We thank F. Knockaert for technical assistance and Dr N.I. Mourad for his contribution to preliminary experiments.
This work was supported by the Fonds National de la Recherche Scientifique Grant 3.4530.08.
Disclosure Summary: The authors have nothing to disclose.
Footnotes
- [Ca2+]c
- cytosolic free Ca2+ concentration
- Epac
- exchange protein directly activated by cAMP
- G3K30
- 30mM KCl in 3mM glucose
- G15K30
- 30mM KCl in 15mM glucose
- KATP
- ATP-sensitive potassium
- PKA
- protein kinase A.
References
- 1. MacDonald PE, Joseph JW, Rorsman P. Glucose-sensing mechanisms in pancreatic β-cells. Philos Trans R Soc Lond B Biol Sci. 2005;360:2211–2225. [DOI] [PMC free article] [PubMed] [Google Scholar]
- 2. Henquin JC. Regulation of insulin secretion: a matter of phase control and amplitude modulation. Diabetologia. 2009;52:739–751. [DOI] [PubMed] [Google Scholar]
- 3. Bertram R, Sherman A, Satin LS. Electrical bursting, calcium oscillations, and synchronization of pancreatic islets. Adv Exp Med Biol. 2010;654:261–279. [DOI] [PMC free article] [PubMed] [Google Scholar]
- 4. Seino S. Cell signalling in insulin secretion: the molecular targets of ATP, cAMP and sulfonylurea. Diabetologia. 2012;55:2096–2108. [DOI] [PubMed] [Google Scholar]
- 5. Straub SG, Sharp GW. Hypothesis: one rate-limiting step controls the magnitude of both phases of glucose-stimulated insulin secretion. Am J Physiol Cell Physiol. 2004;287:C565–C571. [DOI] [PubMed] [Google Scholar]
- 6. Mourad NI, Nenquin M, Henquin JC. Metabolic amplifying pathway increases both phases of insulin secretion independently of β-cell actin microfilaments. Am J Physiol Cell Physiol. 2010;299:C389–C398. [DOI] [PubMed] [Google Scholar]
- 7. Ahrén B. Islet G protein-coupled receptors as potential targets for treatment of type 2 diabetes. Nat Rev Drug Discov. 2009;8:369–385. [DOI] [PubMed] [Google Scholar]
- 8. Sharp GW. The adenylate cyclase-cyclic AMP system in islets of Langerhans and its role in the control of insulin release. Diabetologia. 1979;16:287–296. [DOI] [PubMed] [Google Scholar]
- 9. Prentki M, Matschinsky FM. Ca2+, cAMP, and phospholipid-derived messengers in coupling mechanisms of insulin secretion. Physiol Rev. 1987;67:1185–1248. [DOI] [PubMed] [Google Scholar]
- 10. Jones PM, Persaud SJ. Protein kinases, protein phosphorylation, and the regulation of insulin secretion from pancreatic β-cells. Endocr Rev. 1998;19:429–461. [DOI] [PubMed] [Google Scholar]
- 11. Renström E, Eliasson L, Rorsman P. Protein kinase A-dependent and -independent stimulation of exocytosis by cAMP in mouse pancreatic β-cells. J Physiol. 1997;502:105–118. [DOI] [PMC free article] [PubMed] [Google Scholar]
- 12. Ozaki N, Shibasaki T, Kashima Y, et al. cAMP-GEFII is a direct target of cAMP in regulated exocytosis. Nat Cell Biol. 2000;2:805–811. [DOI] [PubMed] [Google Scholar]
- 13. Kang G, Joseph JW, Chepurny OG, et al. Epac-selective cAMP analog 8-pCPT-2′-O-Me-cAMP as a stimulus for Ca2+-induced Ca2+ release and exocytosis in pancreatic β-cells. J Biol Chem. 2003;278:8279–8285. [DOI] [PMC free article] [PubMed] [Google Scholar]
- 14. Holz GG. Epac: a new cAMP-binding protein in support of glucagon-like peptide-1 receptor-mediated signal transduction in the pancreatic β-cell. Diabetes. 2004;53:5–13. [DOI] [PMC free article] [PubMed] [Google Scholar]
- 15. Gloerich M, Bos JL. Epac: defining a new mechanism for cAMP action. Annu Rev Pharmacol Toxicol. 2010;50:355–375. [DOI] [PubMed] [Google Scholar]
- 16. Leech CA, Dzhura I, Chepurny OG, Schwede F, Genieser HG, Holz GG. Facilitation of β-cell KATP channel sulfonylurea sensitivity by a cAMP analog selective for the cAMP-regulated guanine nucleotide exchange factor Epac. Islets. 2010;2:72–81. [DOI] [PMC free article] [PubMed] [Google Scholar]
- 17. Song WJ, Mondal P, Li Y, Lee SE, Hussain MA. Pancreatic β-cell response to increased metabolic demand and to pharmacologic secretagogues requires EPAC2A. Diabetes. 2013;62:2796–2807. [DOI] [PMC free article] [PubMed] [Google Scholar]
- 18. Tian G, Sandler S, Gylfe E, Tengholm A. Glucose- and hormone-induced cAMP oscillations in α- and β-cells within intact pancreatic islets. Diabetes. 2011;60:1535–1543. [DOI] [PMC free article] [PubMed] [Google Scholar]
- 19. Idevall-Hagren O, Jakobsson I, Xu Y, Tengholm A. Spatial control of Epac2 activity by cAMP and Ca2+-mediated activation of Ras in pancreatic β-cells. Sci Signal. 2013;6:ra29.1–11. [DOI] [PubMed] [Google Scholar]
- 20. Christensen AE, Selheim F, de Rooij J, et al. cAMP analog mapping of Epac1 and cAMP kinase. Discriminating analogs demonstrate that Epac and cAMP kinase act synergistically to promote PC-12 cell neurite extension. J Biol Chem. 2003;278:35394–35402. [DOI] [PubMed] [Google Scholar]
- 21. Vliem MJ, Ponsioen B, Schwede F, et al. 8-pCPT-2′-O-Me-cAMP-AM: an improved Epac-selective cAMP analogue. Chembiochem. 2008;9:2052–2054. [DOI] [PubMed] [Google Scholar]
- 22. Holz GG, Chepurny OG, Schwede F. Epac-selective cAMP analogs: new tools with which to evaluate the signal transduction properties of cAMP-regulated guanine nucleotide exchange factors. Cell Signal. 2008;20:10–20. [DOI] [PMC free article] [PubMed] [Google Scholar]
- 23. Chepurny OG, Kelley GG, Dzhura I, et al. PKA-dependent potentiation of glucose-stimulated insulin secretion by Epac activator 8-pCPT-2′-O-Me-cAMP-AM in human islets of Langerhans. Am J Physiol Endocrinol Metab. 2010;298:E622–E633. [DOI] [PMC free article] [PubMed] [Google Scholar]
- 24. Nenquin M, Szollosi A, Aguilar-Bryan L, Bryan J, Henquin JC. Both triggering and amplifying pathways contribute to fuel-induced insulin secretion in the absence of sulfonylurea receptor-1 in pancreatic β-cells. J Biol Chem. 2004;279:32316–32324. [DOI] [PubMed] [Google Scholar]
- 25. Detimary P, Jonas JC, Henquin JC. Stable and diffusible pools of nucleotides in pancreatic islet cells. Endocrinology. 1996;137:4671–4676. [DOI] [PubMed] [Google Scholar]
- 26. Henquin JC. Triggering and amplifying pathways of regulation of insulin secretion by glucose. Diabetes. 2000;49:1751–1760. [DOI] [PubMed] [Google Scholar]
- 27. Tsalkova T, Mei FC, Li S, et al. Isoform-specific antagonists of exchange proteins directly activated by cAMP. Proc Natl Acad Sci USA. 2012;109:18613–18618. [DOI] [PMC free article] [PubMed] [Google Scholar]
- 28. Rehmann H. Epac-inhibitors: facts and artefacts. Sci Rep. 2013;3:3032. [DOI] [PMC free article] [PubMed] [Google Scholar]
- 29. Kai AK, Lam AK, Chen Y, et al. Exchange protein activated by cAMP 1 (Epac1)-deficient mice develop β-cell dysfunction and metabolic syndrome. FASEB J. 2013;27:4122–4135. [DOI] [PubMed] [Google Scholar]
- 30. Jonas JC, Gilon P, Henquin JC. Temporal and quantitative correlations between insulin secretion and stably elevated or oscillatory cytoplasmic Ca2+ in mouse pancreatic β-cells. Diabetes. 1998;47:1266–1273. [DOI] [PubMed] [Google Scholar]
- 31. Zhang CL, Katoh M, Shibasaki T, et al. The cAMP sensor Epac2 is a direct target of antidiabetic sulfonylurea drugs. Science. 2009;325:607–610. [DOI] [PubMed] [Google Scholar]
- 32. Takahashi T, Shibasaki T, Takahashi H, et al. Antidiabetic sulfonylureas and cAMP cooperatively activate Epac2A. Sci Signal. 2013;6:ra94. [DOI] [PubMed] [Google Scholar]
- 33. Mourad NI, Nenquin M, Henquin JC. cAMP-mediated and metabolic amplification of insulin secretion are distinct pathways sharing independence of β-cell microfilaments. Endocrinology. 2012;153:4644–4654. [DOI] [PubMed] [Google Scholar]
- 34. Kelley GG, Chepurny OG, Schwede F, et al. Glucose-dependent potentiation of mouse islet insulin secretion by Epac activator 8-pCPT-2′-O-Me-cAMP-AM. Islets. 2009;1:260–265. [DOI] [PMC free article] [PubMed] [Google Scholar]
- 35. Song WJ, Seshadri M, Ashraf U, et al. Snapin mediates incretin action and augments glucose-dependent insulin secretion. Cell Metab. 2011;13:308–319. [DOI] [PMC free article] [PubMed] [Google Scholar]
- 36. Kaihara KA, Dickson LM, Jacobson DA, et al. β-Cell-specific protein kinase A activation enhances the efficiency of glucose control by increasing acute-phase insulin secretion. Diabetes. 2013;62:1527–1536. [DOI] [PMC free article] [PubMed] [Google Scholar]
- 37. Jarrard RE, Wang Y, Salyer AE, et al. Potentiation of sulfonylurea action by an EPAC-selective cAMP analog in INS-1 cells: comparison of tolbutamide and gliclazide and a potential role for EPAC activation of a 2-APB-sensitive Ca2+ influx. Mol Pharmacol. 2013;83:191–205. [DOI] [PMC free article] [PubMed] [Google Scholar]
- 38. Idevall-Hagren O, Barg S, Gylfe E, Tengholm A. cAMP mediators of pulsatile insulin secretion from glucose-stimulated single β-cells. J Biol Chem. 2010;285:23007–23018. [DOI] [PMC free article] [PubMed] [Google Scholar]
- 39. Hatakeyama H, Kishimoto T, Nemoto T, Kasai H, Takahashi N. Rapid glucose sensing by protein kinase A for insulin exocytosis in mouse pancreatic islets. J Physiol. 2006;570:271–282. [DOI] [PMC free article] [PubMed] [Google Scholar]
- 40. Shibasaki T, Takahashi H, Miki T, et al. Essential role of Epac2/Rap1 signaling in regulation of insulin granule dynamics by cAMP. Proc Natl Acad Sci USA. 2007;104:19333–19338. [DOI] [PMC free article] [PubMed] [Google Scholar]
- 41. Henquin JC, Schmeer W, Meissner HP. Forskolin, an activator of adenylate cyclase, increases Ca2+-dependent electrical activity induced by glucose in mouse pancreatic β-cells. Endocrinology. 1983;112:2218–2220. [DOI] [PubMed] [Google Scholar]
- 42. Grapengiesser E, Gylfe E, Hellman B. Cyclic AMP as a determinant for glucose induction of fast Ca2+ oscillations in isolated pancreatic β-cells. J Biol Chem. 1991;266:12207–12210. [PubMed] [Google Scholar]
- 43. Yada T, Itoh K, Nakata M. Glucagon-like peptide-1-(7–36)amide and a rise in cyclic adenosine 3′,5′-monophosphate increase cytosolic free Ca2+ in rat pancreatic β-cells by enhancing Ca2+ channel activity. Endocrinology. 1993;133:1685–1692. [DOI] [PubMed] [Google Scholar]
- 44. Leech CA, Dzhura I, Chepurny OG, et al. Molecular physiology of glucagon-like peptide-1 insulin secretagogue action in pancreatic β cells. Prog Biophys Mol Biol. 2011;107:236–247. [DOI] [PMC free article] [PubMed] [Google Scholar]
- 45. Tamagawa T, Niki H, Niki A. Insulin release independent of a rise in cytosolic free Ca2+ by forskolin and phorbol ester. FEBS Lett. 1985;183:430–432. [DOI] [PubMed] [Google Scholar]
- 46. Jones PM, Fyles JM, Howell SL. Regulation of insulin secretion by cAMP in rat islets of Langerhans permeabilised by high-voltage discharge. FEBS Lett. 1986;205:205–209. [DOI] [PubMed] [Google Scholar]
- 47. Ammälä C, Ashcroft FM, Rorsman P. Calcium-independent potentiation of insulin release by cyclic AMP in single β-cells. Nature. 1993;363:356–358. [DOI] [PubMed] [Google Scholar]
- 48. Gillis KD, Misler S. Enhancers of cytosolic cAMP augment depolarization-induced exocytosis from pancreatic B-cells: evidence for effects distal to Ca2+ entry. Pflügers Arch. 1993;424:195–197. [DOI] [PubMed] [Google Scholar]
- 49. Eliasson L, Ma X, Renström E, et al. SUR1 regulates PKA-independent cAMP-induced granule priming in mouse pancreatic B-cells. J Gen Physiol. 2003;121:181–197. [DOI] [PMC free article] [PubMed] [Google Scholar]
- 50. Gaisano HY. Here come the newcomer granules, better late than never. Trends Endocrinol Metab. 2014;25:381–388. [DOI] [PubMed] [Google Scholar]
- 51. Herbst KJ, Coltharp C, Amzel LM, Zhang J. Direct activation of Epac by sulfonylurea is isoform selective. Chem Biol. 2011;18:243–251. [DOI] [PMC free article] [PubMed] [Google Scholar]
- 52. Tsalkova T, Gribenko AV, Cheng X. Exchange protein directly activated by cyclic AMP isoform 2 is not a direct target of sulfonylurea drugs. Assay Drug Dev Technol. 2011;9:88–91. [DOI] [PMC free article] [PubMed] [Google Scholar]
- 53. Rehmann H. Epac2: a sulfonylurea receptor? Biochem Soc Trans. 2012;40:6–10. [DOI] [PubMed] [Google Scholar]
- 54. Garcia-Barrado MJ, Jonas JC, Gilon P, Henquin JC. Sulphonylureas do not increase insulin secretion by a mechanism other than a rise in cytoplasmic Ca2+ in pancreatic β-cells. Eur J Pharmacol. 1996;298:279–286. [DOI] [PubMed] [Google Scholar]
- 55. Gembal M, Detimary P, Gilon P, Gao ZY, Henquin JC. Mechanisms by which glucose can control insulin release independently from its action on adenosine triphosphate-sensitive K+ channels in mouse β-cells. J Clin Invest. 1993;91:871–880. [DOI] [PMC free article] [PubMed] [Google Scholar]
- 56. Yajima H, Komatsu M, Schermerhorn T, et al. cAMP enhances insulin secretion by an action on the ATP-sensitive K+ channel-independent pathway of glucose signaling in rat pancreatic islets. Diabetes. 1999;48:1006–1012. [DOI] [PubMed] [Google Scholar]
- 57. Kasai H, Hatakeyama H, Ohno M, Takahashi N. Exocytosis in islet β-cells. Adv Exp Med Biol. 2010;654:305–338. [DOI] [PubMed] [Google Scholar]
- 58. Wan QF, Dong Y, Yang H, Lou X, Ding J, Xu T. Protein kinase activation increases insulin secretion by sensitizing the secretory machinery to Ca2+. J Gen Physiol. 2004;124:653–662. [DOI] [PMC free article] [PubMed] [Google Scholar]
- 59. Yang Y, Gillis KD. A highly Ca2+-sensitive pool of granules is regulated by glucose and protein kinases in insulin-secreting INS-1 cells. J Gen Physiol. 2004;124:641–651. [DOI] [PMC free article] [PubMed] [Google Scholar]