

Abstract
Context:
Leptin is a key regulator of energy intake and expenditure. Individuals with congenital leptin deficiency demonstrate structural and functional brain changes when given leptin. However, whether acquired leptin deficiency may operate similarly is unclear.
Objective:
We set out to determine whether the brains of individuals with acquired leptin deficiency may react to leptin in a similar manner.
Design:
We used functional magnetic resonance imaging before and after short- and long-term metreleptin treatment in three leptin-sensitive patients with acquired hypoleptinemia. Nine healthy women were scanned as normoleptinemic controls.
Setting:
The setting was an academic medical center.
Patients or Other Participants:
The participants were 3 hypoleptinemic women and nine normoleptinemic, matched women.
Interventions:
We used metreleptin, recombinant leptin, therapy for 24 weeks in hypoleptinemic women only.
Main Outcome Measure:
We measured neural changes in response to viewing food as compared to nonfood images. We hypothesized that metreleptin treatment would increase brain activity in areas related to cognitive control and inhibition and would decrease brain activity in areas related to reward processing, as compared to the normoleptinemic counterparts.
Results:
Unlike patients with congenital leptin deficiency, hypoleptinemic patients demonstrated no structural brain differences from healthy controls and/or structural changes in response to treatment. Short-term metreleptin treatment in leptin-sensitive hypoleptinemic subjects enhances areas involved in detecting the salience and rewarding value of food during fasting, whereas long-term treatment decreases attention to food and the rewarding value of food after feeding. Furthermore, hypothalamic activity is modulated by metreleptin treatment, and leptin decreases functional connectivity of the hypothalamus to key feeding-related areas in these hypoleptinemic subjects.
Conclusions:
Leptin replacement in acutely hypoleptinemic women did not alter brain structure but did alter functional cortical activity to food cues in key feeding and reward-related areas.
Leptin is an adipocyte-secreted hormone that fluctuates with changes in caloric intake and circulates at levels proportional to the amount of body fat (1). Leptin receptors are expressed throughout the central nervous system, where leptin acts to regulate feeding behavior and energy expenditure (2). Although leptin administration in obese mice has been shown to cause weight loss (3, 4), most obese individuals are leptin resistant (1, 2, 5–7).
How food processing is affected in leptin-sensitive states, such as the rare individuals with congenital leptin deficiency or, even more importantly, normal subjects with acquired leptin deficiency, may provide insights as to leptin's physiological actions in the brain. In a patient with congenital leptin deficiency, acute (3 d) and long-term (6 mo) leptin replacement decreased activity in the amygdala and the substantia nigra but increased activity in the orbitofrontal cortex, all areas involved in reward processing, for food as compared to nonfood images (8). In another two patients with this same disorder, leptin replacement for 7 days decreased brain activation in response to food images in several striatal regions, including the nucleus accumbens, caudate, putamen, and globus pallidus (9). These studies suggest that in leptin deficiency, leptin replacement may influence neuronal circuitry related to the perception of food reward. As far as structural brain differences, congenitally leptin-deficient mice and humans both have smaller brains and less gray matter, which can be corrected with leptin administration (10–14).
To date, no study has examined how leptin replacement may affect brain activity in patients with acquired leptin deficiency that did not occur during developmental stages of the individual's brain. Thus, we sought to study whether, similar to congenital leptin deficiency, structural changes may also occur in response to acquired leptin deficiency and how leptin replacement may alter brain activation in response to viewing food images in patients who have an acquired leptin deficiency. In this study, we administered metreleptin to three patients with acquired leptin deficiency of at least 6 months duration and compared them to nine normoleptinemic controls, matched for age and gender, who did not receive metreleptin. Patients were scanned with functional magnetic resonance imaging (fMRI) at baseline, after short-term leptin replacement (7 d), and after long-term leptin replacement (6 mo) while looking at food and nonfood images in both the fasting and fed states. Their normoleptinemic counterparts were scanned twice, 1 week apart, using the same protocol with food and nonfood images while fasting and while fed. We hypothesized that metreleptin treatment would increase brain activity in areas related to cognitive control and inhibition and would decrease brain activity in areas related to reward processing as compared to their normoleptinemic counterparts.
Subjects and Methods
Three women with acquired hypoleptinemia (defined as fasting leptin levels below 5 ng/mL) provided written informed consent to participate in open-label metreleptin treatment for 12 months with fMRI studies (15). This study was approved by the Beth Israel Deaconess Medical Center Institutional Review Board (IRB), and all ethical policies of the IRB were followed. The cutoff point for hypoleptinemia is based upon prior research (16, 17). Participants were 18–35 years old with hypoleptinemia for at least 6 months (among study participants, this varied between 1.5 and 5 y) coincident with strenuous exercise and/or low body weight without any significant comorbid medical conditions, including eating disorders. Nine healthy, normoleptinemic, right-handed female control subjects also participated in the fMRI portion of the study, without receiving metreleptin treatment. Details of the study design are described elsewhere, and the study reported here was a small substudy within previously reported experiments (15–17). In brief, hypoleptinemic subjects participated first in a 36-week, randomized, placebo-controlled study of metreleptin, followed by a 16-week washout period; they then returned for an open-label study of metreleptin. Throughout the study, participants were instructed to keep their eating and exercise behaviors stable.
All subjects who participated in the fMRI substudy presented herein completed two study visits on two separate days approximately 1 week apart (wk 0 and wk 1). Hypoleptinemic participants began metreleptin treatment after the week 0 visit. They also completed an additional study visit after 24 weeks of metreleptin treatment. During each visit, all participants completed two fMRI scans, one during the fasting state (overnight fasting of at least 12 h) and another during the fed state, following a standardized meal 3 hours after waking up in the morning. The standardized meal consisted of a sandwich, apple, pretzels, and water for a total of approximately 427 kcal. Before and after each scan, participants completed a visual analog scale (VAS) to measure subjective feelings of hunger on a line. Leptin (Millipore) and free leptin (R&D Systems) levels were measured with radioactive immunoassays, as previously described (15–17). Hypoleptinemic participants also underwent a dual-energy x-ray absorptiometry analysis at baseline and 24 weeks, which provides data on body fat mass.
Participants were presented blocks of either food or nonfood images through a projector system, randomized and viewed within the scanner through a mirror. Images were carefully selected by a psychologist to be neutral to pleasant, not reminiscent of other salient images (eg, faces), and similar in complexity (eg, color, clarity).
All brain image acquisitions were executed using a GE 3.0 Tesla Signa scanner with the eight-channel head coil (GE Healthcare). In each session, blood oxygenation level dependent (BOLD) imaging was conducted using echo-planar imaging with echo time/repetition time of 35/3000 ms, using a 24-cm field of view over a 64 × 64 matrix, resulting in an in-plane resolution of 3.1 × 3.1 mm2 over 32 axial slices of 5-mm thickness without a gap. In addition, a high-resolution T1-weighted magnetization prepared rapid gradient echo (MPRAGE) structural volumetric magnetic resonance image was acquired. Structural T1-weighted MPRAGE images were normalized to a template using DARTEL normalization and segmented, then smoothed with a Gaussian kernel of 6 mm. A two-sample t test compared the images of the two groups, and a paired t test compared before- and after-treatment structural images.
BOLD data were preprocessed using the Statistical Parametric Mapping, version 8, or SPM8 (The Wellcome Trust Centre of Neuroimaging). Briefly, images of each individual subject were first realigned (motion-corrected); then normalized to an echo-planar imaging template with affine registration; followed by nonlinear transformation, which was applied to the functional images; and finally smoothed with a Gaussian kernel of 8 mm. A general linear model was constructed for each individual subject, using the onsets of the food or nonfood image blocks with realignment parameters in six dimensions. The data were high-pass filtered to remove low-frequency signal drifts. The contrast images of the first-level analysis were used for the second-level group statistics.
To better understand changes in hypothalamic activation with metreleptin treatment, an additional region of interest (ROI) analysis was performed to extract effect sizes from the hypothalamus. This hypothalamic ROI was defined based on a previous experiment (18) and was created with a sphere in MarsBaR (http://marsbar.sourceforge.net), a center defined by this previous experiment and a 10-mm radius.
Psychophysiological interaction (PPI) describes how functional connectivity between brain regions is altered as a result of psychological variables (19). Briefly, in PPI, the condition onset times for food and nonfood image blocks are separately convolved with the canonical hemodynamic response function for each condition, forming the psychological regressors. The selected ROI (hypothalamus) composes the physiological variable. The interaction term was computed by multiplying the time series from the psychological regressors with the physiological variable. This interaction term and the resultant images for each subject were then used in a two-sample t test.
Results
Hypoleptinemic and healthy normoleptinemic participants did not differ in terms of age or body mass index (Table 1). Hypoleptinemic participants lost some body fat mass between baseline (15.0 ± 1.8 kg) and 24 weeks (12.0 ± 1.7 kg; t = 5.61; P < .03). Free leptin levels were lower at baseline in hypoleptinemic women and significantly increased in hypoleptinemic women as compared to controls after treatment (t = 1.69, P < .06; and t = 21.3, P < .000, respectively). At baseline (wk 0), hypoleptinemic women also had significantly higher ratings of hunger (VAS) while fasting than their healthy counterparts (t = 2.94; P < .01), a difference that disappeared with metreleptin treatment.
Table 1.
Participant Demographics and VAS Ratings
| Participants | Age, y | BMI, kg/m2 | Leptin | Free Leptin | Appetite Scores |
||
|---|---|---|---|---|---|---|---|
| Fasting State | Fed State | ||||||
| HL (n = 3) | 24.3 ± 2.9 | 21.7 ± 0.9 | Wk 0 | 4.1 ± 1.7 | 1.2 ± 0.5a | 15.5 ± 0.8d | 5.8 ± 4.9c |
| Wk 1 | 11.5 ± 5.4 | 3.0 ± 0.4c | |||||
| Wk 24 | 92.2 ± 10.7b | 73.4 ± 12.7b | 9.5 ± 7.5 | 3.8 ± 3.9 | |||
| Control (n = 9) | 26.7 ± 2.9 | 22.1 ± 1.9 | Wk 0 | 6.8 ± 5.6 | 6.8 ± 5.6 | 9.0 ± 4.5 | 4.7 ± 2.4c |
| Wk 1 | 6.9 ± 4.7 | 6.9 ± 4.7 | 8.4 ± 4.3 | 3.5 ± 2.0c | |||
Abbreviation: BMI, body mass index. Data are expressed as mean ± SD.
Free leptin at baseline differs from controls at P < .06.
Leptin levels differ from controls with P < .000.
VAS fed state score different from fasting state at P < .05.
VAS for HL differs from control at P < .05.
Structural voxel-based morphometry
There were no significant structural differences between hypoleptinemic women and healthy controls at baseline or at later time points.
Brain responses to food images
At baseline (wk 0) while fasting, hypoleptinemic subjects appear to have no activations significantly different from controls in response to viewing food as compared to nonfood images (Figure 1A). After consuming a meal in the fed state at baseline, hypoleptinemic women show greater activation in precuneus, insula, and dorsolateral prefrontal cortices and less activation in insula in response to viewing food as compared to nonfood images than their healthy counterparts (Figure 1B).
Figure 1.
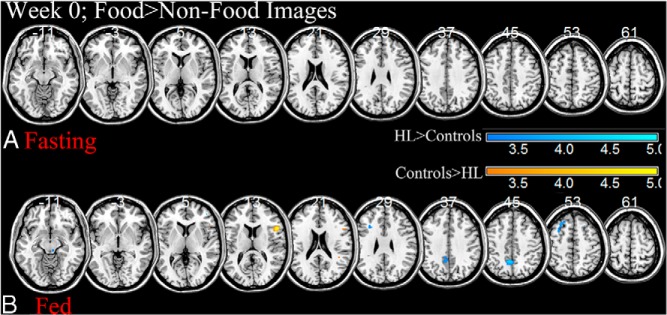
Two sample t tests at baseline between patients with untreated hypoleptinemia (HL) and their healthy counterparts when viewing food as compared to nonfood images during the fasting (A) or fed (B) state at P < .005, uncorrected; HL> controls, cool colors; controls > HL, warm colors. BOLD contrasts are superimposed on a T1 structural image in axial sections from z = −11 to z = 61, in neurological orientation. The adjacent sections are 8 mm apart. The color bar represents voxel T value. R, right; L, left; HL, hypoleptinemia.
After short-term leptin treatment (week 1–week 0), hypoleptinemic women showed greater activations in bilateral insula, dorsolateral prefrontal, and medial frontal cortices than controls in response to viewing food as compared to nonfood images when fasting, primarily due to increases in activation in these areas in hypoleptinemic women (P < .001, uncorrected; Figure 2A and Table 2). At this same time point in the fed state, hypoleptinemic women show less activation in the precuneus, middle frontal, thalamic, insular, and parahippocampal cortices, due to decreases in activation in the hypoleptinemic women (P < .001, uncorrected; Figure 2B and Table 2).
Figure 2.

Flexible factorial analyses between patients with hypoleptinemia (HL) who have been treated with metreleptin for 1 week and their healthy counterparts when viewing food as compared to nonfood images during the fasting (A) or fed (B) state at P < .001, uncorrected; HL > controls, cool colors; and controls > HL, warm colors. The same analysis is performed for changes after 24 weeks of metreleptin treatment in the fasting (C) and fed (D) states. BOLD contrasts are superimposed on a T1 structural image in axial sections from z = −11 to z = 61, in neurological orientation. The adjacent sections are 8 mm apart. The color bar represents voxel F value. R, right; L, left; HL, hypoleptinemia.
Table 2.
Brain Regions Showing Significant Differences to Food as Compared to Nonfood Images Between Participants With Hypoleptinemia and Their Healthy Counterparts
| Cluster Size (Voxels) | Voxel Z Value | MNI Coordinates, mm |
Side | Identified Region | General Brain Area | |||
|---|---|---|---|---|---|---|---|---|
| X | Y | Z | ||||||
| Wk 1–Wk 0 | ||||||||
| Fasting state (Figure 2A) | ||||||||
| HL > controls | 194 | 4.15 | −38 | 6 | 44 | L | Middle frontal G | Dorsolateral prefrontal |
| 29 | 3.8 | 36 | −72 | −20 | R | Cerebellum | Cerebellum | |
| 57 | 3.74 | 44 | 26 | 6 | R | Inferior frontal G | Insula | |
| 1030a | 3.62 | 22 | 50 | 46 | R | Superior frontal G | Medial prefrontal | |
| 3.31 | −8 | 54 | 46 | C | Frontopolar | Medial prefrontal | ||
| 187 | 3.37 | −50 | 22 | 0 | L | Inferior frontal G | Insula | |
| 392 | 3.28 | 54 | 18 | 28 | R | Middle frontal G | Dorsolateral prefrontal | |
| 37 | 3.15 | −38 | −60 | −30 | L | Cerebellum | Cerebellum | |
| 29 | 3.12 | 42 | 24 | −16 | R | Inferior frontal G | Inferior prefrontal | |
| 80 | 3.09 | −64 | −48 | 34 | L | Supramarginal G | Parietal cortex | |
| 13 | 2.99 | −6 | 34 | 62 | C | Frontopolar | Medial prefrontal | |
| Controls > HL | 24 | 3.1 | 16 | 10 | 58 | R | Superior frontal G | Dorsolateral prefrontal |
| 34 | 3.07 | 14 | −32 | 58 | R | Pre-central G | Motor cortex | |
| 14 | 3.06 | −16 | −86 | 20 | L | Cuneus | Cuneus | |
| Fed state (Figure 2B) | ||||||||
| HL > controls | 10 | 3.03 | 30 | −80 | 48 | R | Superior occipital G | Visual cortex |
| Controls > HL | 157 | 3.56 | 14 | −54 | 50 | R | Precuneus | Precuneus |
| 30 | 3.2 | −34 | −26 | −10 | L | Parahippocampal G | Hippocampus | |
| 2.62 | −42 | −18 | −10 | L | Insula | Insula | ||
| 38 | 3.07 | 8 | −26 | −12 | C | Midbrain | Midbrain | |
| 35 | 3 | −10 | −50 | −26 | L | Cerebellum | Cerebellum | |
| Wk 24–Wk 0 | ||||||||
| Fasting state (Figure 2C) | ||||||||
| HL > controls | 13 | 3.47 | 36 | −72 | −20 | R | Cerebellum | Cerebellum |
| 235 | 3.46 | −48 | 28 | −4 | L | Inferior frontal G | Insula | |
| 15 | 3.07 | 18 | −28 | 6 | R | Thalamus | Thalamus | |
| 54 | 3.04 | −40 | 8 | 44 | L | Middle frontal G | Lateral prefrontal | |
| Controls > HL | No significant voxels | |||||||
| Fed state (Figure 2D) | ||||||||
| HL > controls | No significant voxels | |||||||
| Controls > HL | 2002a | 4.34 | −2 | −52 | 44 | C | Precuneus | Precuneus |
| 619a | 3.84 | 44 | −54 | 36 | R | Supramarginal G | Parietal cortex | |
| 3.61 | 44 | −58 | 46 | R | Inferior parietal G | Parietal cortex | ||
| 882a | 3.82 | 8 | −26 | −14 | C | Midbrain | Midbrain | |
| 609a | 3.71 | −46 | −46 | 32 | L | Supramarginal G | Parietal cortex | |
| 3.04 | −42 | −52 | 62 | L | Superior parietal G | Parietal cortex | ||
| 2.91 | −54 | −48 | 42 | L | Inferior parietal G | Parietal cortex | ||
| 607a | 3.52 | −6 | −76 | −12 | C | Cerebellum | Cerebellum | |
| 3.26 | −12 | −84 | 14 | L | Cuneus | Cuneus | ||
| 506a | 3.42 | −16 | 34 | 52 | L | Superior frontal G | Dorsolateral prefrontal | |
| 3.16 | −28 | 20 | 32 | L | Middle frontal G | Dorsolateral prefrontal | ||
| 199 | 3.34 | 20 | 36 | 46 | R | Middle frontal G | Dorsolateral prefrontal | |
| 2.63 | 22 | 28 | 48 | R | Superior frontal G | Dorsolateral prefrontal | ||
| 302 | 3.31 | 28 | −64 | 0 | R | Middle occipital G | Visual cortex | |
| 2.96 | 14 | −80 | 4 | R | Cuneus | Cuneus | ||
| 277 | 3.24 | 2 | −18 | 40 | C | Mid-cingulate G | Mid-cingulate cortex | |
| 59 | 3.21 | −10 | −50 | −26 | L | Cerebellum | Cerebellum | |
| 36 | 3.08 | −20 | −28 | 6 | L | Thalamus | Thalamus | |
| 35 | 3.07 | −38 | 12 | 36 | L | Middle frontal G | Dorsal prefrontal | |
| 47 | 3.04 | −36 | −78 | 40 | L | Precuneus | Precuneus | |
| 29 | 2.99 | −10 | −52 | 74 | L | Post-central G | Somatosensory cortex | |
Abbreviations: HL, hypoleptinemia; G, gyrus; L, left; R, right; C, center. Statistical threshold, P < .001, uncorrected; extent, 10 voxels; flexible factorial, at voxel P < .001, uncorrected. Peaks shown for clusters are the most significant for the same identified region.
Significant at P < .05, false discovery rate corrected for cluster.
After long-term leptin treatment (week 24–week 0), while fasting, hypoleptinemic women show greater activations in insular and inferior frontal cortices in response to viewing food as compared to nonfood images than healthy controls (P < .001, uncorrected; Figure 2C and Table 2). During the fed state, hypoleptinemic women show less activations in midbrain, cuneus, midcingulate, bilateral parietal, and superior prefrontal cortices, due to strong decreases in activation in these areas in hypoleptinemic women at week 24 (P < .001, uncorrected; Figure 2D and Table 2).
Activation and functional connectivity of the hypothalamus
During fasting, hypothalamic activation increased with metreleptin treatment in hypoleptinemic women over time to where it was higher than the healthy controls while viewing food as compared to nonfood images. During the fed state, hypothalamic activation was higher in untreated hypoleptinemic women than controls while viewing food as compared to nonfood images, but this decreased with metreleptin treatment over time (Figure 3A).
Figure 3.

ROI analysis of the hypothalamus, shown in red, reveals an increase in hypothalamic activation during the fasting state with metreleptin treatment in patients with hypoleptinemia (HL) and a decrease during the fed state (A). Error bars represent standard deviation. The hypothalamus also shows significant differences in PPI connectivity after 1 week of metreleptin treatment (B) at P < .001, uncorrected; HL > controls, cool colors; and controls > HL, warm colors. BOLD contrasts are superimposed on a T1 structural image in axial sections from z = −11 to z = 61, in neurological orientation. The adjacent sections are 8 mm apart. The color bar represents voxel T value. R, right; L, left; HL, hypoleptinemia.
Using PPI with hypothalamic activation as the physiological variable and food as compared to nonfood images as the psychological variable, we saw that controls had greater functional connectivity of the hypothalamus to bilateral insula, primary motor cortex, and midcingulate cortex during the fed state than hypoleptinemic women after short-term leptin treatment (Figure 3B and Table 3). There were no significant differences during fasting at any time point (wk 0, 1, or 24) or during the fed state at other time points (wk 0 or 24).
Table 3.
Brain Regions Showing Significant PPI Connectivity With the Hypothalamus to Food as Compared to Nonfood Images Between Participants With Hypoleptinemia and Their Healthy Counterparts
| Cluster Size (Voxels) | Voxel Z Value | MNI Coordinates (mm) |
Side | Identified Region | General Brain Area | |||
|---|---|---|---|---|---|---|---|---|
| X | Y | Z | ||||||
| Wk 1 Fed State (Figure 3B) | ||||||||
| HL > controls | 21 | 3.71 | −44 | −68 | 38 | L | Inferior parietal G | Parietal cortex |
| 24 | 3.57 | −34 | 24 | −26 | L | Superior temporal G | Temporal cortex | |
| 84 | 3.56 | 32 | 62 | 8 | R | Middle frontal G | lateral prefrontal | |
| 22 | 3.32 | −44 | −84 | 22 | L | Middle temporal G | Temporal cortex | |
| 36 | 3.2 | −20 | 56 | 26 | L | Superior frontal G | Dorsal prefrontal | |
| 15 | 3.17 | 12 | −96 | 28 | R | Cuneus | Cuneus | |
| 11 | 3.09 | −54 | −74 | 8 | L | Middle temporal G | Temporal cortex | |
| Controls > HL | 590a | 4.42 | 46 | −16 | 40 | R | Precentral G | Motor cortex |
| 3.12 | 38 | −24 | 34 | R | Postcentral G | Somatosensory cortex | ||
| 864a | 4.38 | 12 | −4 | 38 | R | Mid-cingulate G | Mid-cingulate cortex | |
| 1135a | 3.81 | 30 | −6 | 18 | R | Insula | Insula | |
| 54 | 3.45 | −46 | −10 | 2 | L | Insula | Insula | |
| 77 | 3.45 | 54 | −8 | −28 | R | Inferior temporal G | Temporal cortex | |
| 32 | 3.41 | −60 | −12 | 6 | L | Superior temporal G | Temporal cortex | |
| 118 | 3.32 | −40 | −62 | 8 | L | Middle temporal G | Temporal cortex | |
| 76 | 3.17 | −40 | −30 | 2 | L | Superior temporal G | Temporal cortex | |
| 52 | 3.1 | −14 | −2 | 68 | L | Superior frontal G | Dorsomedial prefrontal | |
| 18 | 2.99 | −30 | 4 | 8 | L | Globus pallidus | Globus pallidus | |
Abbreviations: G, gyrus; L, left; R, right. Statistical threshold, two-sample t test at voxel P < .001, uncorrected; extent, 10 voxels. Peaks shown for clusters are the most significant for the same identified region.
Clusters significant at P < .05, false discovery rate corrected for cluster.
Correlations with clinical outcomes
The changes in free leptin levels from week 0 to week 1 significantly correlated with the changes in activation in the medial prefrontal cortex, insula, and right and left dorsolateral prefrontal cortex during the fasting state (r = 0.66, P < .01; r = 0.71, P < .003; r = 0.58, P < .03; r = 0.62, P < .01, respectively). Changes in leptin levels also correlated with the changes in activations in the left parietal cortex and midbrain during the fed state (r = −.56, P < .03; r = 0.55, P < .03, respectively). Additionally, for hypoleptinemic women only, the change in free leptin levels at 24 weeks correlated with changes in activation of the left dorsolateral prefrontal cortex in the fasting state (r = 0.997; P < .03).
During the fasting state with short-term metreleptin treatment, changes in insular activation inversely correlated with changes in VAS ratings for hypoleptinemic women, meaning that a greater decrease in hunger ratings indicated a greater increase in insular activation (r = −.983; P < .05). During the fed state with long-term metreleptin treatment, the changes in activation in midbrain, occipital/cerebellar cortices, right parietal, and right superior prefrontal cortices correlated with the change in postfed VAS ratings for hypoleptinemic women (r = 0.999, P < .005; r = 0.986, P < .1; r = −.999, P < .005; r = 0.981, P < .05, respectively). The change in activation in the hypothalamus during the fasting state at week 24 correlated with the change in the postfed VAS ratings in hypoleptinemic women (r = 0.991; P < .04). The change in activation in the hypothalamus during the fed state at week 1 correlated with the change in the postfed VAS ratings in hypoleptinemic women (r = 0.984; P < .05).
Notably, the duration of hypoleptinemia and body fat mass changes did not correlate with any brain activations or with any other hormonal variables.
Discussion
Hypoleptinemic women do not have structural brain differences in comparison to controls
In this study, we did not detect any differences between the structural images of the hypoleptinemic women and their healthy counterparts and/or any changes over time in response to metreleptin therapy. Unlike congenital leptin deficiency, patients with hypoleptinemia, who had developed normally during early life with leptin present and became leptin deficient later in life, had structurally normal brains. Leptin-deficient mice, whose deficiency is caused congenitally either by a lack of leptin or a functional leptin receptor, have both decreased brain weight and cortical volume that can be corrected with early leptin administration (10, 14, 20). Similarly, in three congenitally leptin-deficient human adults, leptin treatment has been shown to increase gray matter volume in cerebellum, inferior parietal, and anterior cingulate cortices (13). In this study, it is likely that exposure to leptin during brain development allowed for normal brain size, even in a later leptin-deficient state. Thus, availability of leptin during early stages of development increases brain volumes to control levels, overshadowing small changes, if any, with later leptin deficiency and subsequent metreleptin therapy.
Leptin alters the brain's responses to food images in hypoleptinemic women
Short-term (1 wk) metre leptin treatment increased insular, medial prefrontal, and dorsolateral prefrontal cortices in hypoleptinemic women as compared to healthy controls in response to viewing food images during a fasting state (for summary, see Supplemental Table 1). Insula frequently shows activation to food as compared to nonfood images (21–23). Because insula also appears to be modulated by ratings of appetite and by whether the participant is in the fed or fasting state (22, 23), it seems to be consistently involved in the salience of food images, consistent with its activity during nonfood salient stimuli (24). Medial prefrontal cortex contributes to the guidance of goal-directed behavior and control of affect as seen in lesion studies of human and nonhuman primates (25–29). Similar areas have been seen to activate when participants make evaluative judgments (30). For instance, Castelli et al (31) saw activation of the medial prefrontal cortex to the perceiving of intentions in silent complex movement patterns where participants ascribed thoughts and activities onto the characters. Another function of medial prefrontal cortices appears to be inhibition of unrewarded or inappropriate behaviors and the inhibition of food intake (32, 33). Similarly, dorsolateral prefrontal cortex is well known to be involved in attention to salient stimuli and the anticipation of reward and monitoring of consequences (34, 35). For instance, in tasks where participants had to choose to eat or not to eat food items based on taste and health values, both medial prefrontal and dorsolateral prefrontal cortices were modulated by decision values, regardless of valence (34, 35). Taken altogether, short-term metreleptin treatment may enhance the activity in these decision-related evaluative prefrontal areas in leptin-deficient patients when fasting, and thus when food would be more salient.
With long-term metre leptin treatment (24 wk), hypoleptinemic women still show greater activation of the insula during fasting in response to viewing food as compared to nonfood images, likely due to the enhancement of the salience of food images as discussed above. In the fed state, however, they show significantly less activation in precuneus, bilateral parietal, dorsolateral, and midbrain cortices in response to viewing food as compared to nonfood images than their healthy counterparts. Midbrain and dorsolateral prefrontal cortex are likely involved in the rewarding aspect of food (36). Although dorsolateral prefrontal cortex is more involved in the anticipation of reward and monitoring of consequences (34, 35), the midbrain contains dopaminergic neurons that signal a rewarding stimulus, including food (36, 37). Midbrain activations have been seen in previous tasks with food images, particularly in individuals who are more sensitive to rewards (38, 39). The strong decreases in activation in these areas in hypoleptinemic women after long-term treatment may indicate that leptin significantly decreases the rewarding value of food after a meal. Precuneus and parietal cortices are more likely involved in attending to the food stimuli. Considering that after a meal and with metreleptin treatment food would be less salient, a decrease in activation in these attention-related areas would make sense. The precuneus and parietal cortices are a well-known part of the frontoparietal attention network and have been shown to correlate with salience (40–44). Activity in precuneus has also been shown to decrease after weight loss and correlate with reduced hunger in another study, which relates to the action of leptin in hunger suppression and the similar activation decrease in our study (42). Pre-weight loss parietal activations to high-calorie foods inversely correlated with weight loss in another fMRI study, suggesting that higher attention and salience on food images led to less weight loss (45). Altogether, these results suggest that with long-term leptin treatment and after a meal, hypoleptinemic women show decreases in areas related to the salience and reward processing of visual food stimuli.
Hypothalamic activity changes with metreleptin administration
With metreleptin administration, activation of hypothalamus in response to viewing food as compared to nonfood images increased above control levels during the fasting state. On the other hand, although fed-state, baseline hypothalamic activity was greater than controls in response to viewing food as compared to nonfood images, it decreased to control levels by 24 weeks of leptin administration. These findings may be a result of increased leptin sensitivity due to leptin deficiency, whereby leptin receptors are up-regulated. For instance, leptin-deficient mice show increased expression of the leptin receptor in the hypothalamus (46–48). Assuming a higher level of leptin receptors at baseline when hypoleptinemic women are most leptin sensitive, when leptin levels are increased due to consumption of a meal, the hypothalamus may be more activated due to the increased sensitivity. As these leptin receptor levels are reduced with long-term metreleptin treatment (24 wk), we see the hypothalamic activity return to control levels. As we see in our results, the reverse may be true in the fasting state, where the lack of leptin to activate the increased number of leptin receptors at baseline would thus cause less hypothalamic activity, and more prevalent leptin after long-term metreleptin treatment would increase the level of activation by binding to and activating relatively more leptin receptors.
Altered functional connectivity of the hypothalamus with metreleptin administration
Perhaps more interestingly, after a week of metreleptin treatment in the fed state, we observed less functional connectivity of the hypothalamus in hypoleptinemic women to midcingulate, somatosensory, and insular cortices. In a study of obese patients who had lost weight, leptin given at a dose to return leptin levels to pre-weight loss levels increased connectivity of the hypothalamus with insula to food images (49). A similar area of cingulate cortex was seen to be reduced after weight loss in obese patients and with leptin treatment after weight loss while viewing food images (50). The midcingulate activation may align with the dorsal anterior cingulate cortical activation, which monitors and detects conflict, including errors and is seen in cognitive control tasks (51–53). The insular cortex more likely conveys information about the salience of food images (21–25). Other groups have seen somatosensory cortex activating to food images when comparing low-calorie to high-calorie food images in healthy, normal-weight adults (54). This functional connection from the hypothalamus may thus indicate the general pathway of feeding behavior. Overall, decreased functional connectivity from hypothalamus to insular, midcingulate, and somatosensory cortices in these hypoleptinemic women may represent a decreased network of responses to food images when food is less salient—after both metreleptin treatment and a meal.
Implications for leanness and obesity
These findings provide information about the physiology of leptin in the brain above and beyond what animal studies may provide, particularly through evidence of leptin's actions in the prefrontal cortex that cannot be appropriately studied in animals. It remains to be shown in future studies whether leptin's effects are direct, or indirect, through activation of other neuroendocrine pathways. In any case, the controlled nature of this study and the robust statistical evidence despite small numbers provide confidence in the validity of the data that need to be confirmed and expanded in future studies. These results have important implications for leptin's pathophysiology and therapeutic value, providing insights into leptin's actions in the leptin-sensitive state and highlighting potential sites of leptin action, and thus potential loci for leptin resistance, to be studied in the future. At one end of the body-weight spectrum, ie, in cases of extreme leanness such as anorexia nervosa or hypothalamic amenorrhea, individuals are frequently very leptin sensitive and could thus potentially respond strongly to leptin treatment in these brain areas, potentially altering food intake and causing weight loss, which we have recently shown is reversible by decreasing leptin dosage (15, 17). With respect to the other end of weight spectrum, ie, obesity, these novel fMRI data provide insights on which brain areas are potential leptin targets that would be unable to respond to leptin and alter food intake in cases of leptin resistance. Further study of these brain areas in leptin-resistant subjects may allow the development of novel therapeutics that could result in effective weight loss.
Limitations and future directions
One limitation of our study is that for practical reasons we did not have healthy controls return after 24 weeks for a third comparison fMRI scan. However, the changes we report at 24 weeks are driven by strong changes in hypoleptinemic women that could not reflect differences with time between functional images. Although we requested that subjects keep their diet and exercise patterns stable for the duration of the study, the study is also limited by not fully controlling diet outside of scanning days; future studies may want to consider controlling diet over the course of the experiment and not just around the fMRI scans. Another limitation is the relatively small sample size of our patient population. However, considering the rarity of this hypoleptinemic condition and the comparable sample sizes (n = 1 or 3) of similar previously published papers (8, 9), this is not unreasonable. This, as well as the fact that leptin studies have been put on hold by the Food and Drug Administration (FDA) in view of the approval of leptin for generalized lipodystrophy recently, prevented us from using a placebo-controlled study, which could potentially represent changes due to study participation and not metreleptin itself. In the future, when the FDA allows leptin studies to restart, we and others will be able to use the results presented herein for power calculations on which to base future studies. Furthermore, we were unable for practical reasons to control the exact length of hypoleptinemia, which varied from 1.5–5 years in our participants. The length of hypoleptinemia could possibly influence brain changes differentially. However, it is worth noting that no brain activation changes correlated with the length of hypoleptinemia and controlling for the length of hypoleptinemia did not change the MRI findings. Additionally, considering this small sample size, we were unable to study the interactions of leptin with other molecules, which might be potential effectors of brain changes. Because leptin has many downstream effectors, examining how all of these alter neural responses alone would necessitate the performance of future much larger studies. We assume that because the observed effects herein are direct or indirect effects of metreleptin administration, we can attribute them to leptin. In the future, it would also be worthwhile to examine the effects of leptin on both leptin-sensitive lean and obese individuals to determine whether the effects seen in hypoleptinemic women are reflective of leptin, regardless of the specific underlying disorder, before proceeding to compare leptin-sensitive obese with leptin-resistant obese humans.
Acknowledgments
These studies at the Mantzoros group were supported by National Institute of Diabetes and Digestive and Kidney Diseases Grants 58785, 79929, and 81913 and Award 1I01CX000422-01A1 from the Clinical Science Research and Development Service of the VA Office of Research and Development. Funding was also received from the National Institutes of Health–National Center for Research Resources Grant M01-RR-01032 (Harvard Clinical and Translational Science Center).
The content of this article is solely the responsibility of the authors and does not necessarily represent the official views of the National Center for Research Resources or the National Institutes of Health. Amylin Pharmaceuticals supplied recombinant human metreleptin for this study and approved the design of the study, but had no role in study design; conduct of the study; collection, management, analysis, and interpretation of the data; or the preparation, review, or approval of the manuscript.
Disclosure Summary: Dr. CS Mantzoros is a consultant for Astra Zeneca.
Footnotes
- BOLD
- blood oxygenation level dependent
- fMRI
- functional magnetic resonance imaging
- HL
- hypoleptinemia
- PPI
- psychophysiological interaction
- ROI
- region of interest
- VAS
- visual analog scale.
References
- 1. Chan JL, Heist K, DePaoli AM, Veldhuis JD, Mantzoros CS. The role of falling leptin levels in the neuroendocrine and metabolic adaptation to short-term starvation in healthy men. J Clin Invest. 2003;111:1409–1421. [DOI] [PMC free article] [PubMed] [Google Scholar]
- 2. Kelesidis T, Kelesidis I, Chou S, Mantzoros CS. Narrative review: the role of leptin in human physiology: emerging clinical applications. Ann Intern Med. 2010;152:93–100. [DOI] [PMC free article] [PubMed] [Google Scholar]
- 3. Halaas JL, Gajiwala KS, Maffei M, et al. Weight-reducing effects of the plasma protein encoded by the obese gene. Science. 1995;269:543–546. [DOI] [PubMed] [Google Scholar]
- 4. Pelleymounter MA, Cullen MJ, Baker MB, et al. Effects of the obese gene product on body weight regulation in ob/ob mice. Science. 1995;269:540–543. [DOI] [PubMed] [Google Scholar]
- 5. Caro JF, Kolaczynski JW, Nyce MR, et al. Decreased cerebrospinal-fluid/serum leptin ratio in obesity: a possible mechanism for leptin resistance. Lancet. 1996;348:159–161. [DOI] [PubMed] [Google Scholar]
- 6. Ur E, Grossman A, Després JP. Obesity results as a consequence of glucocorticoid induced leptin resistance. Horm Metab Res. 1996;28:744–747. [DOI] [PubMed] [Google Scholar]
- 7. Zakrzewska KE, Cusin I, Sainsbury A, Rohner-Jeanrenaud F, Jeanrenaud B. Glucocorticoids as counterregulatory hormones of leptin: toward an understanding of leptin resistance. Diabetes. 1997;46:717–719. [DOI] [PubMed] [Google Scholar]
- 8. Frank S, Heni M, Moss A, et al. Leptin therapy in a congenital leptin-deficient patient leads to acute and long-term changes in homeostatic, reward, and food-related brain areas. J Clin Endocrinol Metab. 2011;96:E1283–E1287. [DOI] [PubMed] [Google Scholar]
- 9. Farooqi IS, Bullmore E, Keogh J, Gillard J, O'Rahilly S, Fletcher PC. Leptin regulates striatal regions and human eating behavior. Science. 2007;317:1355. [DOI] [PMC free article] [PubMed] [Google Scholar]
- 10. Bereiter DA, Jeanrenaud B. Altered neuroanatomical organization in the central nervous system of the genetically obese (ob/ob) mouse. Brain Res. 1979;165:249–260. [DOI] [PubMed] [Google Scholar]
- 11. Bouret SG, Draper SJ, Simerly RB. Trophic action of leptin on hypothalamic neurons that regulate feeding. Science. 2004;304:108–110. [DOI] [PubMed] [Google Scholar]
- 12. London ED, Berman SM, Chakrapani S, et al. Short-term plasticity of gray matter associated with leptin deficiency and replacement. J Clin Endocrinol Metab. 2011;96:E1212–E1220. [DOI] [PMC free article] [PubMed] [Google Scholar]
- 13. Matochik JA, London ED, Yildiz BO, et al. Effect of leptin replacement on brain structure in genetically leptin-deficient adults. J Clin Endocrinol Metab. 2005;90:2851–2854. [DOI] [PubMed] [Google Scholar]
- 14. Vannucci SJ, Gibbs EM, Simpson IA. Glucose utilization and glucose transporter proteins GLUT-1 and GLUT-3 in brains of diabetic (db/db) mice. Am J Physiol. 1997;272:E267–E274. [DOI] [PubMed] [Google Scholar]
- 15. Sienkiewicz E, Magkos F, Aronis KN, et al. Long-term metreleptin treatment increases bone mineral density and content at the lumbar spine of lean hypoleptinemic women. Metabolism. 2011;60:1211–1221. [DOI] [PubMed] [Google Scholar]
- 16. Welt CK, Chan JL, Bullen J, et al. Recombinant human leptin in women with hypothalamic amenorrhea. N Engl J Med. 2004;351:987–997. [DOI] [PubMed] [Google Scholar]
- 17. Chou SH, Chamberland JP, Liu X, et al. Leptin is an effective treatment for hypothalamic amenorrhea. Proc Natl Acad Sci USA. 2011;108:6585–6590. [DOI] [PMC free article] [PubMed] [Google Scholar]
- 18. Baroncini M, Jissendi P, Balland E, et al. MRI atlas of the human hypothalamus. Neuroimage. 2012;59:168–180. [DOI] [PubMed] [Google Scholar]
- 19. Gitelman DR, Penny WD, Ashburner J, Friston KJ. Modeling regional and psychophysiologic interactions in fMRI: the importance of hemodynamic deconvolution. Neuroimage. 2003;19:200–207. [DOI] [PubMed] [Google Scholar]
- 20. Steppan CM, Swick AG. A role for leptin in brain development. Biochem Biophys Res Commun. 1999;256:600–602. [DOI] [PubMed] [Google Scholar]
- 21. De Silva A, Salem V, Long CJ, et al. The gut hormones PYY 3–36 and GLP-1 7–36 amide reduce food intake and modulate brain activity in appetite centers in humans. Cell Metab. 2011;14:700–706. [DOI] [PMC free article] [PubMed] [Google Scholar]
- 22. Porubská K, Veit R, Preissl H, Fritsche A, Birbaumer N. Subjective feeling of appetite modulates brain activity: an fMRI study. Neuroimage. 2006;32:1273–1280. [DOI] [PubMed] [Google Scholar]
- 23. St-Onge MP, Sy M, Heymsfield SB, Hirsch J. Human cortical specialization for food: a functional magnetic resonance imaging investigation. J Nutr. 2005;135:1014–1018. [DOI] [PubMed] [Google Scholar]
- 24. Menon V, Uddin LQ. Saliency, switching, attention and control: a network model of insula function. Brain Struct Funct. 2010;214:655–667. [DOI] [PMC free article] [PubMed] [Google Scholar]
- 25. Butter CM, McDonald JA, Snyder DR. Orality, preference behavior, and reinforcement value of nonfood object in monkeys with orbital frontal lesions. Science. 1969;164:1306–1307. [DOI] [PubMed] [Google Scholar]
- 26. Baylis LL, Gaffan D. Amygdalectomy and ventromedial prefrontal ablation produce similar deficits in food choice and in simple object discrimination learning for an unseen reward. Exp Brain Res. 1991;86:617–622. [DOI] [PubMed] [Google Scholar]
- 27. Damasio AR, Tranel D, Damasio H. Individuals with sociopathic behavior caused by frontal damage fail to respond autonomically to social stimuli. Behav Brain Res. 1990;41:81–94. [DOI] [PubMed] [Google Scholar]
- 28. Bechara A, Tranel D, Damasio H, Damasio AR. Failure to respond autonomically to anticipated future outcomes following damage to prefrontal cortex. Cereb Cortex. 1996;6:215–225. [DOI] [PubMed] [Google Scholar]
- 29. Ursin H, Linck P, McCleary RA. Spatial differentiation of avoidance deficit following septal and cingulate lesions. J Comp Physiol Psychol. 1969;68:74–79. [DOI] [PubMed] [Google Scholar]
- 30. Zysset S, Huber O, Ferstl E, von Cramon DY. The anterior frontomedian cortex and evaluative judgment: an fMRI study. Neuroimage. 2002;15:983–991. [DOI] [PubMed] [Google Scholar]
- 31. Castelli F, Happé F, Frith U, Frith C. Movement and mind: a functional imaging study of perception and interpretation of complex intentional movement patterns. Neuroimage. 2000;12:314–325. [DOI] [PubMed] [Google Scholar]
- 32. Del Parigi A, Gautier JF, Chen K, et al. Neuroimaging and obesity: mapping the brain responses to hunger and satiation in humans using positron emission tomography. Ann NY Acad Sci. 2002;967:389–397. [PubMed] [Google Scholar]
- 33. Del Parigi A, Chen K, Gautier JF, et al. Sex differences in the human brain's response to hunger and satiation. Am J Clin Nutr. 2002;75:1017–1022. [DOI] [PubMed] [Google Scholar]
- 34. Sokol-Hessner P, Hutcherson C, Hare T, Rangel A. Decision value computation in DLPFC and VMPFC adjusts to the available decision time. Eur J Neurosci. 2012;35:1065–1074. [DOI] [PMC free article] [PubMed] [Google Scholar]
- 35. Plassmann H, O'Doherty JP, Rangel A. Appetitive and aversive goal values are encoded in the medial orbitofrontal cortex at the time of decision making. J Neurosci. 2010;30:10799–10808. [DOI] [PMC free article] [PubMed] [Google Scholar]
- 36. Berridge KC. Food reward: brain substrates of wanting and liking. Neurosci Biobehav Rev. 1996;20:1–25. [DOI] [PubMed] [Google Scholar]
- 37. Bassareo V, Di Chiara G. Modulation of feeding-induced activation of mesolimbic dopamine transmission by appetitive stimuli and its relation to motivational state. Eur J Neurosci. 1999;11:4389–4397. [DOI] [PubMed] [Google Scholar]
- 38. Beaver JD, Lawrence AD, van Ditzhuijzen J, Davis MH, Woods A, Calder AJ. Individual differences in reward drive predict neural responses to images of food. J Neurosci. 2006;26:5160–5166. [DOI] [PMC free article] [PubMed] [Google Scholar]
- 39. Kelley AE, Baldo BA, Pratt WE, Will MJ. Corticostriatal-hypothalamic circuitry and food motivation: integration of energy, action and reward. Physiol Behav. 2005;86:773–795. [DOI] [PubMed] [Google Scholar]
- 40. Corbetta M, Shulman GL. Control of goal-directed and stimulus-driven attention in the brain. Nat Rev Neurosci. 2002;3:201–215. [DOI] [PubMed] [Google Scholar]
- 41. Corbetta M, Kincade JM, Shulman GL. Neural systems for visual orienting and their relationships to spatial working memory. J Cogn Neurosci. 2002;14:508–523. [DOI] [PubMed] [Google Scholar]
- 42. McFadden KL, Cornier MA, Melanson EL, Bechtell JL, Tregellas JR. Effects of exercise on resting-state default mode and salience network activity in overweight/obese adults. Neuroreport. 2013;24:866–871. [DOI] [PMC free article] [PubMed] [Google Scholar]
- 43. Capotosto P, Tosoni A, Spadone S, et al. Anatomical segregation of visual selection mechanisms in human parietal cortex. J Neurosci. 2013;33:6225–6229. [DOI] [PMC free article] [PubMed] [Google Scholar]
- 44. Esslinger C, Braun U, Schirmbeck F, et al. Activation of midbrain and ventral striatal regions implicates salience processing during a modified beads task. PLoS One. 2013;8:e58536. [DOI] [PMC free article] [PubMed] [Google Scholar]
- 45. Murdaugh DL, Cox JE, Cook EW, 3rd, Weller RE. fMRI reactivity to high-calorie food pictures predicts short- and long-term outcome in a weight-loss program. Neuroimage. 2012;59:2709–2721. [DOI] [PMC free article] [PubMed] [Google Scholar]
- 46. Baskin DG, Seeley RJ, Kuijper JL, et al. Increased expression of mRNA for the long form of the leptin receptor in the hypothalamus is associated with leptin hypersensitivity and fasting. Diabetes. 1998;47:538–543. [DOI] [PubMed] [Google Scholar]
- 47. Mercer JG, Moar KM, Rayner DV, Trayhurn P, Hoggard N. Regulation of leptin receptor and NPY gene expression in hypothalamus of leptin-treated obese (ob/ob) and cold-exposed lean mice. FEBS Lett. 1997;402:185–188. [DOI] [PubMed] [Google Scholar]
- 48. Vaisse C, Halaas JL, Horvath CM, Darnell JE, Jr, Stoffel M, Friedman JM. Leptin activation of Stat3 in the hypothalamus of wild-type and ob/ob mice but not db/db mice. Nat Genet. 1996;14:95–97. [DOI] [PubMed] [Google Scholar]
- 49. Hinkle W, Cordell M, Leibel R, Rosenbaum M, Hirsch J. Effects of reduced weight maintenance and leptin repletion on functional connectivity of the hypothalamus in obese humans. PLoS One. 2013;8:e59114. [DOI] [PMC free article] [PubMed] [Google Scholar]
- 50. Rosenbaum M, Sy M, Pavlovich K, Leibel RL, Hirsch J. Leptin reverses weight loss-induced changes in regional neural activity responses to visual food stimuli. J Clin Invest. 2008;118:2583–2591. [DOI] [PMC free article] [PubMed] [Google Scholar]
- 51. Bari A, Robbins TW. Inhibition and impulsivity: behavioral and neural basis of response control. Prog Neurobiol. 2013;108:44–79. [DOI] [PubMed] [Google Scholar]
- 52. Hendrick OM, Ide JS, Luo X, Li CS. Dissociable processes of cognitive control during error and non-error conflicts: a study of the stop signal task. PLoS One. 2010;5:e13155. [DOI] [PMC free article] [PubMed] [Google Scholar]
- 53. Løvstad M, Funderud I, Meling T, et al. Anterior cingulate cortex and cognitive control: neuropsychological and electrophysiological findings in two patients with lesions to dorsomedial prefrontal cortex. Brain Cogn. 2012;80:237–249. [DOI] [PMC free article] [PubMed] [Google Scholar]
- 54. Killgore WD, Young AD, Femia LA, Bogorodzki P, Rogowska J, Yurgelun-Todd DA. Cortical and limbic activation during viewing of high- versus low-calorie foods. Neuroimage. 2003;19:1381–1394. [DOI] [PubMed] [Google Scholar]