Abstract
Even though in vivo imaging approaches have witnessed several new and important developments, specimens that exhibit high light scattering properties such as Drosophila melanogaster pupae are still not easily accessible with current optical imaging techniques, obtaining images only from subsurface features. This means that in order to obtain 3D volumetric information these specimens need to be studied either after fixation and a chemical clearing process, through an imaging window - thus perturbing physiological development -, or during early stages of development when the scattering contribution is negligible. In this paper we showcase how Optical Projection Tomography may be used to obtain volumetric images of the head eversion process in vivo in Drosophila melanogaster pupae, both in control and headless mutant specimens. Additionally, we demonstrate the use of Helical Optical Projection Tomography (hOPT) as a tool for high throughput 4D-imaging of several specimens simultaneously.
The availability of techniques enabling imaging of in vivo processes is of general interest but especially relevant in developmental studies. In this aspect, Laser Sheet Microscopy (LSM) approaches have shown great potential for imaging in vivo small transparent specimens1,2,3. Laser Sheet techniques, however, are very sensitive to scattering and fail as soon as the specimens exhibit high optical scattering properties, hampering the generation of a controlled light sheet and additionally blurring the fluorescence emission. In fixed samples, high scattering of tissues can be reduced by chemical treatments, but these treatments are not compatible with keeping the specimen alive4,5,6,7. In this sense, Optical Projection Tomography (OPT)8,9,10, a method based on recovering the 3D structure of the sample by acquiring projections at several angles similarly to what is done in X-ray computed tomography, could offer a solid alternative for those cases where the contribution of scattering is significant. Originally developed for 3D imaging of fixed and cleared embryos8, it has been also used to image fixed organs11,12,13, and in fixed and cleared specimens of zebrafish9,14 and Drosophila melanogaster15. OPT, or modifications of it, has also been used in-vivo in zebrafish16,17,18, D. melanogaster19,20, C. elegans21, and in limb bud22, and plant development23 studies.
However, the true potential of OPT lies not in imaging transparent samples, where LSM has shown optimal resolution and imaging performance, but in those cases where the scattering contribution is not negligible. This is due to the main important difference between OPT and LSM, which stems from how the 3D image is obtained: in OPT an intermediate step which relies on a reconstruction algorithm is necessary to obtain an image from the data; on the other hand, LSM, as with any other optical sectioning technique, presents directly a 3D image once the scan is completed (note that deconvolution algorithms might be applied to LSM data to improve image quality, but these operate on already existing 3D spatial measurements). In other words, OPT requires the solution of an “inverse problem” to obtain an image. It is in this intermediate step involving a reconstruction algorithm where OPT offers great benefits and flexibility: OPT measurements, even if affected by scattering, still contain very valuable information on the specimen studied. If the effect of scattering is properly accounted for in the reconstruction algorithm, an accurate 3D representation of the volume imaged is still accessible (for additional discussion regarding this issue see the Supplementary Information).
Samples which exhibit non-negligible amounts of scattering are represented by a great majority of small specimens, especially during late stages of development. Of particular importance is Drosophila melanogaster and the fact that imaging metamorphosis during the pupal stages still remains a great challenge20. Moreover, in order to follow up the complete process of morphogenesis during the development of the pupae, a high number of acquisitions will be required to allow the visualization of fast in vivo processes such as the head eversion. As a consequence, large numbers of datasets will require the implementation of a reconstruction algorithm requiring elevated computing times to solve a complex inverse problem. In order to enable 3D time-lapse imaging with high temporal resolution of the head eversion process, we here describe a custom OPT setup and the implementation of Graphics processing unit (GPU)-parallel programming using the computing platform CUDA (Compute Unified Device Architecture) for the 3D reconstruction of large numbers of OPT imaging acquisitions24. This method results in computing times less than 3.39 s for a 512 × 512 × 512 volume, allowing the 3D reconstruction of a high number of OPT acquisitions in a time-efficient manner. Using this approach, we show here the 4D-imaging of GFP-expressing Drosophila melanogaster pupae development, with full 3D reconstructions from measurements taken every ~2 minutes for a total of ~7 hours. The 4D images obtained following this method allow the observation of altered morphogenesis in the development of mutant pupae.
One important issue, yet to be considered within OPT imaging and in particular imaging in development, is the ability to image several specimens simultaneously. The combination of our GPU-based reconstruction method and helical-OPT25, a variant of OPT with translational movement of the sample that enables 3D imaging of long samples, provides the possibility of performing high-throughput 4D-imaging, visualizing the development of several pupae at the same time. We here demonstrate, for the first time to our knowledge, the use of a 3D optical imaging approach for 3D time-lapse imaging of several specimens simultaneously.
Methods
Helical Optical Projection Tomography System
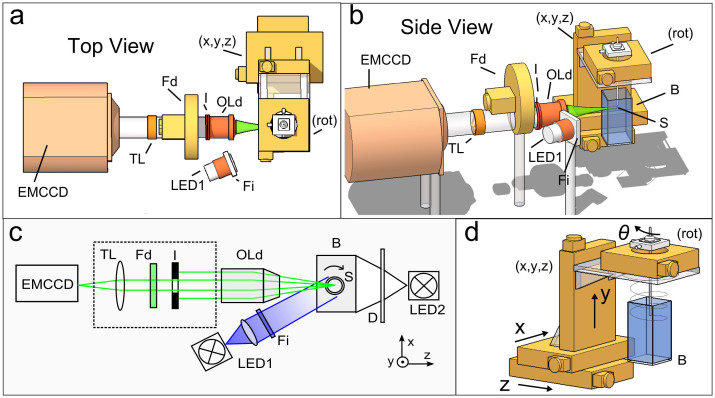
An in-house built Helical Optical Projection Tomography (hOPT) system as described in25 was used for high-throughput 4D-imaging of the development of GFP expressing D. melanogaster pupae (see Ref. 26 for additional details on building a custom OPT setup). The setup consists of a 488 nm source which is guided and expanded to provide homogeneous illumination close to normal incidence in order to excite the fluorescence on the sample, while the sample rotates and fluorescence is measured at each angular position. In the measurements presented here the beam was expanded to a ~20-mm spot size at the plane of the sample, covering the complete pupae. OPT measurements of a single specimen and time point consisted on rotating the sample a full 360 degrees while continuously acquiring images. The implementation of hOPT is equivalent to OPT with the special feature that the sample is translated vertically as it rotates, following a helical path. Figure 1 details the components of the hOPT setup, including the motorized stages which provide translation and rotation to which the specimen is attached (S), the excitation source (LED1), reference white light (LED2, both from Philips Lumileds Lighting, San Jose, California), a detection objective (OLd) and a tube lens (TL) system which includes an emission filter (Fd) and an iris (I). Acquisition took place with an electron multiplied CCD camera (iXon DV885, Andor Corp, Belfast, Northern Ireland) with a sensor with pixelsize of 13 μm and a 1004 × 1002 array. In all measurements presented here a binning of 2 was used for 16-bit dynamic range images to boost sensitivity and thus reduce exposure times. The EMCCD was thermoelectrically cooled to −70°C. Illumination is provided by collimating the excitation light and selectively narrowing the excitation wavelength through an excitation filter (Fi) centered at 488 nm. Reference transillumination measurements were taken using LED2 and a diffuser (D) (shown only in Fig. 1(c)). The system is built on an optical table with passive isolation (Vere, New Kensinton, U.S.A.).
Figure 1. hOPT setup.
Details of the hOPT set-up (a, b and c), consisting of an infinity corrected detection objective (OLd), an emission filter (Fd), a tube lens (TL), and a diaphragm (I) coupled to an electron-multiplied CCD camera, an excitation source (LED1) and an excitation filter (Fi) and a reference white light (LED2) illuminating the sample through a diffusor (D) (shown only in (c)). Translation of the sample and rotation is done through controlled step motors (d). The samples (S) are either attached to a capillary for single specimen measurements, or stacked inside a capillary for high-throughput. Images are taken in air, using the bath (B) to control the humidity and environment.
For detection, a long-working distance objective with a 5× magnification was used (Mitutoyo, Kawasaki, Japan; NA 0.14, with 34 mm working distance, resolving power of 2 μm and 14 μm depth of focus), yielding a cubic resolution of ~7.5 μm in the reconstructed images for fields of view of approximately ~3.8 mm. Note that when imaging scattering specimens using this optical configuration in the presence of the iris (I, in Fig. 1), the sampling rate of the CCD after binning was well above the Nyquist frequency. Selection of GFP emission was done using a bandpass filter (Fd) centered at 531 nm ± 40 nm. Exposure time values were in the range of 0.02 s.
Translation and rotation of the specimen was controlled through three translation and one rotation stage (8MT167-100, Standa, Vilnius, Lithuania). In order to allow for high throughput using hOPT, the vertical translation stage was selected with a long travel range (10 cm in our case). All movement, acquisition, and time-lapse automation were controlled through a Labview (National Instruments, Texas, U.S.A.) code developed in-house.
Sample preparation
Single Specimen Imaging
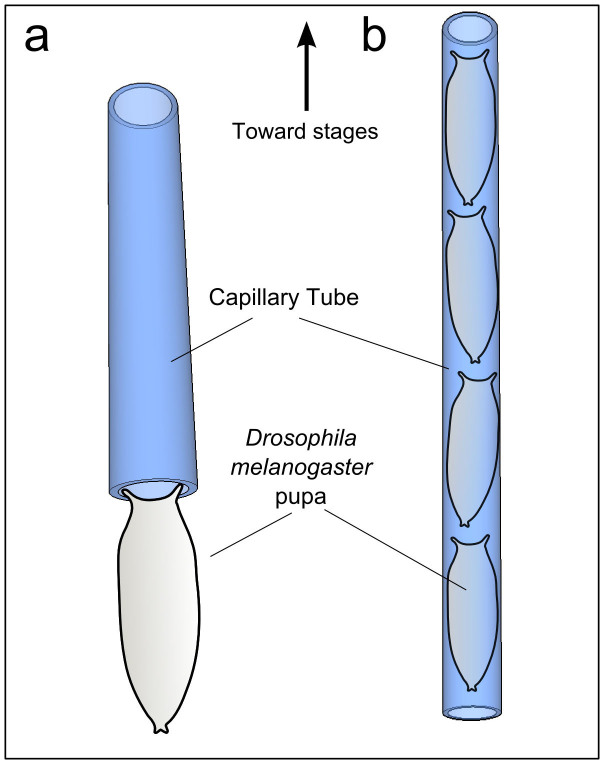
For the single specimen OPT experiments we made use of early stage pupae of a Drosophila melanogaster which expresses GFP ubiquitously27, by carefully attaching them to the lower tip of a capillary which is held by a custom-made holder attached to the rotation stage (see Fig. 2 (a)). Temperature was controlled to ensure normal development of the pupae by maintaining room temperature, while controlling the relative humidity and reducing light exposure to the absolute minimum in order to avoid photodamage to the specimen. A full OPT dataset was acquired every ~2 minutes by taking an angular measurement every degree approximately for a total of 360°. The same procedure was followed using a “headless” Drosophila mutant (Kiupakis, Oehler & Savakis, unpublished) in which head eversion at the end of the prepupal stage is blocked. Raw data of OPT measurements for several angles are shown in Supplementary Video 1.
Figure 2. Specimen handling for one single specimen (a) and for several inside a capillary (b).
See Supplementary Video 1 for raw data.
High Throughput Imaging
In order to enable high-throughput hOPT imaging of several specimens simultaneously, pupae were stacked by introducing them inside of a capillary tube (inner/outer diameter 1.2 mm/1.75 mm; Blaubrand - intraMARK, BRAND GmbH, Wertheim, Germany), as shown in Figure 2(b). Two sets of high throughput data were obtained: a high resolution hOPT data set for a single time point and a 12 hours time-lapse data set with hOPT scans performed every 15 minutes in order to ensure that the head eversion process took place in at least one specimen.
OPT and hOPT Reconstruction
In OPT, the most common approach used to recover the 3D distribution of fluorescence is the inverse Radon transform, in particular its solution through the Filtered-Back Projection (FBP) algorithm (see Ref. 28, for example). We applied the FBP by first filtering the data in the Fourier domain, and then backprojecting all angles to recover the 3D distribution. Image quality greatly depends on the accuracy with which the axis of rotation is known, for which we developed an algorithm which finds this center of rotation prior to the backprojection of the data24 (see Supplementary Information for additional discussion on artifacts in OPT reconstructions).
In the case of hOPT, additional to the center of rotation displacement we need to calculate the speed (in pixels/s) at which the vertical translation stage is moving. This movement is optimized so that each specimen completes a full rotation before exiting the field of view. Performing the hOPT reconstruction, therefore, implies first accounting for the vertical translation before following the above-mentioned steps common to OPT25.
GPU-based Reconstructions
In order to enable high-throughput imaging, we made use of parallel programming on Graphics Processing Units (GPUs). In our approach the FBP was executed in parallel on a number of graphics processor units consisting of several streaming multiprocessors (SMs) with hundreds of cores which are used to implement the parallel computation29. One of the main hurdles we had to overcome when developing our high throughput approach was the large amount of data generated in time-lapse 3D imaging, which would require extremely long computation times using linear reconstruction approaches, especially when trying to recover the center of rotation automatically. In order to increase the speed dramatically we developed a two-step search method implemented in the GPUs (see extensive details in Ref. 24), which increased speed by more than two orders of magnitude. All reconstructions took place on a desktop computer with 64-bit Windows 7, 2GB DDR2 RAM, an Intel Core2 2.66 GHz CPU, and an NVIDIA GTX275 GPU card with 240 CUDA cores and an 896 MB device memory. In order to program the GPUs and implement the FPB algorithm we made use of the Common Unified Device Architecture (CUDA, NVIDIA corporation) (see Ref. 24 for details).
Results and Discussion
4D-imaging of the development of Drosophila melanogaster pupae
As mentioned previously, in order to follow up the whole process of D. melanogaster pupal development in 4D with OPT we developed a GPU-based method for the 3D reconstruction of OPT images. Using the custom-built OPT system (Fig. 1) we acquired OPT scans of D. melanogaster prepupae expressing GFP ubiquitously27 every ~2 minutes for a total of ~7 hours or until the eversion of the head of the fly took place. Therefore, typically a total of at least 200 scans (30/h × 7 h) were acquired per specimen. Note that the 3D reconstruction including the automated search for the center of rotation of a single OPT scan using a single processor would require on the order of ~13 minutes, requiring 45 hours to obtain a time-lapse reconstruction of a single specimen (see Table 1). Using our GPU-based method, the same analysis reduced computing times of a single scan to ~3.4 s, requiring a total of ~11 min for the complete time-lapse data (see Table 1), greatly improving the performance and the applicability of this imaging technique in developmental studies. Note that these computing times will be further reduced proportionally to the number of cores available in the GPU used.
Table 1. Comparison of computation times with the GPU card employed in this study.
| Measurements | Single Processor | GPU with 240 cores |
|---|---|---|
| Single 512 × 512 × 512 volume | ~13 minutes | ~3.4 s |
| Time lapse with 200 volumes | ~45 hours | ~11.3 minutes |
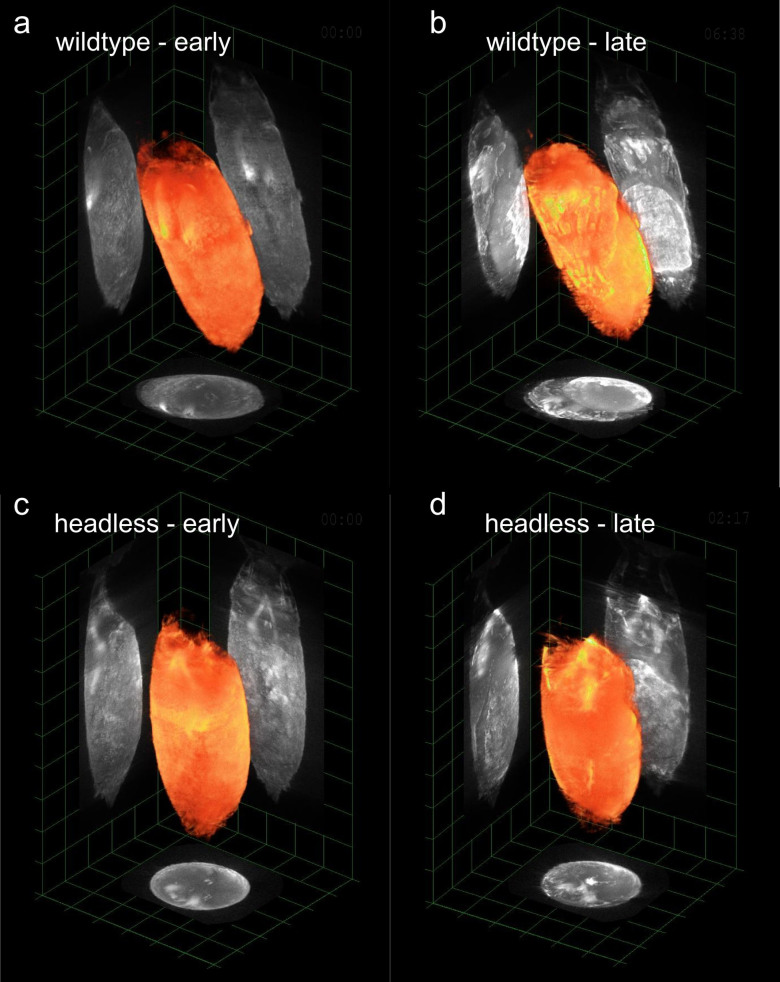
As can be observed in Fig. 3(a) and 3(b) and Supplementary videos 2(a) and 2(b), the 4D reconstruction obtained with our GPU-based method allowed the visualization of the development of the pupae, distinguishing different anatomical structures and morphogenesis processes that conclude with the first apparition of the anatomical structures that will be present in the fly. Examples of raw reconstructed data can be seen in Supplementary Video 3 for pre- and post-eversion stages, where the effect of higher tissue density and the appearance of darker regions in the post-eversion stages results in slight reconstruction artifacts (see Reconstruction Artifacts in OPT within the Supplementary Information for additional discussion regarding artifacts).
Figure 3. 4D-imaging of Drosophila melanogaster pupae development.
(a) and (b) Wild type pupae; (c) and (d) Headless mutant pupae. See the complete sequence in Supplementary videos 2(a) and 2(b) (wild type pupae) and Supplementary videos 4(a) and 4(b) (headless mutant pupae). Examples of raw reconstructed data for the wild type pupae for pre- and post-eversion stages are show in Supplementary Video 3.
A similar procedure was followed for the 3D imaging of the development of “headless” mutant D. melanogaster pupae. These mutant flies present a deficiency in the process of metamorphosis which results in the absence of head eversion at the end of the prepupal stage (Kiupakis, Oehler & Savakis, unpublished). As observed in Fig. 3(b) and Supplementary videos 2(a) and 2(b), OPT combined with our GPU-based reconstruction method allows the visualization of the eversion of the head in a wild type pupa and the absence of such process in a mutant pupa (Fig. 3(c) and 3(d) and Supplementary videos 4(a) and 4(b)).
High-throughput 4D- imaging of D. melanogaster pupae development using hOPT
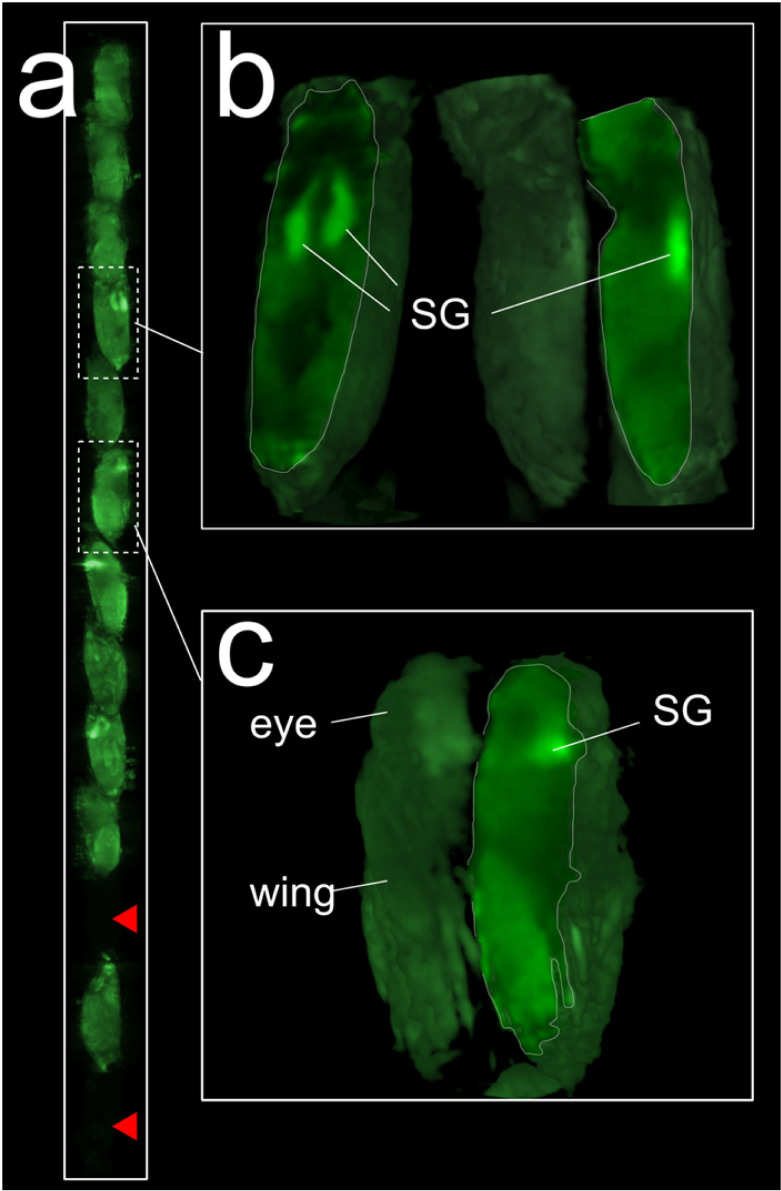
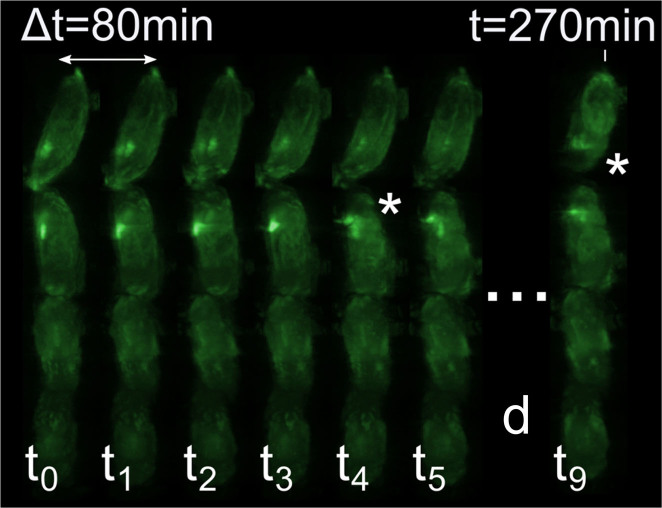
Once obtained the 4D-imaging data from D. melanogaster pupae development using OPT, we analyzed its potential as a high-throughput 4D-imaging tool for developmental studies. To this aim, we combined hOPT with our GPU-based reconstruction method. As mentioned previously, hOPT is a variant of OPT based on the vertical translation of the sample, and has so far been used for the 3D imaging of intact long samples such as mouse colon or spinal cord25. Given the characteristics of hOPT, we hypothesized whether we could increase the throughput of OPT by stacking small samples vertically and using the same approach used for imaging long tissue samples. To this end, we first performed a single hOPT scan of 13 individuals and reconstructed this data using our GPU-based method (see Fig. 4). Using the same approach, we then followed the development of a total of 7 D. melanogaster pupae for over 12 hours acquiring a full hOPT data-set images every 15 min. Several maximum intensity projection images of 4 individuals are shown in Fig. 5 and a complete time-lapse sequence is presented in Supplementary Video 5. As shown in our results, hOPT successfully allowed the simultaneous observation of several individuals over the time, being possible to follow different developmental steps in different pupae within the same experiment. These results demonstrated the potential of hOPT a 4D-imaging high-throughput tool in developmental studies.
Figure 4. hOPT increases the throughput of regular OPT measurements.
In order to test hOPT as a high-throughput OPT technology, 13 D. melanogaster pupae which express GFP ubiquitously were placed in a capillary tube and imaged simultaneously using hOPT with a 5× objective. a) Volume renders of the 13 D. melanogaster pupae. Red arrowheads indicate non-expressing GFP individuals. (b) Volume rendered details of an early stage pupa (two views shown) and at a later developmental stage (c). SG stands for salivary glands.
Figure 5. hOPT enables high-throughput 4D-imaging.
Example of high-throughput 4D-imaging of D. melanogaster using hOPT. Time-lapse imaging took place for over 12 hours with hOPT data acquired every 15 minutes using a 2.5× objective. In this figure results are shown for 80 minute time intervals for a set of 7 D. melanogaster pupae of which 4 are shown here. Asterisks indicate when the process of head eversion takes place in different individuals at different time points. The full sequence is shown in Supplementary Video 5.
Conclusions
In summary, recent advances in optical imaging approaches are currently enabling unprecedented resolution and quantification in early-stage developing organisms. At the same time, approaches such as Optical Projection Tomography (OPT) are improving the way we account for scattering present in a sample. These developments, however, need to be harnessed and optimized for developmental studies. In this paper we present an approach to improve the time-lapse tomographic data in Drosophila melanogaster pupae, showcasing the potential for OPT for providing fast and reliable 4D-imaging data. Further improvements relate to improving the theoretical model employed for light propagation and efficiently implementing this model in the reconstruction algorithm in order to maintain the necessary speed needed for high-throughput imaging. We believe that hOPT in combination with parallel programming using Graphic Processing Units (GPUs) will open new ways of high-throughput 4D-imaging in those specimens where the presence of scattering is significant, enabling 3D imaging of advanced stages of development where optical sectioning techniques fail.
Author Contributions
A.A. and J.R. conceived and designed the project, took all in-vivo measurements, wrote the paper and prepared the figures; J.R. designed the setup, and developed the software to control the setup; C.S. provided the samples; A.A. and J.R. prepared the samples for imaging; D.D. and S.Z. programmed the GPU software implemented in CUDA with supervision from J.T.
Supplementary Material
Supplementary Information
Raw Fly Data
OPT of head eversion of wild type fly
Close up of head eversion of wild type fly.
Raw Reconstructed OPT data
OPT of head eversion of headless mutant fly
Close-up of head eversion of headless mutant fly
High throughput Time-lapse OPT imaging
Acknowledgments
This work was supported in part by Project “THALES – BSRC ‘Alexander Fleming' – Development and employment of Minos-based genetic and functional genomic technologies in model organisms (MINOS)” – MIS: 376898, the Fellowship for Young International Scientist of the Chinese Academy of Sciences Grant No. 2010Y2GA03 and the NSFC-NIH Biomedical collaborative research program 81261120414. A. Arranz acknowledges support from Marie Curie Intra-European Fellowship Program FP7-PEOPLE-2010-IEF. J. Ripoll acknowledges support from EC FP7 CIG grant HIGH-THROUGHPUT TOMO, and Spanish MINECO grant MESO-IMAGING FIS2013-41802-R. The authors would like to thank Dr. S. Oehler for the help with the GFP-expressing flies, and G. Livadaras and G. Zacharakis for help with the Drosophila stocks.
References
- Ahrens M., Orger M., Robson D., Li J. & Keller P. Whole-brain functional imaging at cellular resolution using light-sheet microscopy. Nat. Methods 10, 413–420 (2013). [DOI] [PubMed] [Google Scholar]
- Huisken J., Swoger J., Del Bene F., Wittbrodt J. & Stelzer E. H. Optical sectioning deep inside live embryos by selective plane illumination microscopy. Science (80-.). 305, 1007–1009 (2004). [DOI] [PubMed] [Google Scholar]
- Gao L., Shao L., Chen B. & Betzig E. 3D live fluorescence imaging of cellular dynamics using Bessel beam plane illumination microscopy. Nat. Protoc. 9, 1083–1101 (2014). [DOI] [PubMed] [Google Scholar]
- Hama H. et al. Scale: a chemical approach for fluorescence imaging and reconstruction of transparent mouse brain. Nat. Neurosci. 14, 1481–8 (2011). [DOI] [PubMed] [Google Scholar]
- Chung K. & Deisseroth K. CLARITY for mapping the nervous system. Nat. Methods 10, 508–13 (2013). [DOI] [PubMed] [Google Scholar]
- Susaki E. a. et al. Whole-brain imaging with single-cell resolution using chemical cocktails and computational analysis. Cell 157, 726–39 (2014). [DOI] [PubMed] [Google Scholar]
- Ertürk A. et al. Three-dimensional imaging of solvent-cleared organs using 3DISCO. Nat. Protoc. 7, 1983–95 (2012). [DOI] [PubMed] [Google Scholar]
- Sharpe J. et al. Optical projection tomography as a tool for 3D microscopy and gene expression studies. Science (80-.). 296, 541–545 (2002). [DOI] [PubMed] [Google Scholar]
- Bryson-Richardson R. J. & Currie P. D. Optical projection tomography for spatio-temporal analysis in the zebrafish. Methods Cell Biol. 76, 37–50 (2004). [DOI] [PubMed] [Google Scholar]
- Sharpe J. Optical projection tomography as a new tool for studying embryo anatomy. J. Anat. 202, 175–181 (2003). [DOI] [PMC free article] [PubMed] [Google Scholar]
- Kumar V. et al. Global lymphoid tissue remodeling during a viral infection is orchestrated by a B cell–lymphotoxin-dependent pathway. Blood 115, 4725–4733 (2010). [DOI] [PubMed] [Google Scholar]
- Hörnblad A., Cheddad A. & Ahlgren U. An improved protocol for optical projection tomography imaging reveals lobular heterogeneities in pancreatic islet and β-cell mass distribution. Islets 3, 204–208 (2011). [DOI] [PMC free article] [PubMed] [Google Scholar]
- Ertürk A. et al. Three-dimensional imaging of the unsectioned adult spinal cord to assess axon regeneration and glial responses after injury. Nat. Med. 18, 166–71 (2012). [DOI] [PubMed] [Google Scholar]
- Bryson-Richardson R. J. et al. FishNet: an online database of zebrafish anatomy. BMC Biol. 5, 34 (2007). [DOI] [PMC free article] [PubMed] [Google Scholar]
- McGurk L., Morrison H., Keegan L. P., Sharpe J. & O'Connell M. a. Three-dimensional imaging of Drosophila melanogaster. PLoS One 2, e834; 10.1371/journal.pone.0000834 (2007). [DOI] [PMC free article] [PubMed] [Google Scholar]
- Bassi A., Fieramonti L., D'Andrea C., Mione M. & Valentini G. In vivo label-free three-dimensional imaging of zebrafish vasculature with optical projection tomography. J. Biomed. Opt. 16, 100502 (2011). [DOI] [PubMed] [Google Scholar]
- Fieramonti L. et al. Quantitative measurement of blood velocity in zebrafish with optical vector field tomography. J. Biophotonics 10.1002/jbio.201300162 (2013). [DOI] [PubMed] [Google Scholar]
- Fieramonti L. et al. Time-gated optical projection tomography allows visualization of adult zebrafish internal structures. PLoS One 7, e50744; 10.1371/journal.pone.0050744 (2012). [DOI] [PMC free article] [PubMed] [Google Scholar]
- Meyer H. et al. Optical Projection Tomography for In-Vivo Imaging of Drosophila melanogaster. Microsc. Anal. 22, 19–21 (2008). [Google Scholar]
- Vinegoni C., Pitsouli C., Razansky D., Perrimon N. & Ntziachristos V. In vivo imaging of Drosophila melanogaster pupae with mesoscopic fluorescence tomography. Nat. Methods 5, 45–47 (2008). [DOI] [PubMed] [Google Scholar]
- Rieckher M., Birk U. J., Meyer H., Ripoll J. & Tavernarakis N. Microscopic optical projection tomography in vivo. PLoS One 6, e18963; 10.1371/journal.pone.0018963 (2011). [DOI] [PMC free article] [PubMed] [Google Scholar]
- Colas J.-F. & Sharpe J. Live optical projection tomography. Organogenesis 5, 211–6 (2009). [DOI] [PMC free article] [PubMed] [Google Scholar]
- Lee K., Avondo J., Morrison H. & Blot L. Visualizing plant development and gene expression in three dimensions using optical projection tomography. Plant Cell … 18, 2145–2156 (2006). [DOI] [PMC free article] [PubMed] [Google Scholar]
- Dong D. et al. Automated Recovery of the Center of Rotation in Optical Projection Tomography in the Presence of Scattering. IEEE J. Biomed. Heal. Informatics 17, 198–204 (2012). [DOI] [PubMed] [Google Scholar]
- Arranz A. et al. Helical optical projection tomography. Opt. Express 21, 25912–25925; 10.1364/OE.21.025912 (2013). [DOI] [PubMed] [Google Scholar]
- Wong M. D., Dazai J., Walls J. R., Gale N. W. & Henkelman R. M. Design and implementation of a custom built optical projection tomography system. PLoS One 8, e73491; 10.1371/journal.pone.0073491 (2013). [DOI] [PMC free article] [PubMed] [Google Scholar]
- Koukidou M. et al. Germ line transformation of the olive fly Bactrocera oleae using a versatile transgenesis marker. Insect Mol. Biol. 15, 95–103 (2006). [DOI] [PubMed] [Google Scholar]
- Kak A. C. & Slaney M. Principles of Computerized tomographic imaging (IEEE Press, 1988). [Google Scholar]
- Ren N. et al. GPU-based Monte Carlo simulation for light propagation in complex heterogeneous tissues. Opt. Express 18, 6811–23; 10.1364/OE.18.006811 (2010). [DOI] [PubMed] [Google Scholar]
Associated Data
This section collects any data citations, data availability statements, or supplementary materials included in this article.
Supplementary Materials
Supplementary Information
Raw Fly Data
OPT of head eversion of wild type fly
Close up of head eversion of wild type fly.
Raw Reconstructed OPT data
OPT of head eversion of headless mutant fly
Close-up of head eversion of headless mutant fly
High throughput Time-lapse OPT imaging


