

Abstract
Aim
Climate change can lead to decreased climatic suitability within species' distributions, increased fragmentation of climatically suitable space, and/or emergence of newly suitable areas outside present distributions. Each of these extrinsic threats and opportunities potentially interacts with specific intrinsic traits of species, yet this specificity is seldom considered in risk assessments. We present an analytical framework for examining projections of climate change-induced threats and opportunities with reference to traits that are likely to mediate species' responses, and illustrate the applicability of the framework.
Location
Sub-Saharan Africa.
Methods
We applied the framework to 195 sub-Saharan African amphibians with both available bioclimatic envelope model projections for the mid-21st century and trait data. Excluded were 500 narrow-ranging species mainly from montane areas. For each of projected losses, increased fragmentation and gains of climate space, we selected potential response-mediating traits and examined the spatial overlap with vulnerability due to these traits. We examined the overlap for all species, and individually for groups of species with different combinations of threats and opportunities.
Results
In the Congo Basin and arid Southern Africa, projected losses for wide-ranging amphibians were compounded by sensitivity to climatic variation, and expected gains were precluded by poor dispersal ability. The spatial overlap between exposure and vulnerability was more pronounced for species projected to have their climate space contracting in situ or shifting to distant geographical areas. Our results exclude the potential exposure of narrow-ranging species to shrinking climates in the African tropical mountains.
Main conclusions
We illustrate the application of a framework combining spatial projections of climate change exposure with traits that are likely to mediate species' responses. Although the proposed framework carries several assumptions that require further scrutiny, its application adds a degree of realism to familiar assessments that consider all species to be equally affected by climate change-induced threats and opportunities.
Keywords: Africa, amphibian, bioclimatic envelope model, climate change exposure, dispersal, plasticity, reproductive output, trait, vulnerability
Introduction
Fingerprints of recent climate change impacts on species' distributions are already apparent (Parmesan & Yohe, 2003), but predicting future climate change impacts is still a major scientific challenge (Pereira et al., 2010). Predictions of species' exposure to climate change have to date relied mostly on bioclimatic envelope models, and are increasingly being complemented with available trait data to estimate species' vulnerability (e.g. Heikkinen et al., 2009). Assessing the risk of species' extinction or decline requires an understanding of threats, or extrinsic adverse events, and vulnerability, or the intrinsic susceptibility of species to threats (Araújo & Williams, 2000). It is thus important to understand the interaction between threats and vulnerability, as specific traits are likely to mediate species' responses to different threats (Isaac & Cowlishaw, 2004; Fritz et al., 2009; Murray et al., 2011; González-Suárez et al., 2013). For example, under habitat-modifying processes such as agriculture and logging, small-sized, habitat specialist mammals are most affected, whereas under processes that directly affect survival, such as hunting, the most susceptible are mammals with large body size and small litter size (González-Suárez et al., 2013; see also Isaac & Cowlishaw, 2004). In climate change risk assessments, however, this specificity in the interaction between threat and vulnerability has not been addressed sufficiently.
In studies using bioclimatic envelope models, the level of species' exposure to climate change is commonly inferred from temporal changes in the overall size of species' climatically suitable space (e.g. Thuiller et al., 2005b; Araújo et al., 2006; Huntley et al., 2006; Feeley et al., 2012; Triviño et al., 2013). Such summary measures conceal different opportunities as well as threats, each imposing specific constraints on species (Thomas et al., 2011). First, loss of climatic suitability within existing distributions is expected to affect the persistence of local populations (e.g. Sinervo et al., 2010). Second, even where suitable climate space persists, it may become more fragmented. Areas of suitable climate may lose contiguity, with fragments becoming more isolated and smaller in area. Third, gains of climatic suitability outside current distributions of species bring potential opportunities for colonization. These components of exposure are likely to have distinct spatial distributions and conservation implications, but are seldom teased apart (but see Midgley et al., 2003; Heikkinen et al., 2009; Araújo et al., 2011).
Species also vary in their degree of intrinsic sensitivity and capacity to adapt to exposure (Williams et al., 2008; Chevin et al., 2010), and traits can capture this variation. Traits are meant as ‘any morphological, physiological or phenological feature measurable at the individual level, from the cell to the whole-organism level, without reference to the environment or any other level of organization’ (sensu Violle et al., 2007, p. 884). Examples are limb or wing length, and clutch size. In many cases, ecological characteristics of species and their geographical or environmental ranges are used as proxies for traits, in the expectation that they summarize combinations of traits. Examples are species' geographical range size and climatic breadth.
Previous research has identified general traits that predispose species to extinction (e.g. Purvis et al., 2000), and specific traits that mediate the effect of particular threats on species (Isaac & Cowlishaw, 2004; Murray et al., 2011; González-Suárez et al., 2013). Under changing climates, poor dispersal ability and habitat or climatic specialization, for example, have been suggested to increase vulnerability (Peters & Darling, 1985), and have been found to correlate positively with empirical data on range contractions (Beaumont & Hughes, 2002; Botts et al., 2013). Generally, traits have accounted for a significant but small amount of the variation in climate change-induced range shifts (Buckley & Kingsolver, 2012). Yet, changes in the size, level of fragmentation and position of species' climate space each represent a distinct threat or opportunity under changing climates, and thus are likely to interact with particular sets of ‘response-mediating’ traits (sensu Luck et al., 2012).
Besides evolution on longer time-scales, three main determinants of climate change vulnerability can be distinguished (Williams et al., 2008; Chevin et al., 2010). First, traits describing plasticity of individual phenology, behaviour or physiology affect the potential of individuals to persist in situ under changing climates. For example, species able to physiologically tolerate a wide range of climatic variation (Huey et al., 2012), or adapt their behaviour to lessen exposure to unsuitable climates (Chown, 2012), have, all else being equal, higher chances of persistence in situ under climate change. Second, traits influencing the potential of individuals to disperse affect their capacity to colonize newly suitable environments (Pöyry et al., 2009) or move between fragments of suitable climate. Third, life-history traits influencing population growth, although not affected by environmental change, may constrain the rate of dispersal or in situ adaptation. In the case of reproductive traits, for example, frequent or early reproduction and high fecundity, should increase colonization opportunities (Angert et al., 2011).
Here, we present an analytical framework for examining projections of climate change-induced threats or opportunities for species with reference to the vulnerability of species. Each threat or opportunity – exposure to loss, fragmentation and gain of climate space – is matched to specific response-mediating traits that potentially render species vulnerable, according to expectations from theory and empirical evidence (Fig. 1). Areas of spatial overlap between threats or opportunities and associated vulnerability are then identified. These are areas where traits can potentially exacerbate projected losses and increased fragmentation of climatically suitable areas, or restrain projected gains of newly suitable areas.
Figure 1.

Examples of traits that potentially mediate species' responses to climate change-induced threats and opportunities. Exposure to loss, increased fragmentation and gain of climatically suitable areas are each illustrated with diagrams of the shift from baseline climate space (left) to future climate space (right, closed lines, with the baseline climate space represented by dashed lines, and the component of exposure under consideration highlighted in black). For each of these threats or opportunities, examples are given of potential response-mediating traits associated with species' plasticity, dispersal ability and/or demography, where supported by theoretical and empirical studies across taxa.
We test the practicality of the framework on wide-ranging sub-Saharan African amphibians, using available bioclimatic envelope model and trait data. Our application of the framework reflects situations where only proxies for traits are available and where bioclimatic envelope model projections are available only for wide-ranging species, in our case leading to the exclusion of most narrow-ranging endemics typical of biodiverse montane regions. Worldwide, amphibian populations are declining due to a multitude of threats that include habitat destruction, climate change and the pathogenical fungal disease chytridiomycosis (Blaustein & Kiesecker, 2002; Hof et al., 2011; Li et al., 2013). Climate change, often in tandem with land-use change, is expected to affect large areas of tropical Africa in the future (Hof et al., 2011; Foden et al., 2013). While our aim here is to present a spatially explicit framework for linking threats or opportunities and vulnerability in climate-change risk assessments, the practical application we show can also contribute to a better understanding of climate change risks facing wide-ranging sub-Saharan African amphibians.
Materials and methods
Study species
Our study sample consists of 195 amphibian species (see Appendix S1 in Supporting Information) restricted in their distributions to sub-Saharan Africa, and with available projections of species bioclimatic envelope models (Garcia et al., 2012) and trait data (Foden et al., 2008, 2013). From all 695 species in the original species distribution (Hansen et al., 2007) and trait (Foden et al., 2008, 2013) databases, only 272 had model projections available (excluded were 423 species with fewer than 15 gridded occurrence records), and, of these, 195 also had data for all traits (excluded were 77 species with some trait data missing). Our sample is, therefore, restricted to the widest-ranging species in the dataset, and may not be representative of the overall taxonomic and geographical amphibian diversity patterns in Africa (Appendix S2a–c). In particular, our data exclude most species endemic to biodiverse montane areas such as the Cameroon/ Nigerian highlands and the Eastern Afromontane biodiversity hotspot, and most species in the highest threat categories of the IUCN Red List (Appendix S2d).
Extrinsic threats and opportunities from climate change
We used published baseline (1961–90) and mid-century (2041–60) projections of climatically suitable areas for our 195 amphibians species, at one degree latitudinal–longitudinal resolution (c. 111 km × 111 km at the equator), according to mean temperatures of warmest and coldest month and annual precipitation (for detailed methods see Garcia et al., 2012). Future projections were for a multi-model climate ensemble under the A1B greenhouse gas emissions scenario (Nakićenović & Swart, 2000). We used consensus projections obtained by computing the median among seven bioclimatic envelope modelling techniques, in presence–absence format, and assuming unlimited dispersal in future projections. Here, to characterize climate change-induced threats and opportunities, we computed four types of projected changes in climatic suitability: local loss, fragmentation and gain of climatic suitability, and distance to new areas gained. Each metric was quantified per pixel, as described below, yielding maps of changes for each species. Composite maps for our species sample were also obtained by summing the number of species with projected local loss, increased fragmentation, or gain of suitable climate in each pixel.
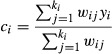
First, for each species we considered local losses in pixels projected to be climatically suitable in the baseline period but unsuitable in the future. Second, for fragmentation we used a distance-based measure of contagion of suitable climate space. Contagion was measured as the weighted average of the number of suitable pixels among a set of ki neighbours of a central pixel yi, where the weight given to the grid cell yj is wij = 1/dij, and dij is the great-circle distance between grid cells yi and yj (Araújo et al., 2002; equation 1). Owing to poor dispersal ability of most amphibians, we considered only the first-order neighbours (maximum = 8) adjacent to the central pixel. Changes in contagion were given by the difference between future and baseline contagion, with negative values indicating reduced contagion, i.e. increased fragmentation.
 |
(1) |
Third, local gains corresponded to pixels projected to be climatically unsuitable in the baseline period but suitable in the future. Fourth, for species projected to gain newly suitable areas in mid-century, we also computed, for each pixel of newly suitable climate, the great-circle distance to the nearest pixel of baseline suitable climate.
Intrinsic vulnerability to climate change
We sourced the trait data from the IUCN's trait-based climate change vulnerability assessment for amphibians (Foden et al., 2008, 2013). These data are mainly ecological characteristics of species or their ranges rather than traits in a strict sense (sensu Violle et al., 2007). From the data available, we selected characteristics that are likely to summarize response-mediating traits under climate change (Fig. 1), and that are not strongly correlated. We thus selected tolerance to temperature and precipitation change, dependence on precipitation cues, dispersal ability and reproductive output (Table 1; see Foden et al., 2008, 2013, for details). For each of these characteristics, we used the climate change vulnerability classification of species by Foden et al. (2008, 2013): species were assigned ‘high’, ‘lower’ or ‘unknown’ scores of vulnerability based on the ranking of all sub-Saharan African species in the IUCN database or on pre-defined criteria (see Table 1).
Table 1.
Species traits used as estimates of intrinsic vulnerability to climate change exposure for sub-Saharan African amphibians. Three climate change-induced threats and opportunities for species were defined based on bioclimatic envelope model projections (Garcia et al., 2012): loss, increased fragmentation, and gain of suitable climate space. For each, different sets of species traits or characteristics of species and their ranges (Foden et al., 2008, 2013) were selected that are likely to mediate species' responses (see Fig. 1)
| Extrinsic threats and opportunities from climate change | Intrinsic vulnerability to climate change |
|---|---|
| Loss | Plasticity |
| Tolerance to temperature change: average absolute deviation for all cells in species' refined range for the monthly means; high risk if ≤ 1.06 °C, i.e. 25% of all 704 sub-Saharan African species in the IUCN dataset with the narrowest tolerance ranges. | |
| Tolerance to precipitation change: average absolute deviation for all cells in species' refined range for the monthly means; high risk if ≤ 46.89 mm, i.e. 25% of all 704 sub-Saharan African species in the IUCN dataset with the narrowest tolerance ranges. | |
| Dependence on environmental cues: high risk if dependent on rainfall or increased water availability for mass breeding (excludes species buffered by occurring in forests). | |
| Fragmentation | Dispersal |
| Dispersal ability: high risk if not known to have become established outside their natural ranges, not associated with flowing water, and have small ranges (≤ 4000 km2, i.e. 25% of all 704 sub-Saharan African species in the IUCN dataset with the smallest ranges). | |
| Gain | Dispersal |
| Dispersal ability: high risk if not known to have become established outside their natural ranges, not associated with flowing water, and have small ranges (≤ 4000 km2, i.e. 25% of all 704 sub-Saharan African species in the IUCN dataset with the smallest ranges). | |
| Demography | |
| Reproductive output: high risk if ≤ 50 offspring annually (where known) or viviparous. |
Spatial overlap between threats or opportunities and vulnerability
We spatially assessed where climate-induced threats or opportunities, defined with the metrics of species' exposure to climate change, overlapped with high climate change vulnerability of species according to our selected traits. Following expected interactions between traits and exposure (Fig. 1), we matched plasticity characteristics to local losses, dispersal characteristics to increased fragmentation, and both dispersal and demography characteristics to gains (see Table 1). For climatic tolerance, we considered for each species either the tolerance to temperature or to precipitation depending on the variable of highest importance in the bioclimatic envelope models (assessed with permutations within the biomod computing platform in R; Thuiller et al., 2009). We thus identified where projected losses were for species with high vulnerability according to plasticity traits, where projected fragmentation was for species with high vulnerability according to dispersal traits, and where projected gains were for species with high vulnerability according to dispersal or demography traits.
The assessment of spatial overlap was first conducted for all species in our sample, and then individually for groups of species projected to experience different combinations of threats and opportunities. To identify these groups, we ranked species according to each species' overall projected losses, gains and distance to gains of suitable climate. For each species, the overall local losses of climatic suitability L were quantified using the proportion of baseline area of suitable climate (ai) projected to be lost in the future (li; equation 2). The overall opportunity for gains G was measured as the proportion of baseline area of suitable climate (ai) projected to be gained in the future (gi; equation 3). The surface area across the A pixels of the study area was measured taking into account the curvature of the Earth. The overall distance to new areas D for each species was the mean of the minimum great-circle distances dib between each pixel gained i and the baseline suitable areas b computed across the N pixels gained (equation 4).
| (2) |
| (3) |
| (4) |
For each of the metrics considered, we retained the 25% of species with the smallest change values, and the 25% of species with the largest change values. We grouped these species depending on the combination of change level thus defined for the three metrics, with the intention of highlighting the extremes of the distribution of changes. ‘Contracting in situ’ species were projected to suffer the largest losses of baseline climatic suitability, while having little opportunity to move to new suitable areas; ‘obligate shifting’ species also faced large in situ losses but gained suitability in new, distant areas; and ‘expanding’ species were projected to retain most of their baseline suitability and have large and distant gains outside their distributions.
Results
Our results concern 195 sub-Saharan African amphibians with wider ranges, significantly larger temperature tolerances (P-value < 0.05, Student's t-test), and a larger proportion of species with higher reproductive output than the remaining 500 species in the dataset (Appendix S2c,e). For this subset, the spatial patterns of climate change exposure (greyscale maps in Fig. 2) showed widespread local losses of climatically suitable space, but a concentration of increased fragmentation in montane areas and local gains in the Congo Basin. Species were also not randomly distributed across sub-Saharan Africa with regard to climate change vulnerability due to selected traits or ecological characteristics of species ranges (Appendix S3a), leading to generally well-defined spatial patterns of overlap between exposure and vulnerability (red and blue scale maps in Fig. 2).
Figure 2.
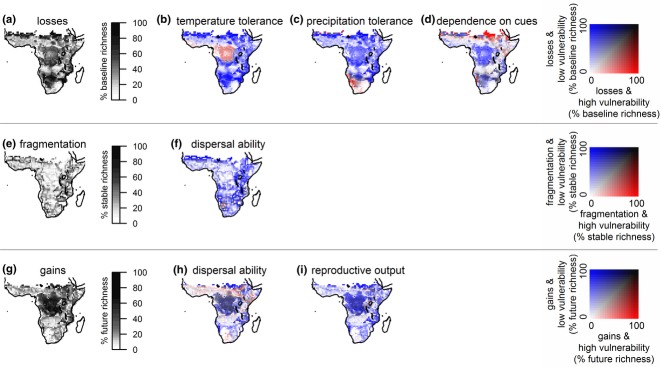
Overlap of climate change exposure and intrinsic vulnerability for a subset of 195 wide-ranging sub-Saharan African amphibians. The greyscale maps show pixel-based proportions of species exposed to losses, increased fragmentation, or gains of climate space: i.e. the proportions of species with baseline climatic suitability in a pixel that lose suitability in that pixel in the future (a), the proportions of species with suitability through time in a pixel that suffer increased fragmentation of climate space around that pixel (e), and the proportions of species with future suitability in a pixel that had no suitability in that pixel in the baseline (g), respectively. The red and blue scale maps compare, for each pixel, the proportions of losses (b–d), increased fragmentation (f) or gains (h–i) that correspond to species with higher vulnerability versus species with lower vulnerability due to selected traits (see Table 1). Different shades on the maps thus indicate dominance of losses, fragmentation or gains for species highly vulnerable (red), species less vulnerable (blue), both species with high and lower vulnerability (black) or none (white). Maps were drawn using quantile classification.
Local losses of climatic suitability were projected throughout most of the study area, with the Congo Basin and the species-poor arid areas of the Sahel and Namibia/Botswana showing the highest proportions of species losing local suitability in the future (Fig. 2a). Geographical areas with greatest proportions of losses overlapping with vulnerability due to traits varied across the three selected traits: the Congo Basin and coastal West Africa for temperature tolerance (red shaded areas in Fig. 2b), South Africa and especially Namibia for precipitation tolerance (red shaded areas in Fig. 2c), and few scattered areas in the Sahel, the Albertine Rift and Namibia for dependence on precipitation cues (red shaded areas in Fig. 2d). Most projected increases in fragmentation of climate space (Fig. 2e) were for species with low vulnerability due to dispersal traits (blue shaded areas in Fig. 2f). Projected gains (Fig. 2g) may have been overestimated due to poor dispersal ability in the Congo Basin, and especially in areas extending from West Africa to the Ethiopian highlands as well as western South Africa (grey and red shaded areas in Fig. 2h). Gains for species with lower reproductive output were fewer and more scattered throughout the same areas (red shaded areas in Fig. 2i).
Among the three groups of species with different combinations of threats and opportunities, ‘contracting in situ’ and ‘obligate shifting’ species had significantly smaller geographical range sizes than ‘expanding’ species or those species not in the three groups (P-value < 0.05, Student's t-test; see Appendix S3b). For each group, we compared their modelled future distributions of climatic suitability to future projections modified in the following way: losses for species with lower vulnerability due to climatic tolerance were converted into presences, and gains for species with high vulnerability due to dispersal ability were transformed in absences (Fig. 3).
Figure 3.
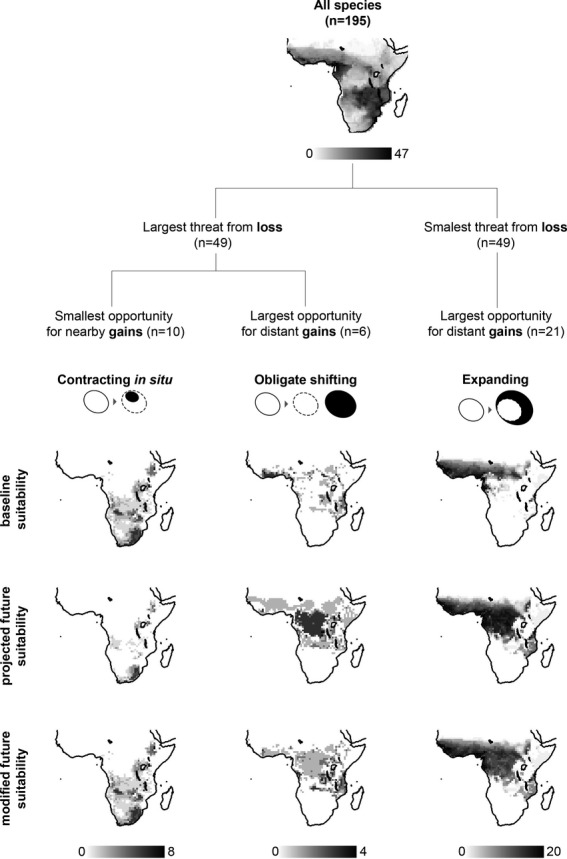
Potential effect of species' climate change vulnerability on projections of climate change exposure for three groups of wide-ranging sub-Saharan African amphibians. Species were classified into ‘contracting in situ’ (n = 10), ‘obligate shifting’ (n = 6) and ‘expanding’ (n = 21) based on projected threats and opportunities from climate change. The first node of the tree classifies species based on overall losses of suitable climate, and the second node is based on overall gains of climatic suitability and distances to newly suitable areas. For each metric, only the extreme cases are considered, i.e. species below the 25th and above the 75th percentiles of the distribution of values for all species. The three groups thus obtained are illustrated with diagrams of the shift from baseline climate space (left, white circles) to future climate space (right, dark circles, with the baseline climate space represented by white circles with dashed lines). For each group, the maps show the projected suitability in the baseline (first row) and future (second row) time periods, and the future suitability modified by omitting losses for species with lower vulnerability due to climatic tolerance and the gains for species with poor dispersal ability (third row).
‘Contracting in situ’ wide-ranging species occurred mainly in montane areas, which also hold the majority of the narrow-ranging species excluded from our analysis. Although exposed to large overall losses, species in this group had greater tolerance to climatic variation, and thus the modified future projections were more conservative. For ‘obligate shifting’ species, occurring in West and East African coastal forests and along the eastern border of the Congo Basin, dispersal traits had the potential to modify projections of exposure. Whereas losses in West Africa were concordant with the species' high vulnerability due to narrow tolerance to climatic variation, gains in the Congo Basin were partly associated with poor dispersers and may thus have been overestimated. Species in the ‘expanding’ group occurred along a broad band extending from West Africa to west of the Ethiopian highlands. After discounting the few losses of species with lower vulnerability due to the plasticity trait and the gains of a quarter of species with poor dispersal ability, future projections for this group remained very similar. Overall, correlation between projected and modified future suitability was lowest for ‘obligate shifting’ species and ‘contracting in situ’ species, and highest for ‘expanding’ species (Pearson's product–moment correlation coefficient 0.60, 0.74 and 0.97, respectively, P-value < 0.05).
Discussion
Our analysis for wide-ranging sub-Saharan African amphibians shows how a simple framework can be applied that combines familiar projections of climate change exposure with response-mediating traits, to help deliver more realistic climate change risk assessments. The framework teases apart the threats and opportunities resulting from exposure of species to climate change, and identifies key traits that potentially mediate species' responses to each. Its application is contingent on the availability and quality of both exposure and trait data, as our analysis for sub-Saharan African amphibians clearly illustrates.
Availability of bioclimatic envelope model projections of future climatic suitability is limited by the number of existing records of species occurrence (Feeley & Silman, 2011), and has biased our sample towards wide-ranging species. Trait data availability was a further limitation, although it affected a smaller number of species. Together, these limitations have skewed our sample towards larger geographical range sizes, lower level of current threat, narrower climatic tolerance breadth, and larger reproductive outputs (Appendix S2). Such biases reduce the representativeness of the results and limit the scope for conservation guidance. Indeed, most threatened amphibians were excluded, particularly those from the Cameroon highlands and Eastern Afromontane centres of diversity. Phylogenetic inference methods exist that could circumvent the bias in the trait data (Nakagawa & Freckleton, 2008; Buckley & Kingsolver, 2012), but, for the bulk of the species excluded here, new approaches that overcome limitations of correlative models are needed to assess exposure of narrow-ranging species to climate change.
Application of our framework is also dependent on the quality of trait data. First, for some of the traits the classification of vulnerability (Foden et al., 2008, 2013) is contingent on the initial pool of species used for scoring (704 sub-Saharan African species). Classes of high and lower vulnerability were defined based on the quantile distribution of trait values across this wider pool of species, yielding a relative classification for all species that is unlikely to reflect the real vulnerability of individual species.
Second, the case of sub-Saharan African amphibians illustrates the framework's application when traits in the strict sense (sensu Violle et al., 2007) are largely unavailable, a situation that is common for many taxonomic groups (e.g. González-Suárez et al., 2012). Some of the data used were derived from the characterization of known distributions of species (Foden et al., 2008, 2013) as proxies for traits. One example is tolerance to climatic variation, inferred with statistical approaches relating species ranges to climate variables. Whereas previous studies (e.g. Thuiller et al., 2005a; Feeley et al., 2012) used similar approaches, such proxies do not strictly summarize traits but the interaction between traits and the environment. Climatic tolerance inferred with these approaches may represent under-estimates when climatic niches realized in the present are truncated (Feeley & Silman, 2010). The finding that upper thermal limits tend to be highly conserved while lower limits are highly variable across organisms (Araújo et al., 2013) further indicates that such proxies may be misleading. Only the physiological limits of species could indicate their full capacity to adapt to climatic changes through plastic adaptation. One exemplar study is that of Arribas et al. (2012), where an experimental approach was applied to estimating the safety thermal limits and acclimation capacity of water beetles. Likewise, estimates of species' dispersal abilities derived from empirical data on organism movement (e.g. Gamble et al., 2007), phylogenetic distances (Arribas et al., 2012), or morphological or life-history traits (e.g. Baselga et al., 2012; Whitmee & Orme, 2013) would more reliably predict the ability of species to track suitable climates than estimates based on known geographical ranges of species.
Despite the shortcomings of the trait and exposure data used here, our results illustrate how interpretation of spatial projections of species' exposure to climate change can be altered with consideration of species' climate change vulnerability. Projections under climate change have been shown elsewhere to vary because of assumptions regarding the thermal tolerance of species (Feeley et al., 2012), and differences in dispersal capacity (Urban et al., 2012). Our analysis for wide-ranging sub-Saharan African amphibians highlights the Congo Basin and arid regions of Southern Africa, where projected losses were compounded by species' sensitivity to climatic variation, and expected gains were precluded by poor dispersal ability (Fig. 2). Tropical ectotherms have been highlighted for their vulnerability to climate change because they are living close to their upper thermal limits (Deutsch et al., 2008; Huey et al., 2009) and have narrower thermal breadths (Sunday et al., 2012). The lowland tropics in particular have been suggested to hold a high concentration of ectotherms sharing vulnerability traits (Huey et al., 2012), and to face biotic attrition in the future (Colwell et al., 2008). The shallower temperature gradient in tropical lowlands (Colwell et al., 2008) increases distances required to track suitable climates, potentially imposing a challenge to poor dispersers.
Among the groups of wide-ranging amphibians exposed to different combinations of threats and opportunities, those most exposed – ‘contracting in situ’ and ‘obligate shifting’ species – showed the strongest modifying effect of vulnerability on projections of exposure (Fig. 3). Whereas poor dispersal ability rendered projected gains to be unlikely for ‘obligate shifting’ species, losses for ‘contracting in situ’ species were discordant with the group's lower vulnerability with respect to plasticity. Exposure of the narrow-ranging montane species excluded from this study probably mirrors more closely that of our ‘contracting in situ’ group, which includes species with ranges among the smallest of our sample and encompassing mountain regions (Fig. 3). For narrow-ranging species, contraction of the available marginal climatic conditions that are suitable for them may play an important role (Williams et al., 2007; Ohlemüller et al., 2008). At the same time, in the topographically diverse regions where these species occur, microclimates not captured at the coarse scale used here may facilitate adaptation to changing climates (Pearson, 2006). Besides the potential threat from climate change, the high-elevation, range-restricted species with low fecundity that were excluded from our study (Appendix S2) are also susceptible to declines associated with the chytridiomycosis disease (Bielby et al., 2008). By contrast, future projections for ‘expanding’ species remained largely unchanged after consideration of traits, although this may result from our simplistic approach whereby we retained all gains by good dispersers irrespective of the distances involved. Nevertheless, the current levels of loss and fragmentation of natural ecosystems are likely to pose an important challenge to dispersal (Opdam & Wascher, 2004).
We propose that application of our framework can provide information about the causes, spatial distribution and conservation implications of climate change risk (Thomas et al., 2011). Conservation needs will differ between species projected to partly retain suitability where they occur and those for which suitability shifts to new areas. In the latter case, gains in new areas may compensate losses and even lead to an increased, displaced, climate space. However, if newly suitable areas are distant, poor dispersal ability may place these ‘obligate shifting’ species at risk. In risk assessments based on changes in total area of climatic suitability (e.g. Thuiller et al., 2005b; Araújo et al., 2006; Huntley et al., 2006; Feeley et al., 2012; Triviño et al., 2013) such species may be classified as ‘winners’ and thus be overlooked. Indeed, the ‘obligate shifting’ amphibians in our study were projected to increase their overall climate space, but were flagged for the low in situ persistence and the large discontinuity between baseline and future climate space, compounded by poor dispersal ability.
Previous frameworks to guide conservation under climate change separated the threat of loss from opportunities for gains of climate space (Thomas et al., 2011; Arribas et al., 2012). The framework we present here considers an additional extrinsic factor that is seldom explored – changes in the level of fragmentation of climate space (but see Serra-Diaz et al., 2014). Besides influencing the probability and speed of range expansion (Hodgson et al., 2011), the level of aggregation of species records has been found to be a strong covariate of local extinction risk of bird species in Britain (Araújo et al., 2002). At the coarse resolution of our study, our measure of fragmentation and the correspondent trait provide some indication on the risk of isolation from surrounding areas of suitable climate, although with more limitations in topographically diverse regions. The level of fragmentation characterized through the metric of contagion is particularly important at fine scales, where the risk from both increased isolation and decreased area of fragments of suitable climate becomes more evident. Measures of contagion that consider both effects could thus be used at finer scales, borrowing from metapopulation and landscape theory (Hanski, 2005). Yet the parallel between within-generation habitat fragmentation at the landscape level, on one hand, and increased fragmentation of climate space at larger spatial and temporal scales like the ones used here, on the other hand, is not clear-cut and needs more attention.
Our framework relies on the identification and quantification of traits that potentially mediate the effect of climate change exposure on species. Important response-mediating traits are likely to vary across taxa, and further studies of trait correlates of observed changes in ranges under changing climates can help expand and adapt our list of examples (Fig. 1). Where available, more precise and reliable estimates of response-mediating traits allow for a closer coupling of bioclimatic envelope models with traits, leading to projections that are more appropriate for conservation planning. For example, measures of dispersal capacity can be used to filter, pixel by pixel, projected gains of climate space depending on their distance from present distributions (see Bateman et al., 2013, for a review of options of dispersal scenarios in predictive modelling). Similarly, physiological climatic limits can provide the bounds for species persistence in modelling exercises (Arribas et al., 2012; Summers et al., 2012). Projections of climate change exposure typically discount other important factors such as biotic interactions, local population adaptations and landscape structure, but assessing the robustness of projections to the effect of response-mediating traits is one crucial step towards increased realism.
Acknowledgments
We are grateful to Louis Hansen for help matching the taxonomy between the two datasets, Zhiheng Wang for assistance with Fig. 2, and Lucas Joppa for drawing our attention to the importance of increased fragmentation of climate space. We thank John Measey, Anni Arponen, Johanna Eklund, Laura Meller, Antti Takolander and three anonymous referees for comments on the manuscript. R.A.G. thanks the Metapopulation Research Group at the University of Helsinki for providing the supportive environment in which much of this work was developed, and the reserve-selection journal club members for helpful discussion. R.A.G. is funded through a FCT PhD studentship (SFRH/BD/65615/2009), M.C. through the RESPONSES project, and M.B.A. through the FCT PTDC/AAC-AMB/98163/2008 project. R.A.G., M.B.A., N.D.B. and C.R. thank the Danish National Research Foundation for support to the Center for Macroecology, Evolution and Climate. M.B.A. also acknowledges support from the Integrated Program of IC&DT Call Nº 1/SAESCTN/ALENT-07-0224-FEDER-001755.
Biosketches
Raquel A. Garcia is interested in the climate change risks facing African biodiversity, and in combining different data and approaches for risk assessments in Africa and elsewhere.
Author contributions: N.D.B., R.A.G., W.B.F., M.C. and M.B.A. discussed the original idea, and R.A.G. and M.C. conceptualized the study. R.A.G. performed the analysis, and R.A.G. wrote the paper with comments from all authors. A.G. and W.B.F. provided trait data.
SUPPORTING INFORMATION
Additional Supporting Information may be found in the online version of this article:
Appendix S1 List of sub-Saharan African amphibians included in the study.
Appendix S2 Representativeness of the subset of sub-Saharan African amphibians used in the study.
Appendix S3 Comparison of climate change vulnerability traits across different groups of sub-Saharan African amphibians.
References
- Angert AL, Crozier LG, Rissler LJ, Gilman SE, Tewksbury JJ. Chunco AJ. Do species' traits predict recent shifts at expanding range edges? Ecology Letters. 2011;14:677–689. doi: 10.1111/j.1461-0248.2011.01620.x. [DOI] [PubMed] [Google Scholar]
- Araújo MB. Williams PH. Selecting areas for species persistence using occurrence data. Biological Conservation. 2000;96:331–345. [Google Scholar]
- Araújo MB, Williams PH. Fuller RJ. Dynamics of extinction and the selection of nature reserves. Proceedings of the Royal Society B: Biological Sciences. 2002;269:1971–1980. doi: 10.1098/rspb.2002.2121. [DOI] [PMC free article] [PubMed] [Google Scholar]
- Araújo MB, Thuiller W. Pearson RG. Climate warming and the decline of amphibians and reptiles in Europe. Journal of Biogeography. 2006;33:1712–1728. [Google Scholar]
- Araújo MB, Guilhaumon F, Neto DR, Pozo I. Calmaestra RG. Impactos, vulnerabilidad y adaptación al cambio climático de la biodiversidad española. 2. Fauna de vertebrados. Madrid: Dirección General de Medio Natural y Política Forestal, Ministerio de Medio Ambiente y Medio Rural y Marino & Museo Nacional de Ciencias Naturales (CSIC); 2011. [Google Scholar]
- Araújo MB, Ferri-Yáñez F, Bozinovic F, Marquet PA. Valladares F. Heat freezes niche evolution. Ecology Letters. 2013;16:1206–1219. doi: 10.1111/ele.12155. [DOI] [PubMed] [Google Scholar]
- Arribas P, Abellán P, Velasco J, Bilton DT, Millán A. Sánchez-Fernández D. Evaluating drivers of vulnerability to climate change: a guide for insect conservation strategies. Global Change Biology. 2012;18:2135–2146. [Google Scholar]
- Barbaro L. Van Halder I. Linking bird, carabid beetle and butterfly life-history traits to habitat fragmentation in mosaic landscapes. Ecography. 2009;32:321–333. [Google Scholar]
- Baselga A, Lobo JM, Svenning J-C, Aragón P. Araújo MB. Dispersal ability modulates the strength of the latitudinal richness gradient in European beetles. Global Ecology and Biogeography. 2012;21:1106–1113. [Google Scholar]
- Bateman BL, Murphy HT, Reside AE, Mokany K. VanDerWal J. Appropriateness of full-, partial- and no-dispersal scenarios in climate change impact modelling. Diversity and Distributions. 2013;19:1224–1234. [Google Scholar]
- Beaumont LJ. Hughes L. Potential changes in the distributions of latitudinally restricted Australian butterfly species in response to climate change. Global Change Biology. 2002;8:954–971. [Google Scholar]
- Betzholtz P-E, Pettersson LB, Ryrholm N. Franzén M. With that diet, you will go far: trait-based analysis reveals a link between rapid range expansion and a nitrogen-favoured diet. Proceedings of the Royal Society B: Biological Sciences. 2013;280:20122305. doi: 10.1098/rspb.2012.2305. [DOI] [PMC free article] [PubMed] [Google Scholar]
- Bielby J, Cooper N, Cunningham AA, Garner TWJ. Purvis A. Predicting susceptibility to future declines in the world's frogs. Conservation Letters. 2008;1:82–90. [Google Scholar]
- Blaustein AR. Kiesecker JM. Complexity in conservation: lessons from the global decline of amphibian populations. Ecology Letters. 2002;5:597–608. [Google Scholar]
- Botts EA, Erasmus BFN. Alexander GJ. Small range size and narrow niche breadth predict range contractions in South African frogs. Global Ecology and Biogeography. 2013;22:567–576. [Google Scholar]
- Buckley LB. Kingsolver JG. Functional and phylogenetic approaches to forecasting species' responses to climate change. Annual Review of Ecology, Evolution, and Systematics. 2012;43:205–226. [Google Scholar]
- Buckley LB, Hurlbert AH. Jetz W. Broad-scale ecological implications of ectothermy and endothermy in changing environments. Global Ecology and Biogeography. 2012;21:873–885. [Google Scholar]
- Chevin L-M, Lande R. Mace GM. Adaptation, plasticity, and extinction in a changing environment: towards a predictive theory. PLoS Biology. 2010;8:e1000357. doi: 10.1371/journal.pbio.1000357. [DOI] [PMC free article] [PubMed] [Google Scholar]
- Chown SL. Trait-based approaches to conservation physiology: forecasting environmental change risks from the bottom up. Philosophical Transactions of the Royal Society B: Biological Sciences. 2012;367:1615–1627. doi: 10.1098/rstb.2011.0422. [DOI] [PMC free article] [PubMed] [Google Scholar]
- Colwell RK, Brehm G, Cardelús CL, Gilman AC. Longino JT. Global warming, elevational range shifts, and lowland biotic attrition in the wet tropics. Science. 2008;322:258–261. doi: 10.1126/science.1162547. [DOI] [PubMed] [Google Scholar]
- Cowling RM. Pressey RL. Rapid plant diversification: planning for an evolutionary future. Proceedings of the National Academy of Sciences USA. 2001;98:5452–5457. doi: 10.1073/pnas.101093498. [DOI] [PMC free article] [PubMed] [Google Scholar]
- Deutsch CA, Tewksbury JJ, Huey RB, Sheldon KS, Ghalambor CK, Haak DC. Martin PR. Impacts of climate warming on terrestrial ectotherms across latitude. Proceedings of the National Academy of Sciences USA. 2008;105:6668–6672. doi: 10.1073/pnas.0709472105. [DOI] [PMC free article] [PubMed] [Google Scholar]
- Donnelly MA. Crump ML. Potential effects of climate change on two Neotropical amphibian assemblages. Climatic Change. 1998;39:541–561. [Google Scholar]
- Feeley KJ. Silman MR. Biotic attrition from tropical forests correcting for truncated temperature niches. Global Change Biology. 2010;16:1830–1836. [Google Scholar]
- Feeley KJ. Silman MR. The data void in modeling current and future distributions of tropical species. Global Change Biology. 2011;17:626–630. [Google Scholar]
- Feeley KJ, Malhi Y, Zelazowski P. Silman MR. The relative importance of deforestation, precipitation change, and temperature sensitivity in determining the future distributions and diversity of Amazonian plant species. Global Change Biology. 2012;18:2636–2647. [Google Scholar]
- Foden WB, Mace GM, Vié J-C, Angulo A, Butchart SHM, DeVantier L, Dublin HT, Gutsche A, Stuart SN. Turak E. Species susceptibility to climate change impacts. In: Vié J-C, Hilton-Taylor C, Stuart SN, editors; Wildlife in a changing world: an analysis of the 2008 IUCN Red List of Threatened Species. Gland, Switzerland: IUCN; 2008. pp. 77–88. [Google Scholar]
- Foden WB, Butchart SHM, Stuart SN, Vié J-C, Akçakaya HR, Angulo A, DeVantier LM, Gutsche A, Turak E, Cao L, Donner SD, Katariya V, Bernard R, Holland RA, Hughes AF, O'Hanlon SE, Garnett ST, Şekercioğlu ÇH. Mace GM. Identifying the world's most climate change vulnerable species: a systematic trait-based assessment of all birds, amphibians and corals. PLoS ONE. 2013;8:e65427. doi: 10.1371/journal.pone.0065427. [DOI] [PMC free article] [PubMed] [Google Scholar]
- Fritz SA, Bininda-Emonds ORP. Purvis A. Geographical variation in predictors of mammalian extinction risk: big is bad, but only in the tropics. Ecology Letters. 2009;12:538–549. doi: 10.1111/j.1461-0248.2009.01307.x. [DOI] [PubMed] [Google Scholar]
- Gamble LR, McGarigal K. Compton BW. Fidelity and dispersal in the pond-breeding amphibian, Ambystoma opacum: implications for spatio-temporal population dynamics and conservation. Biological Conservation. 2007;139:247–257. [Google Scholar]
- Garcia RA, Burgess ND, Cabeza M, Rahbek C. Araújo MB. Exploring consensus in 21st century projections of climatically suitable areas for African vertebrates. Global Change Biology. 2012;18:1253–1269. [Google Scholar]
- González-Suárez M, Lucas PM. Revilla E. Biases in comparative analyses of extinction risk: mind the gap. Journal of Animal Ecology. 2012;81:1211–1222. doi: 10.1111/j.1365-2656.2012.01999.x. [DOI] [PubMed] [Google Scholar]
- González-Suárez M, Gómez A. Revilla E. Which intrinsic traits predict vulnerability to extinction depends on the actual threatening processes. Ecosphere. 2013;4:76. [Google Scholar]
- Hansen AJ, Burgess ND, Fjeldså J. Rahbek C. One degree resolution databases of the distribution of 739 species of amphibians in Sub-Saharan Africa. Copenhagen: Zoological Museum, University of Copenhagen; 2007. On-line data source-version 1.00. [Google Scholar]
- Hanski I. The shrinking world: ecological consequences of habitat loss. Oldendorf/Luhe: International Ecology Institute; 2005. [Google Scholar]
- Heikkinen RK, Luoto M, Leikola N, Pöyry J, Settele J, Kudrna O, Marmion M, Fronzek S. Thuiller W. Assessing the vulnerability of European butterflies to climate change using multiple criteria. Biodiversity and Conservation. 2009;19:695–723. [Google Scholar]
- Henle K, Davies KF, Kleyer M, Margules C. Settlele J. Predictors of species sensitivity to fragmentation. Biodiversity and Conservation. 2004;13:207–251. [Google Scholar]
- Hodgson JA, Thomas CD, Cinderby S, Cambridge H, Evans P. Hill JK. Habitat re-creation strategies for promoting adaptation of species to climate change. Conservation Letters. 2011;4:289–297. [Google Scholar]
- Hof C, Araújo MB, Jetz W. Rahbek C. Additive threats from pathogens, climate and land-use change for global amphibian diversity. Nature. 2011;480:516–519. doi: 10.1038/nature10650. [DOI] [PubMed] [Google Scholar]
- Huey RB, Deutsch CA, Tewksbury JJ, Vitt LJ, Hertz PE, Álvarez Pérez HJ. Garland T. Why tropical forest lizards are vulnerable to climate warming. Proceedings of the Royal Society B: Biological Sciences. 2009;276:1939–1948. doi: 10.1098/rspb.2008.1957. [DOI] [PMC free article] [PubMed] [Google Scholar]
- Huey RB, Kearney MR, Krockenberger A, Holtum JAM, Jess M. Williams SE. Predicting organismal vulnerability to climate warming: roles of behaviour, physiology and adaptation. Philosophical Transactions of the Royal Society B: Biological Sciences. 2012;367:1665–1679. doi: 10.1098/rstb.2012.0005. [DOI] [PMC free article] [PubMed] [Google Scholar]
- Huntley B, Collingham YC, Green RE, Hilton GM, Rahbek C. Willis SG. Potential impacts of climatic change upon geographical distributions of birds. Ibis. 2006;148:8–28. [Google Scholar]
- Isaac NJB. Cowlishaw G. How species respond to multiple extinction threats. Proceedings of the Royal Society B: Biological Sciences. 2004;271:1135–1141. doi: 10.1098/rspb.2004.2724. [DOI] [PMC free article] [PubMed] [Google Scholar]
- Li Y, Cohen JM. Rohr JR. Review and synthesis of the effects of climate change on amphibians. Integrative Zoology. 2013;8:145–161. doi: 10.1111/1749-4877.12001. [DOI] [PubMed] [Google Scholar]
- Lips KR, Reeve JD. Witters LR. Ecological traits predicting amphibian population declines in Central America. Conservation Biology. 2003;17:1078–1088. [Google Scholar]
- Luck GW, Lavorel S, McIntyre S. Lumb K. Improving the application of vertebrate trait-based frameworks to the study of ecosystem services. Journal of Animal Ecology. 2012;81:1065–1076. doi: 10.1111/j.1365-2656.2012.01974.x. [DOI] [PubMed] [Google Scholar]
- Midgley GF, Hannah L, Millar D, Thuiller W. Booth A. Developing regional and species-level assessments of climate change impacts on biodiversity in the Cape Floristic Region. Biological Conservation. 2003;112:87–97. [Google Scholar]
- Murray KA, Rosauer D, McCallum H. Skerratt LF. Integrating species traits with extrinsic threats: closing the gap between predicting and preventing species declines. Proceedings of the Royal Society B: Biological Sciences. 2011;278:1515–1523. doi: 10.1098/rspb.2010.1872. [DOI] [PMC free article] [PubMed] [Google Scholar]
- Nakagawa S. Freckleton RP. Missing inaction: the dangers of ignoring missing data. Trends in Ecology and Evolution. 2008;23:592–596. doi: 10.1016/j.tree.2008.06.014. [DOI] [PubMed] [Google Scholar]
- Nakićenović N. Swart R. Special report on emissions scenarios. Cambridge, UK: Cambridge University Press; 2000. [Google Scholar]
- Ohlemüller R, Anderson BJ, Araújo MB, Butchart SHM, Kudrna O, Ridgely RS. Thomas CD. The coincidence of climatic and species rarity: high risk to small-range species from climate change. Biology Letters. 2008;4:568–572. doi: 10.1098/rsbl.2008.0097. [DOI] [PMC free article] [PubMed] [Google Scholar]
- Opdam P. Wascher D. Climate change meets habitat fragmentation: linking landscape and biogeographical scale levels in research and conservation. Biological Conservation. 2004;117:285–297. [Google Scholar]
- Pannell JR. Barrett SCH. Baker's law revisited: reproductive assurance in a metapopulation. Evolution. 1998;52:657–668. doi: 10.1111/j.1558-5646.1998.tb03691.x. [DOI] [PubMed] [Google Scholar]
- Parmesan C. Yohe G. A globally coherent fingerprint of climate change impacts across natural systems. Nature. 2003;421:37–42. doi: 10.1038/nature01286. [DOI] [PubMed] [Google Scholar]
- Pearson RG. Climate change and the migration capacity of species. Trends in Ecology and Evolution. 2006;21:111–113. doi: 10.1016/j.tree.2005.11.022. [DOI] [PubMed] [Google Scholar]
- Pereira HM, Leadley PW, Proença V, et al. Scenarios for global biodiversity in the 21st century. Science. 2010;330:1496–1501. doi: 10.1126/science.1196624. [DOI] [PubMed] [Google Scholar]
- Perry AL, Low PJ, Ellis JR. Reynolds JD. Climate change and distribution shifts in marine fishes. Science. 2005;308:1912–1915. doi: 10.1126/science.1111322. [DOI] [PubMed] [Google Scholar]
- Peters RL. Darling JDS. The greenhouse effect and nature reserves. BioScience. 1985;35:707–717. [Google Scholar]
- Pöyry J, Luoto M, Heikkinen RK, Kuussaari M. Saarinen K. Species traits explain recent range shifts of Finnish butterflies. Global Change Biology. 2009;15:732–743. [Google Scholar]
- Purvis A, Gittleman JL, Cowlishaw G. Mace GM. Predicting extinction risk in declining species. Philosophical transactions of the Royal Society B: Biological Sciences. 2000;267:1947–1952. doi: 10.1098/rspb.2000.1234. [DOI] [PMC free article] [PubMed] [Google Scholar]
- Serra-Diaz JM, Franklin J, Ninyerola M, Davis FW, Syphard AD, Regan HM. Ikegami M. Bioclimatic velocity: the pace of species exposure to climate change. Diversity and Distributions. 2014;20:169–180. [Google Scholar]
- Sinervo B, Méndez-de-la-Cruz F, Miles DB, et al. Erosion of lizard diversity by climate change and altered thermal niches. Science. 2010;328:894–899. doi: 10.1126/science.1184695. [DOI] [PubMed] [Google Scholar]
- Summers DM, Bryan BA, Crossman ND. Meyer WS. Species vulnerability to climate change: impacts on spatial conservation priorities and species representation. Global Change Biology. 2012;18:2335–2348. [Google Scholar]
- Sunday JM, Bates AE. Dulvy NK. Thermal tolerance and the global redistribution of animals. Nature Climate Change. 2012;2:686–690. [Google Scholar]
- Thomas CD, Hill JK, Anderson BJ, Bailey S, Beale CM, Bradbury RB, Bulman CR, Crick HQP, Eigenbrod F, Griffiths HM, Kunin WE, Oliver TH. Walmsle, y C.A., Watts, K., Worsfold, N.T. & Yardley, T A framework for assessing threats and benefits to species responding to climate change. Methods in Ecology and Evolution. 2011;2:125–142. [Google Scholar]
- Thuiller W, Lavorel S. Araújo MB. Niche properties and geographical extent as predictors of species sensitivity to climate change. Global Ecology and Biogeography. 2005a;14:347–357. [Google Scholar]
- Thuiller W, Lavorel S, Araújo MB, Sykes MT. Prentice IC. Climate change threats to plant diversity in Europe. Proceedings of the National Academy of Sciences USA. 2005b;102:8245–8250. doi: 10.1073/pnas.0409902102. [DOI] [PMC free article] [PubMed] [Google Scholar]
- Thuiller W, Lafourcade B, Engler R. Araújo MB. BIOMOD – a platform for ensemble forecasting of species distributions. Ecography. 2009;32:369–373. [Google Scholar]
- Triviño M, Cabeza M, Thuiller W, Hickler T. Araújo MB. Risk assessment for Iberian birds under global change. Biological Conservation. 2013;168:192–200. [Google Scholar]
- Urban MC, Tewksbury JJ. Sheldon KS. On a collision course: competition and dispersal differences create no-analogue communities and cause extinctions during climate change. Proceedings of the Royal Society B: Biological Sciences. 2012;279:2072–2080. doi: 10.1098/rspb.2011.2367. [DOI] [PMC free article] [PubMed] [Google Scholar]
- Van Bocxlaer I, Loader SP, Roelants K, Biju SD, Menegon M. Bossuyt F. Gradual adaptation toward a range-expansion phenotype initiated the global radiation of toads. Science. 2010;327:679–682. doi: 10.1126/science.1181707. [DOI] [PubMed] [Google Scholar]
- Violle C, Navas M-L, Vile D, Kazakou E, Fortunel C, Hummel I. Garnier E. Let the concept of trait be functional! Oikos. 2007;116:882–892. [Google Scholar]
- Whitmee S. Orme CDL. Predicting dispersal distance in mammals: a trait-based approach. Journal of Animal Ecology. 2013;82:211–221. doi: 10.1111/j.1365-2656.2012.02030.x. [DOI] [PubMed] [Google Scholar]
- Williams JW, Jackson ST. Kutzbach JE. Projected distributions of novel and disappearing climates by 2100 AD. Proceedings of the National Academy of Sciences USA. 2007;104:5738–5742. doi: 10.1073/pnas.0606292104. [DOI] [PMC free article] [PubMed] [Google Scholar]
- Williams SE, Shoo LP, Isaac JL, Hoffmann AA. Langham G. Towards an integrated framework for assessing the vulnerability of species to climate change. PLoS Biology. 2008;6:e325. doi: 10.1371/journal.pbio.0060325. [DOI] [PMC free article] [PubMed] [Google Scholar]
Associated Data
This section collects any data citations, data availability statements, or supplementary materials included in this article.
Supplementary Materials
Appendix S1 List of sub-Saharan African amphibians included in the study.
Appendix S2 Representativeness of the subset of sub-Saharan African amphibians used in the study.
Appendix S3 Comparison of climate change vulnerability traits across different groups of sub-Saharan African amphibians.