

Abstract
Chronic inflammation induced by endotoxin from a dysbiotic gut microbiota contributes to the development of obesity-related metabolic disorders. Modification of gut microbiota by a diet to balance its composition becomes a promising strategy to help manage obesity. A dietary scheme based on whole grains, traditional Chinese medicinal foods, and prebiotics (WTP diet) was designed to meet human nutritional needs as well as balance the gut microbiota. Ninety-three of 123 central obese volunteers (BMI ≥ 28 kg m−2) completed a self-controlled clinical trial consisting of 9-week intervention on WTP diet followed by a 14-week maintenance period. The average weight loss reached 5.79 ± 4.64 kg (6.62 ± 4.94%), in addition to improvement in insulin sensitivity, lipid profiles, and blood pressure. Pyrosequencing of fecal samples showed that phylotypes related to endotoxin-producing opportunistic pathogens of Enterobacteriaceae and Desulfovibrionaceae were reduced significantly, while those related to gut barrier-protecting bacteria of Bifidobacteriaceae increased. Gut permeability, measured as lactulose/mannitol ratio, was decreased compared with the baseline. Plasma endotoxin load as lipopolysaccharide-binding protein was also significantly reduced, with concomitant decrease in tumor necrosis factor-α, interleukin-6, and an increase in adiponectin. These results suggest that modulation of the gut microbiota via dietary intervention may enhance the intestinal barrier integrity, reduce circulating antigen load, and ultimately ameliorate the inflammation and metabolic phenotypes.
Keywords: gut microbiota, dietary intervention, chronic inflammation, metabolic syndrome
Introduction
The rapidly increasing prevalence of obesity and associated metabolic disorders has become a global public health threat (James, 2008). It is widely accepted that obesity is the result of a positive long-term energy imbalance with multifactorial etiologies involving genetic, metabolic, and environmental factors. Among the complex interactive processes, dietary pattern is considered to be of central importance (Bulló et al., 2007). Diet-induced obesity and metabolic abnormalities are closely associated with a chronic, low-grade, systemic inflammation as an important pathological driving force (Wellen & Hotamisligil, 2005; Shoelson et al., 2007).
Recent evidence indicates that the alteration in composition and/or activity of gut microbiota, the other genome that modulates human health, plays a pivotal role in the pathogenesis of obesity and related disorders (Musso et al., 2011; Zhao, 2013). Besides diet itself (Bulló et al., 2007), lipopolysaccharide, the cell wall component of Gram-negative bacteria living in the gut, has been demonstrated to induce the chronic inflammation in obesity, as purified lipopolysaccharide induced obesity and insulin resistance when subcutaneously infused into mice fed a normal diet (Cani et al., 2007). Knockout of the CD14 receptor gene, a coreceptor of TLR4, abolished the obesity-inducing capacity of the infused lipopolysaccharide, indicating that endotoxin-provoked inflammation is a critical condition for development of obesity and insulin resistance. An increase in the number of endotoxin-producing bacteria and elevated endotoxin load has also been observed in various obese cohorts from epidemiological studies (Guerra et al., 2007; Lepper et al., 2007; Moreno-Navarrete et al., 2011).
Due to the plasticity of the gut microbiota composition and the dominant role of diet in shaping its repertoire (Zhang et al., 2010), modulating gut microbiota by designed dietary intervention becomes a potentially promising strategy to demonstrate this chain of causation. Treatment aimed at gut microbiota by prebiotic nutrients has yielded encouraging results for the therapy of metabolic disorders in experimental models (Cani et al., 2008; Zhang et al., 2012). Some clinical studies using dietary intervention to manipulate gut microbiota and host metabolism have succeeded in linking the intervention to beneficial phenotypic changes (Parnell & Reimer, 2009). However, evidence is still needed to establish a causal link between dietary interventions, alteration of gut microbiota, and alleviation of inflammation in humans. We have designed a gut microbiota-targeted dietary intervention for central obese volunteers and showed in several case studies that this scheme can help morbidly obese volunteers lose substantial amounts of weight and recover from metabolic disorders. Our previous study showed that one morbidly obese volunteer lost 51.4 of 174.9 kg initial weight in 23 weeks by this dietary intervention (Fei & Zhao, 2013). We found that one endotoxin-producing bacterium, Enterobacter cloacae B29, was overgrown in the gut of this volunteer before intervention and induced obesity and insulin resistance in germfree mice (Fei & Zhao, 2013). The B29-induced obese mice showed increased endotoxin load in their serum, elevated inflammation both systemically and locally in liver and fat pad, and a disrupted expression pattern of genes in lipometabolism favoring fat synthesis and storage. To assess the possible contribution of changed gut microbiota to improve host health, we organized a self-controlled dietary intervention trial with 123 central obese volunteers [body mass index (BMI) ≥ 28 kg m−2]. The key indicators along the chain of causation as follows: gut microbiota composition (454 pyrosequencing), integrity of intestinal barrier (lactulose to mannitol excretion ratio), metabolic endotoxemia (lipopolysaccharide-binding protein, LBP), inflammatory state (pro-/anti-inflammatory cytokines), insulin resistance (fasting glucose, insulin, and HOMA index), and other metabolic phenotypes were evaluated during the dietary intervention.
Materials and methods
Han Chinese residents (25–55 years) from Taiyuan (Shanxi Province, China) were recruited to the trial if their BMI ≥ 28 kg m−2, waistline ≥ 80 cm (for female) or 90 cm (for male), and waist–hip ratio ≥ 0.85 (for female) or 0.90 (for male). Subjects were excluded with alcoholism, history, or presence of gastrointestinal pathologies, chronic pathologies such as diabetes (including type 1 and 2 diabetes), nephropathies, or liver cirrhosis, gastrointestinal surgery, history of administration of antibiotics lasting more than 3 days in the previous 3 months, psychiatric disorders, pituitary dysfunction, cancers, infectious diseases, deformity, anemia, or losing weight by surgery or drug in the past 3 months. The study was approved by the Ethics Committee of Chinese Clinical Trial Registry (No. ChiECRCT-000011), and written informed consent was obtained from each participant before their admission to the protocol.
Dietary intervention
We designed three ready-to-use food formulas based on whole grains, traditional Chinese medicinal (TCM) foods, and prebiotics (WTP diet). Formula No. 1 was a precooked mixture of 12 component materials from whole grains and TCM food plants that are rich in dietary fiber, including adlay (Coix lachrymal-jobi L.), oat, buckwheat, white bean, yellow corn, red bean, soybean, yam, big jujube, peanut, lotus seed, and wolfberry, which was prepared in the form of canned gruel (370 g wet weight per can) by a contract food manufacturer (Shanghai Meilin Meida Food Co., Ltd., Shanghai, China). Each can contained 100 g of ingredients (59 g carbohydrate, 15 g protein, 5 g fat, and 6 g fiber) and 336 kcal (70% carbohydrate, 17% protein, 13% fat). Formula No. 2 was a powder preparation for infusion (20 g per bag) containing bitter melon (Momordica charantia) and oligosaccharides, which included fructo-oligosaccharide and oligoisomaltose, and totally accounted for 34% of the formula No. 2. Formula No. 3 contained soluble prebiotics, including guar gum, pectin, konjac flour, other fermentable dietary fiber (Fibersol 2, resistant starch, hemicellulose), and oligosaccharides, and was administered in the form of powder for infusion (50 g per bag). The two infusion formulas were designed to facilitate the modulation of gut microbiota with a mild antibacterial effect and gas-producing function (Fei & Zhao, 2013).
We adopted the self-control design and allocated all recruited volunteers into intervention group (Fig. 1), which received the diet intervention consisting of an intervention (9 weeks, Phase I) and a maintenance period (14 weeks, Phase II). During Phase I, volunteers were prescribed customized menus. Three (for female) or four (for male) cans of gruel as staple food per day were recommended. The suggested dose of formula No. 2 was 40 g reconstituted with warm water in two divided doses taken orally, before breakfast and dinner. One bag of formula No. 3 was taken with more than 800 mL water once a week before breakfast. Appropriate amounts of vegetable, fruit, and legume products could be consumed everyday according to the dietitian's guidance to ensure complete nutrition. The diet contained 1000–1600 kcal, and the volunteers were allowed to consume enough of this diet to avoid hunger pangs. In Phase II, formula No. 1 was not supplied, and volunteers were required to prepare the staple diets with high-fiber, low animal source foods at home by themselves under a dietitian's guidance. The intake of meat (or fish or shrimp) was < 50 g each day. The dosage and administration of formula No. 2 were the same as in Phase I, but the dosage of formula No. 3 was reduced to 50 g every 2 weeks. All volunteers were asked to maintain their usual pattern of daily activities during the dietary intervention, including physical activity, lifestyle, and habit; avoid to take medications that may affect gut microbiota (such as antibiotics). The volunteers were also required to keep a journal during the trial for recording the intake of the interventional foods, additional snacks and medications they took, or any other unusual events in their daily life. They submitted the journal to the community clinic staff for inspection during their weekly return visits to make sure that they maintained their usual lifestyle except adoption of the new dietary scheme.
Fig. 1.
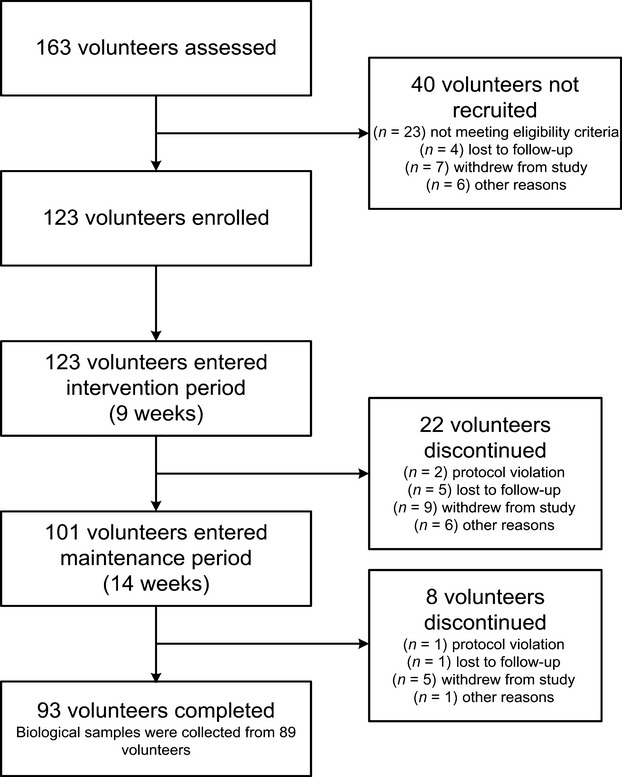
The schematic overview of the dietary intervention.
Anthropometric data, clinical laboratory analysis, and biological samples
During the first visit, research staff administered a general questionnaire, collecting information on demographic characteristics, health status, disease history, gastrointestinal conditions, dietary habit, and physical activity. A meal-based food frequency questionnaire, where the frequency and intake of food consumption over the last 12 months were recorded, was collected subsequently.
Clinical data were collected at the Shanxi High-tech Medical Testing Center. At scheduled intervals, namely the baseline (−30 day), the end of Phase I (9th week), and the end of Phase II (23rd week), all participants received a 24-h dietary recall questionnaire and a physical examination after overnight fasting. Body weight and height were determined by electronic column scales [Seca 799/220, Medical Scales and Measuring Systems (Hangzhou) Co. Ltd., China]. Whole blood samples were obtained for routine blood examination by an automated hematology analyzer (Sysmex K4500; Sysmex Corporation, Japan). Serum was collected to characterize biochemical and lipid profiles as well as ultrasensitive C-reactive protein (CRP) on an automatic biochemical analyzer (Sysmex Chemi-180; Sysmex Corporation). Insulin was detected by an immunoassay system (Immulite 1000; Siemens Healthcare Diagnostics Inc., Germany). The homoeostasis model assessment insulin resistance (HOMA1-IR) was calculated with the following formula: [fasting plasma glucose (mM) × fasting insulin (μU mL−1)]/22.5. HOMA2 was used to determine insulin sensitivity (%S), and β-cell function (%B) calculated by HOMA2 calculator version 2.2 (Wallace et al., 2004).
Plasma LBP was determined using an ELISA kit (USCN Life Science and Technology Co., Ltd, Wuhan, China). The assay has the mean minimum detectable dose (MDD) of 0.2 ng mL−1 and a measurable concentration range of 0.78–50 ng mL−1. TNF-α (MDD 0.106 pg mL−1; range 0.5–32 pg mL−1), interleukin-1β (IL-1β, MDD 0.057 pg mL−1; range 0.125–8 pg mL−1), IL-6 (MDD 0.039 pg mL−1; range 0.156–10 pg mL−1), and adiponectin (MDD 0.246 ng mL−1; range 3.9–250 ng mL−1; R&D Systems, Inc., Minneapolis, MN) were also measured using ELISA. The intra-assay and interassay coefficients of variation were < 5% and < 10%, respectively. Plasma samples were diluted appropriately and assayed according to the manufacturer's instructions.
Evaluation of gut permeability
The permeability measure was carried out following by the physical examination at the baseline, the end of Phase I and II, using lactulose/mannitol excretion ratio as marker of intestinal permeability. Volunteers drank 50 mL of a solution containing 5.0 g lactulose and 2.0 g mannitol. Urine samples were collected for the following 5 h, the volume voided was measured, and then aliquots were frozen at −80 °C until analysis. Sugar concentrations in the urine were determined with an ion chromatograph (DX-600; Dionex Corporation). Results were expressed as the 5-h urinary excretion of each sugar and as the lactulose/mannitol (L/M) ratio.
Gut microbiota profiling
Fresh stool samples were obtained from each subject while they stayed in a hotel and immediately put on ice and transported in the shortest possible time to −80 °C for storage until the gut microbiota analysis. Fecal microbiota DNA was extracted using bead beating and the InviMag Stool DNA Kit (KFml; Invitek GmbH, Germany). The extracted DNA from each sample was used as template to amplify the V3 region of the 16S rRNA gene. The products from different samples were mixed at equal ratios for pyrosequencing using the GS FLX platform (Roche).
Quality control of raw data was performed as described previously (Zhang et al., 2010). All high-quality pyrosequencing sequences were clustered using CD-HIT with 98% similarity. The most abundant sequence of each cluster was selected as a representative and aligned against the Greengenes database using the nearest alignment space termination algorithm. The resulting alignments were imported into the ARB (Ludwig et al., 2004) to generate the distance matrix of these sequences for phylotype binning by DOTUR (Schloss & Handelsman, 2005). Operational taxonomic units (OTUs) were defined at a certain threshold, which was a criterion for species-level delineation in previous studies (Huse et al., 2007). The most abundant sequence of each OTU was selected as the representative sequence and subjected to RDP classifier for taxonomical assignment with a bootstrap cutoff of 50%. The number of sequences per sample was corrected for differences in sequencing depth between samples by rarefication, that is, the same number of reads is randomly subsampled in each sample. Secondly, the absolute number of sequences of each OTU in each sample was converted to the relative abundance to reduce the effect of differences in sequence reads. The representative sequences, together with the abundance data, were used for taxon-based analysis.
Statistical analysis
Statistical analysis was carried out using the spss Statistics 17.0 Software Package (SPSS Inc.). According to the distribution of the variables, data were expressed as median (interquartile range) or mean ± standard deviation (SD)/standard error of the mean (SEM). The significance test was performed with the paired t-test or nonparametric-paired sample Wilcoxon signed-rank test, and correlations were determined by the Pearson and partial correlation tests. False discovery rate (FDR) was used to control the chance of making type I errors in multiple comparisons of bacterial taxa.
Results
A total of 123 obese volunteers (female : male = 69 : 54) were recruited into the trial. By the end of Phase I, 101 volunteers remained in the diet intervention trial. Eventually, 93 volunteers completed the study with a retention rate of 75.6%. Biological samples at baseline, end of Phase I, and completion of the trial were collected from 89 volunteers (female : male = 57 : 32), as shown in Fig. 1. There were no severe adverse reactions reported during the intervention or after a 2-year follow-up.
Improvement in clinical parameters
Clinical parameters of these subjects (n = 89) are summarized in Table 1. The average weight loss was 5.20 ± 3.58 kg (5.95 ± 3.94% of initial weight, P < 0.01) during Phase I and 5.79 ± 4.64 kg (6.62 ± 4.94%, P < 0.01) by the end of Phase II. Forty-six participants (51.69%) continued to lose weight during Phase II. At the completion of the trial, 18 participants (20.22%) had lost more than 10% of initial body weight, 33 participants (37.08%) lost from 5% to 10%, 30 participants (33.71%) lost from 0% to 5%, and eight participants (8.99%) had gained an average of 0.84 ± 0.70 kg (Supporting information, Fig. S1). Accordingly, the average BMI was significantly reduced from 31.5 (30.3–33.9 kg m−2) to 29.8 kg m−2 (28.7–32.2 kg m−2) at the end of Phase I (P < 0.01) and to 29.3 kg m−2 (28.4–31.4 kg m−2) by completion of the trial (P < 0.01).
Table 1.
Anthropometric and biochemical characteristics of the obese subjects at baseline, 9, and 23 weeks after the intervention
| Measurements | Baseline (−30 day) | Phase I (9 week) | Phase II (23 week) | Medical reference range |
|---|---|---|---|---|
| Weight (kg) | 84.1 (76.7–92.1) | 78.8** (71.6–87.6) | 78.0**† (72.0–87.3) | – |
| BMI (kg m−2) | 31.5 (30.3–33.9) | 29.8** (28.7–32.2) | 29.3**† (28.4–31.4) | 18–23 |
| FPG (mM) | 4.90 (4.64–5.28) | 4.74** (4.46–5.13) | 4.92†† (4.63–5.36) | 3.90–6.10 |
| FPI (μIU mL−1) | 11.9 (8.5–17.1) | 10.7** (6.9–14.3) | 9.2**†† (6.1–13.9) | 6–27 |
| HOMA1-IR | 2.63 (1.80–3.92) | 2.40** (1.47–3.15) | 1.96**† (1.25–3.09) | – |
| HOMA2-%Ba | 129.0 (106.8–172.5) | 125.4 (98.4–158.5) | 114.2**†† (91.6–137.0) | – |
| HOMA2-%Sa | 64.0 (44.7–91.1) | 70.9** (56.1–110.9) | 83.1** (54.1–121.8) | – |
| HbA1c (%) | 4.34 (3.99–4.60) | 4.83** (4.63–5.06) | 4.77** (4.57–4.99) | 3.8–5.8 |
| Triglycerides (mM) | 1.55 (1.09–2.25) | 1.17** (0.86–1.80) | 1.30** (0.80–1.88) | 0–1.7 |
| Total cholesterol (mM) | 4.45 ± 0.77 | 4.13 ± 0.77** | 4.38 ± 0.78†† | 3.00–5.17 |
| HDL-C (mM) | 1.05 ± 0.19 | 0.98 ± 0.21** | 1.09 ± 0.23*†† | > 0.91 |
| LDL-C (mM) | 2.46 ± 0.87 | 2.47 ± 0.76 | 2.61 ± 0.70*† | 0–4.16 |
| SBP (mmHg) | 127 (121–135) | 123** (116–131) | 125 (115–133) | ≤ 140 |
| DBP (mmHg) | 89 (80–97) | 84* (79–95) | 89 (80–95) | ≤ 90 |
BMI, body mass index; FPG, fasting plasma glucose; FPI, fasting plasma insulin; HOMA1-IR, homoeostasis model assessment insulin resistance; HOMA2-%S, homoeostasis model assessment insulin sensitivity; HOMA2-%B, homoeostasis model assessment β-cell function; HbA1c, glycated hemoglobin; HDL-C, high-density lipoprotein cholesterol; LDL-C, low-density lipoprotein cholesterol; SBP, systolic blood pressure; DBP, diastolic blood pressure.
Results were expressed as median (interquartile range) or mean ± SD.
HOMA2-%S and HOMA2-%B were calculated using HOMA2 calculator version 2.2 (Diabetes Trials Unit, University of Oxford, Oxford, UK).
Significantly different from baseline,
P < 0.05,
P < 0.01;
Significantly different from Phase I,
P < 0.05,
P < 0.01 (two-tailed test).
Overall, 60.67% (n = 54) of the participants were identified with metabolic syndrome at baseline as defined by the International Diabetes Federation (IDF) [central obesity plus any two of following abnormalities: raised triglycerides, reduced high-density lipoprotein (HDL) cholesterol, raised systolic or diastolic blood pressure, and raised fasting plasma glucose; central obesity was assumed if BMI > 30 kg m−2]. This percentage was dramatically reduced to 31.46% (n = 28) and 29.21% (n = 26) at end of Phase I and II, respectively. Some of the diagnostic components of metabolic syndrome, including central obesity, fasting glucose, triglycerides and blood pressure in Phase I and central obesity, triglycerides and HDL cholesterol in Phase II, were significantly improved as a cohort (Table 1). This trend was more obvious in those participants who had components over the cutoff of IDF metabolic syndrome criterion (Table 2). For example, fasting glucose fluctuated in the medical reference range in the cohort as a whole, while it restored to normal or near normal in the 12 participants whose fasting glucose were > 5.6 mM at baseline (Table 2 and Table S1).
Table 2.
The alteration of metabolic syndrome components during intervention. The cutoff is according to the metabolic syndrome definition of International Diabetes Federation (IDF)
| No. of volunteers over the limit of IDF MS cutoff | Baseline (−30 day) | Phase I (9 week) | Phase II (23 week) | IDF MS cutoff |
|---|---|---|---|---|
| BMIa (kg m−2; n = 75) | 32.1 (31.1–35.0) | 30.3** (29.0–32.7) | 29.9**† (28.6–32.9) | > 30 |
| FPG (mM; n = 12) | 6.03 ± 0.36 | 5.29 ± 0.63** | 5.66 ± 0.71 | ≥ 5.6 |
| TG (mM; n = 38) | 2.49 (2.01–3.41) | 1.83** (1.42–2.19) | 1.80** (1.30–2.37) | > 1.7 |
| HDL-C (mM; n = 68) | 0.99 ± 0.16 | 0.96 ± 0.21 | 1.06 ± 0.21**†† | – |
| Male (n = 20) | 0.86 ± 0.14 | 0.79 ± 0.15 | 0.94 ± 0.20*† | < 1.03 |
| Female (n = 48) | 1.05 ± 0.14 | 1.03 ± 0.19* | 1.10 ± 0.20†† | < 1.29 |
| SBP (mmHg; n = 37) | 137 (133–145) | 130** (125–137) | 130** (126–140) | ≥ 130 |
| DBP (mmHg; n = 54) | 95 (90–101) | 90** (82–100) | 94** (84–100) | ≥ 85 |
BMI, body mass index; FPG, fasting plasma glucose; TG, triglycerides; HDL-C, high-density lipoprotein cholesterol; SBP, systolic blood pressure; DBP, diastolic blood pressure.
Results were expressed as median (interquartile range) or mean ± SD.
If body mass index is over 30 kg m−2, central obesity can be assumed and waist circumference does not need to be measured.
Significantly different from baseline,
P < 0.05,
P < 0.01;
Significantly different from Phase I,
P < 0.05,
P < 0.01 (two-tailed test).
The significant reduction (P < 0.01, respectively) in fasting insulin, HOMA1-IR and HOMA2-%B index, and the increase of HOMA2-%S all implied an amelioration of insulin resistance (Table 1).
Modulation of gut microbiota composition
The barcoded 454 pyrosequencing of the 16S rRNA gene V3 region was used for a deep molecular inventory of the gut microbiota with an average of 3150 ± 937 reads per sample. A total of 156 867 usable unique sequences were obtained, and 3664 OTUs were delineated at a 96% homology cutoff. Sequences are available at the NCBI sequence read archive under accession numbers SAMN02143695–SAMN02143977. The alpha diversity decreased at the end of Phase II after the dietary intervention (Fig. S2). The entire microbial communities between samples have been compared using weighted (Fig. S3A) and unweighted UniFrac analysis (Fig. S3B). manova showed that the gut microbiota changed significantly after the dietary intervention [Fig. S3C (weighted) and D (unweighted)]. The interindividual variability of UniFrac distance was much greater than the intra-individual variation between each time point [Fig. S3E (weighted) and F (unweighted)].
As revealed by taxon-based analysis, the gut microbiome of the participants was composed of four dominant phyla, Firmicutes, Bacteroidetes, Proteobacteria, and Actinobacteria. Significant changes were observed in Actinobacteria and Proteobacteria populations due to the dietary intervention (Fig. 2a). The relative abundance of Actinobacteria increased significantly from 0.70 ± 0.91% (−30 day) to 1.43 ± 2.23% (9 week; P < 0.01 and 2.1% FDR) and 1.35 ± 2.39% (23 week; P < 0.05 and 8.9% FDR), while the number of Proteobacteria significantly decreased from 5.29 ± 5.48% (−30 day) to 3.54 ± 4.60% (9 week; P < 0.05 and 6.4% FDR) and 3.25 ± 4.19% (23 week; P < 0.01 and 0.9% FDR). We did not observe significant changes in the abundance of Bacteroidetes and Firmicutes or in the ratio of these two phyla during the dietary intervention when the volunteers lost significant amount of weight (Fig. 2b).
Fig. 2.
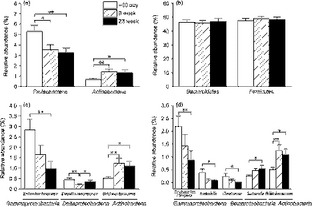
Dietary intervention changed intestinal microbiota. Groups of bacteria changed at the (a), (b) phylum, (c) family, and (d) genus levels. Bacteria numbers are expressed as the proportion of total intestinal microbiota, and data are mean ± SEM. *P < 0.05; **P < 0.01.
The abundance of the family Bifidobacteriaceae was significantly increased from 0.51 ± 0.83% (−30 day) to 1.24 ± 2.20% (9 week; P < 0.01 and 1.0% FDR) and slightly reduced to 1.09 ± 2.17% (23 week; Fig. 2c; P < 0.05 and 16.7% FDR). The family Enterobacteriaceae showed a decrease in abundance from 2.84 ± 4.90% (−30 day) to 1.65 ± 4.35% (9 week) and 0.97 ± 3.50% (23 week) during the trial, but the significant difference was only observed between 23 week and −30 day (Fig. 2c; P < 0.01 and 1.5% FDR). The family Desulfovibrionaceae was significantly reduced from 0.45 ± 0.77% (−30 day) to 0.20 ± 0.37% (9 week; P < 0.01 and 1.0% FDR), but returned to the baseline level at 23 week (c. 0.35 ± 0.62%, Fig. 2c; P > 0.05 and 53.7% FDR).
At the genus level, the proportion of the lipopolysaccharide-containing microbiota Escherichia/Shigella, Klebsiella, and Citrobacter, which contain opportunistic pathogens, was reduced significantly at week 23 compared with the baseline, while the genus Bifidobacterium increased significantly after the dietary intervention (Fig. 2d). We observed the positive correlations between Escherichia/Shigella and systolic blood pressure; Klebsiella and fasting glucose, HbA1c, L/M ratio, etc.; Citrobacter and weight, BMI and IL-1β (Table S2). There was also a weak positive correlation (r < 0.20) between Bifidobacterium and IL-1β (Table S2).
Changes in biomarkers along the causal pathway
We focused on the changes in the following biomarkers along the pathway likely connecting gut microbiota to the pathogenesis of obesity (Table 3 and Fig. 3): an intestinal permeability marker, L/M ratio, a gut-derived antigen load marker, LBP, inflammation markers including CRP, pro-inflammatory cytokines (TNF-α, IL-6, and IL-1β), anti-inflammatory adipokine (adiponectin), and insulin sensitivity. The L/M ratio and LBP were significantly decreased by the end of Phase I accompanied by improvements in systemic inflammatory tone, characterized by the reduction in CRP and IL-6, and the increase in adiponectin. Eventually, insulin sensitivity was increased.
Table 3.
Inflammatory biomarkers, LBP, and gut permeability of the obese subjects at baseline, 9, and 23 weeks after the intervention
| Measurements | Baseline (−30 day) | Phase I (9 week) | Phase II (23 week) | Medical reference range |
|---|---|---|---|---|
| C-reactive protein (mg L−1, n = 67) | 6.60 (5.10–8.20) | 4.90** (4.20–6.20) | 5.93*† (4.69–6.85) | 0–10 |
| LBP (μg mL−1) | 23.21 (15.54–35.50) | 19.98** (14.15–30.83) | 23.08†† (11.51–36.99) | – |
| IL-1β (pg mL−1) | 0.07 (0.03–0.12) | 0.07 (0.05–0.15) | 0.06 (0.04–0.12) | – |
| IL-6 (pg mL−1) | 2.28 (1.79–3.12) | 2.02* (1.62–2.62) | 1.68**†† (1.27–2.46) | – |
| TNF-α (pg mL−1) | 1.07 (0.87–1.49) | 1.03 (0.81–1.40) | 1.04* (0.82–1.50) | – |
| Adiponectin (μg mL−1) | 3.57 (2.56–5.22) | 3.82** (2.90–5.90) | 4.23**† (3.06–6.17) | – |
| L/M ratio (n = 76) | 0.026 (0.020–0.031) | 0.022** (0.019–0.026) | 0.023* (0.019–0.026) | – |
LBP, lipopolysaccharide-binding protein; IL, interleukin; TNF-α, tumor necrosis factor-α; L/M ratio, lactulose/mannitol ratio.
Results were expressed as median (interquartile range).
Significantly different from baseline,
P < 0.05,
P < 0.01;
Significantly different from Phase I,
P < 0.05,
P < 0.01 (two-tailed test).
Fig. 3.
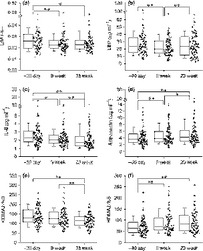
Dietary intervention improved gut permeability, lowered endotoxemia, and improved systemic inflammation tone. (a) L/M ratio; plasma concentrations of (b) LBP (μg mL−1); (c) IL-6 (pg mL−1); (d) adiponectin (μg mL−1); steady state beta cell function (e) HOMA2-%B and insulin sensitivity (f) HOMA2-%S. Data are median with the interquartile range. *P < 0.05; **P < 0.01.
Discussion
Modification of diet has become an integral part of lifestyle intervention to reduce metabolic syndrome risk factors, including low-grade systemic inflammation (Dandona et al., 1998; Bulló et al., 2007). However, not all weight loss interventions lead to reduced inflammation (e.g. inflammatory markers actually increased in overweight children after they effectively lost weight on a low-carbohydrate, high-fat diet; Alvarez et al., 2009). Weight loss achieved through diet has often been accompanied by a 7–48% reduction in CRP (Dietrich & Jialal, 2005). We observed a CRP reduction of 23.17% (Phase I), comparable to the report by Heilbronn et al. (2001) which cited a decrease in CRP of 26% in 83 healthy obese women after 12 weeks of energy restriction. The significant reduction in IL-6 and increase in adiponectin also indicated that inflammation was ameliorated in our volunteers. Diet-induced weight loss and alleviation of inflammation have been reported, but the underlying mechanism remains to be elucidated.
Cani et al. (2007) proposed that high-fat diet-induced obesity is associated with gut microbiota dysbiosis, which leads to increased gut permeability, promoting metabolic endotoxemia and initiating the development of low-grade inflammation and insulin resistance. The gut microbiota, one of the potential sources of low-grade inflammation (Zhao, 2013), was thus the expected target of our dietary intervention. Some clinical studies (mostly with < 50 participants) have tried to link dietary intervention for obesity with beneficial outcomes via modulation of gut microbiota (Parnell & Reimer, 2009; Diamant et al., 2011). Targeted analyses, such as FISH and qPCR, to evaluate the gut microbiota alteration in overweight or obese patients after dietary treatment have so far yielded inconsistent results (Ley et al., 2006; Duncan et al., 2008; Santacruz et al., 2009; Musso et al., 2010).
Our previous study shows that there seems to be a causal pathway between endotoxin producers in the gut and obesity/insulin resistance outcomes, which can be tracked by gut barrier permeability, endotoxin load in the serum, and inflammatory biomarkers (Fei & Zhao, 2013). In our current clinical trial, we evaluated whether this chain of causation might work in this cohort. Taxon-based comparison at the genus level identified significant changes in several key genera relevant to inflammatory and metabolic improvement in our participants. Most notably, OTUs in genus Bifidobacterium spp. were significantly enriched after the dietary intervention. In accordance with the increase in gut barrier-protecting Bifidobacterium spp., the L/M ratio decreased significantly during our trial. Bacteria of the genus Bifidobacterium have been reported to protect gut barrier functions; an increase in this genus should reduce nonselective gut permeability and prevent antigen/toxin from the gut entering the host circulatory system (Griffiths et al., 2004). However, a very weak positive correlation (r < 0.20) between Bifidobacterium and pro-inflammatory cytokine IL-1β was observed. Similar phenomenon is also reported in previous work, and we need further study to resolve the conflict (Santacruz et al., 2009; Furet et al., 2010). On the other hand, the abundance of lipopolysaccharide-producing bacteria Escherichia/Shigella, Klebsiella, and Citrobacter, in the family Enterobacteriaceae, was significantly reduced. We also found a decrease in the abundance of sulfate-reducing bacteria of the family Desulfovibrionaceae, another potentially important group of endotoxin producers. Lipopolysaccharide produced by bacteria in these two families has potent inflammation-inducing capacity, usually 100- to 1000-fold higher than lipopolysaccharide from Bacteroides spp. (Lindberg et al., 1990; Hakansson & Molin, 2011). Taken together, the increase in gut barrier-protecting bacteria and decrease in opportunistic lipopolysaccharide-producing pathogens should eventually lead to reduction in antigen load to the host, which may help alleviate inflammation (Van der Waaij, 1989).
The low concentration of lipopolysaccharide in obese patients, short half-life, and high susceptibility to interfering substances (Novitsky, 1998) limits the utility of current lipopolysaccharide detection methods. Its binding protein, LBP, which initiates recognition and amplifies the host immune responses to lipopolysaccharide, reflects the amount of effective lipopolysaccharide and is regarded as an endotoxemia marker (Heumann, 2001; Lepper et al., 2007). Sun et al. (2010) found that elevated circulating LBP was associated with obesity, metabolic syndrome, and type 2 diabetes in apparently healthy Chinese. LBP decreased in our cohort during the intervention period and relapsed at the end of Phase II, which was probably due to the return to a high-fat/energy diet of some volunteers.
At the end of the causal pathway, β-cell function and insulin sensitivity were ameliorated continuously during the entire study. In particular, HOMA insulin sensitivity increased markedly after the intervention (from 64% to 83.05%, 1.94% per week during the intervention period). This measurement was reported to decrease linearly by 1.11% per year during the 13-year monitoring in nondiabetics from a prospective occupational cohort study of 6538 British civil servants (Tabák et al., 2009). The overall resolution of metabolic syndrome with our dietary intervention was 29.21% in Phase I and 31.46% in Phase II, which was slightly higher than the lifestyle intervention (25%) via Mediterranean-style or DASH diets (Giugliano et al., 2008).
Admittedly, the self-controlled nature of this study does not allow to infer that all described effects are due to manipulation of gut microbiota. Part of the altered measures associated with metabolic syndrome might indeed come from body weight reduction (Goldstein, 1992), direct effect of micronutrients, and/or phytochemicals from the diet component (Thurnham et al., 2005; Leiherer et al., 2012), rather than via changed gut microbiota. Inclusion of parameters along the ‘chain of causation’ between lipopolysaccharide producers in gut microbiota and disease end points, such as detailed compositional analysis of gut microbiota, intestinal permeability test, monitoring of LBP, inflammation and insulin sensitivity, showed that the improvement in the disease end points was at least partially due to the altered gut microbiota. To further demonstrate that the altered gut microbiota after the intervention had a more balanced structure which may benefit the hosts, we measured the concentration of short-chain fatty acids (Table S3), the cytotoxicity (Fig. S4), and genotoxicity (Fig. S5) of the fecal water samples at baseline, 9 and 23 weeks after the intervention. The results confirmed that the gut microbiota after the intervention became significantly less detrimental and more protective to the hosts, which supports that the changed gut microbiota may benefit the health of the hosts.
Conclusion
Reduced endotoxin-producing bacteria and increased gut barrier-protecting bacteria in the gut improved gut barrier function, reduced serum endotoxin load, and alleviated low-grade inflammation can explain why our dietary intervention improved insulin sensitivity and metabolic profiles of the cohort tested. These changes along a putative chain of causation between gut microbiota and host metabolic diseases strengthen the connection between gut-derived endotoxin and the pathogenesis of obesity-associated disorders in humans. Targeting gut microbiota via dietary intervention for reducing endotoxin load and inflammation may become a promising method for managing obesity and related metabolic disorders.
Acknowledgments
We appreciate Junfeng Zheng and Xiaoping Zhu (Taiyuan Xinghualing Dunhua Square District Health Service Centre Board); Peisheng Xu and Tingting Chen (Shanxi Coal Centre Hospital); Zhenguo Mi and Yujian Song (Taiyuan Wanbailin Heping District Health Service Centre Board); Taiyuan Vice Mayor Zheng Zhang; Yuechun Wen (Taiyuan Health Bureau), and Shixin Fan (Taiyuan Lipu Science and Trade Co., Ltd) for suggestions and assistance. This work was supported by Project 30730005 of the National Nature Science Foundation of China (NSFC), 863 Projects 2008AA02Z315 and 2009AA02Z310, Key Projects 2007DFC30450 and 075407001 of International Cooperation Program Grants and Project in the National Science and Technology Pillar Program 2006BAI11B08.
Conflict of interest
The authors declare that they have no conflict of interest.
Supporting Information
Additional Supporting Information may be found in the online version of this article:
Data S1. Materials and methods.
Fig. S1. The change in percentage of initial body weight (%) during the intervention course.
Fig. S2. Alpha diversity analysis of the gut microbiota.
Fig. S3. The entire microbial communities between samples before and after the dietary intervention.
Fig. S4. Fecal water cytotoxicity of (A) the volunteers cohort (n = 89); (B) 26 subjects who had fecal water cytotoxicity before the intervention (cell viability < 92.06 ± 3.03%, namely lower than the PBS negative control).
Fig. S5. Time course of genotoxicity of (A) fecal water of 10 volunteers, which were randomly selected from the cohort (n = 89). Each point represents the OTM value from each fecal water sample and the horizontal lines indicate the mean values of each group; (B) Comet images of two representative samples at different intervention time, the genotoxicity values of which indicated on A. The cut-off points were set to evaluate genotoxic potency of fecal water samples (Klinder et al., 2007). Statistical significance test was performed by paired sample t-test.
Table S1. The number and the percentage of volunteers with single components beyond the cutoff for metabolic syndrome from the International Diabetes Federation.
Table S2. Correlation between clinical parameters and gut microbiota before and after dietary intervention.
Table S3. Comparison of short-chain fatty acid level in fecal water samples from volunteers during the dietary intervention
References
- Alvarez JA, Higgins PB, Oster RA, Fernandez JR, Darnell BE, Gower BA. Fasting and postprandial markers of inflammation in lean and overweight children. Am J Clin Nutr. 2009;89:1138–1144. doi: 10.3945/ajcn.2008.26926. [DOI] [PMC free article] [PubMed] [Google Scholar]
- Bulló M, Casas-Agustench P, Amigó-Correig P, Aranceta J, Salas-Salvadó J. Inflammation, obesity and comorbidities: the role of diet. Public Health Nutr. 2007;10:1164–1172. doi: 10.1017/S1368980007000663. [DOI] [PubMed] [Google Scholar]
- Cani PD, Amar J, Iglesias MA, et al. Metabolic endotoxemia initiates obesity and insulin resistance. Diabetes. 2007;56:1761–1772. doi: 10.2337/db06-1491. [DOI] [PubMed] [Google Scholar]
- Cani PD, Bibiloni R, Knauf C, Waget A, Neyrinck AM, Delzenne NM, Burcelin R. Changes in gut microbiota control metabolic endotoxemia-induced inflammation in high-fat diet-induced obesity and diabetes in mice. Diabetes. 2008;57:1470–1481. doi: 10.2337/db07-1403. [DOI] [PubMed] [Google Scholar]
- Dandona P, Weinstock R, Thusu K, Abdel-Rahman E, Aljada A, Wadden T. Tumor necrosis factor-α in sera of obese patients: fall with weight loss. J Clin Endocr Metab. 1998;83:2907–2910. doi: 10.1210/jcem.83.8.5026. [DOI] [PubMed] [Google Scholar]
- Diamant M, Blaak EE, de Vos WM. Do nutrient-gut-microbiota interactions play a role in human obesity, insulin resistance and type 2 diabetes? Obes Rev. 2011;12:272–281. doi: 10.1111/j.1467-789X.2010.00797.x. [DOI] [PubMed] [Google Scholar]
- Dietrich M, Jialal I. The effect of weight loss on a stable biomarker of inflammation, C-reactive protein. Nutr Rev. 2005;63:22–28. doi: 10.1111/j.1753-4887.2005.tb00107.x. [DOI] [PubMed] [Google Scholar]
- Duncan SH, Lobley GE, Holtrop G, Ince J, Johnstone AM, Louis P, Flint HJ. Human colonic microbiota associated with diet, obesity and weight loss. Int J Obes. 2008;32:1720–1724. doi: 10.1038/ijo.2008.155. [DOI] [PubMed] [Google Scholar]
- Fei N, Zhao L. An opportunistic pathogen isolated from the gut of an obese human causes obesity in germfree mice. ISME J. 2013;7:880–884. doi: 10.1038/ismej.2012.153. [DOI] [PMC free article] [PubMed] [Google Scholar]
- Furet J-P, Kong L-C, Tap J, Poitou C, Basdevant A, Bouillot J-L, Mariat D, Corthier G, Doré J, Henegar C. Differential adaptation of human gut microbiota to bariatric surgery-induced weight loss links with metabolic and low-grade inflammation markers. Diabetes. 2010;59:3049–3057. doi: 10.2337/db10-0253. [DOI] [PMC free article] [PubMed] [Google Scholar]
- Giugliano D, Ceriello A, Esposito K. Are there specific treatments for the metabolic syndrome? Am J Clin Nutr. 2008;87:8–11. doi: 10.1093/ajcn/87.1.8. [DOI] [PubMed] [Google Scholar]
- Goldstein DJ. Beneficial health effects of modest weight loss. Int J Obes Relat Metab Disord. 1992;16:397–415. [PubMed] [Google Scholar]
- Griffiths EA, Duffy LC, Schanbacher FL, Qiao H, Dryja D, Leavens A, Rossman J, Rich G, Dirienzo D, Ogra PL. In vivo effects of bifidobacteria and lactoferrin on gut endotoxin concentration and mucosal immunity in Balb/c mice. Dig Dis Sci. 2004;49:579–589. doi: 10.1023/b:ddas.0000026302.92898.ae. [DOI] [PubMed] [Google Scholar]
- Guerra RA, Casafont F, Crespo J, Cayón A, Mayorga M, Estebanez A, Fernadez-Escalante JC, Pons-Romero F. Lipopolysaccharide-binding protein plasma levels and liver TNF-alpha gene expression in obese patients: evidence for the potential role of endotoxin in the pathogenesis of non-alcoholic steatohepatitis. Obes Surg. 2007;17:1374–1380. doi: 10.1007/s11695-007-9243-7. [DOI] [PubMed] [Google Scholar]
- Hakansson A, Molin G. Gut microbiota and inflammation. Nutrients. 2011;3:637–682. doi: 10.3390/nu3060637. [DOI] [PMC free article] [PubMed] [Google Scholar]
- Heilbronn LK, Noakes M, Clifton PM. Energy restriction and weight loss on very-low-fat diets reduce C-reactive protein concentrations in obese, healthy women. Arterioscl Throm Vas. 2001;21:968–970. doi: 10.1161/01.atv.21.6.968. [DOI] [PubMed] [Google Scholar]
- Heumann D. CD14 and LBP in endotoxemia and infections caused by Gram-negative bacteria. J Endotoxin Res. 2001;7:439–441. [PubMed] [Google Scholar]
- Huse SM, Huber JA, Morrison HG, Sogin ML, MarkWelch D. Accuracy and quality of massively parallel DNA pyrosequencing. Genome Biol. 2007;8:R143. doi: 10.1186/gb-2007-8-7-r143. [DOI] [PMC free article] [PubMed] [Google Scholar]
- James WPT. The epidemiology of obesity: the size of the problem. J Intern Med. 2008;263:336–352. doi: 10.1111/j.1365-2796.2008.01922.x. [DOI] [PubMed] [Google Scholar]
- Leiherer A, Mündlein A, Drexel H. Phytochemicals and their impact on adipose tissue inflammation and diabetes. Vascul Pharmacol. 2012;58:3–20. doi: 10.1016/j.vph.2012.09.002. [DOI] [PubMed] [Google Scholar]
- Lepper P, Schumann C, Triantafilou K, Rasche F, Schuster T, Frank H, Schneider E, Triantafilou M, von Eynatten M. Association of lipopolysaccharide-binding protein and coronary artery disease in men. J Am Coll Cardiol. 2007;50:25–31. doi: 10.1016/j.jacc.2007.02.070. [DOI] [PubMed] [Google Scholar]
- Ley RE, Turnbaugh PJ, Klein S, Gordon JI. Microbial ecology: human gut microbes associated with obesity. Nature. 2006;444:1022–1023. doi: 10.1038/4441022a. [DOI] [PubMed] [Google Scholar]
- Lindberg AA, Weintraub A, Zähringer U, Rietschel ET. Structure–activity relationships in lipopolysaccharides of Bacteroides fragilis. Rev Infect Dis. 1990;12:S133–S141. doi: 10.1093/clinids/12.supplement_2.s133. [DOI] [PubMed] [Google Scholar]
- Ludwig W, Strunk O, Westram R, et al. ARB: a software environment for sequence data. Nucleic Acids Res. 2004;32:1363–1371. doi: 10.1093/nar/gkh293. [DOI] [PMC free article] [PubMed] [Google Scholar]
- Moreno-Navarrete J, Ortega F, Serino M, Luche E, Waget A, Pardo G, Salvador J, Ricart W, Frühbeck G, Burcelin R. Circulating lipopolysaccharide-binding protein (LBP) as a marker of obesity-related insulin resistance. Int J Obes. 2011;36:1442–1449. doi: 10.1038/ijo.2011.256. [DOI] [PubMed] [Google Scholar]
- Musso G, Gambino R, Cassader M. Obesity, diabetes, and gut microbiota. Diabetes Care. 2010;33:2277–2284. doi: 10.2337/dc10-0556. [DOI] [PMC free article] [PubMed] [Google Scholar]
- Musso G, Gambino R, Cassader M. Interactions between gut microbiota and host metabolism predisposing to obesity and diabetes. Annu Rev Med. 2011;62:361–380. doi: 10.1146/annurev-med-012510-175505. [DOI] [PubMed] [Google Scholar]
- Novitsky T. Limitations of the Limulus amebocyte lysate test in demonstrating circulating lipopolysaccharides. Ann NY Acad Sci. 1998;851:416–421. doi: 10.1111/j.1749-6632.1998.tb09018.x. [DOI] [PubMed] [Google Scholar]
- Parnell JA, Reimer RA. Weight loss during oligofructose supplementation is associated with decreased ghrelin and increased peptide YY in overweight and obese adults. Am J Clin Nutr. 2009;89:1751–1759. doi: 10.3945/ajcn.2009.27465. [DOI] [PMC free article] [PubMed] [Google Scholar]
- Santacruz A, Marcos A, Wärnberg J, et al. Interplay between weight loss and gut microbiota composition in overweight adolescents. Obesity. 2009;17:1906–1915. doi: 10.1038/oby.2009.112. [DOI] [PubMed] [Google Scholar]
- Schloss PD, Handelsman J. Introducing DOTUR, a computer program for defining operational taxonomic units and estimating species richness. Appl Environ Microbiol. 2005;71:1501–1506. doi: 10.1128/AEM.71.3.1501-1506.2005. [DOI] [PMC free article] [PubMed] [Google Scholar]
- Shoelson SE, Herrero L, Naaz A. Obesity, inflammation, and insulin resistance. Gastroenterology. 2007;132:2169–2180. doi: 10.1053/j.gastro.2007.03.059. [DOI] [PubMed] [Google Scholar]
- Sun L, Yu Z, Ye X, et al. A marker of endotoxemia is associated with obesity and related metabolic disorders in apparently healthy Chinese. Diabetes Care. 2010;33:1925–1932. doi: 10.2337/dc10-0340. [DOI] [PMC free article] [PubMed] [Google Scholar]
- Tabák AG, Jokela M, Akbaraly TN, Brunner EJ, Kivim Ki M, Witte DR. Trajectories of glycaemia, insulin sensitivity, and insulin secretion before diagnosis of type 2 diabetes: an analysis from the Whitehall II study. Lancet. 2009;373:2215–2221. doi: 10.1016/S0140-6736(09)60619-X. [DOI] [PMC free article] [PubMed] [Google Scholar]
- Thurnham DI, Mburu AS, Mwaniki DL, Wagt AD. Micronutrients in childhood and the influence of subclinical inflammation. Proc Nutr Soc. 2005;64:502–509. doi: 10.1079/pns2005468. [DOI] [PubMed] [Google Scholar]
- Van der Waaij D. The ecology of the human intestine and its consequences for overgrowth by pathogens such as Clostridium difficile. Annu Rev Microbiol. 1989;43:69–87. doi: 10.1146/annurev.mi.43.100189.000441. [DOI] [PubMed] [Google Scholar]
- Wallace TM, Levy JC, Matthews DR. Use and abuse of HOMA modeling. Diabetes Care. 2004;27:1487–1495. doi: 10.2337/diacare.27.6.1487. [DOI] [PubMed] [Google Scholar]
- Wellen KE, Hotamisligil GS. Inflammation, stress, and diabetes. J Clin Invest. 2005;115:1111–1119. doi: 10.1172/JCI25102. [DOI] [PMC free article] [PubMed] [Google Scholar]
- Zhang C, Zhang M, Wang S, et al. Interactions between gut microbiota, host genetics and diet relevant to development of metabolic syndromes in mice. ISME J. 2010;4:232–241. doi: 10.1038/ismej.2009.112. [DOI] [PubMed] [Google Scholar]
- Zhang C, Zhang M, Pang X, Zhao Y, Wang L, Zhao L. Structural resilience of the gut microbiota in adult mice under high-fat dietary perturbations. ISME J. 2012;6:1848–1857. doi: 10.1038/ismej.2012.27. [DOI] [PMC free article] [PubMed] [Google Scholar]
- Zhao L. The gut microbiota and obesity: from correlation to causality. Nat Rev Microbiol. 2013;11:639–647. doi: 10.1038/nrmicro3089. [DOI] [PubMed] [Google Scholar]
Associated Data
This section collects any data citations, data availability statements, or supplementary materials included in this article.
Supplementary Materials
Data S1. Materials and methods.
Fig. S1. The change in percentage of initial body weight (%) during the intervention course.
Fig. S2. Alpha diversity analysis of the gut microbiota.
Fig. S3. The entire microbial communities between samples before and after the dietary intervention.
Fig. S4. Fecal water cytotoxicity of (A) the volunteers cohort (n = 89); (B) 26 subjects who had fecal water cytotoxicity before the intervention (cell viability < 92.06 ± 3.03%, namely lower than the PBS negative control).
Fig. S5. Time course of genotoxicity of (A) fecal water of 10 volunteers, which were randomly selected from the cohort (n = 89). Each point represents the OTM value from each fecal water sample and the horizontal lines indicate the mean values of each group; (B) Comet images of two representative samples at different intervention time, the genotoxicity values of which indicated on A. The cut-off points were set to evaluate genotoxic potency of fecal water samples (Klinder et al., 2007). Statistical significance test was performed by paired sample t-test.
Table S1. The number and the percentage of volunteers with single components beyond the cutoff for metabolic syndrome from the International Diabetes Federation.
Table S2. Correlation between clinical parameters and gut microbiota before and after dietary intervention.
Table S3. Comparison of short-chain fatty acid level in fecal water samples from volunteers during the dietary intervention