

Abstract
Metagenomic methods provide a powerful means to investigate complex ecological phenomena. Developed originally for study of Bacteria and Archaea, the application of these methods to eukaryotic microorganisms is yet to be fully realized. Most prior environmental molecular studies of eukaryotes have relied heavily on PCR amplification with eukaryote-specific primers. Here we apply high throughput short-read sequencing of poly-A selected RNA to capture the metatranscriptome of an estuarine dinoflagellate bloom. To validate the metatranscriptome assembly process we simulated metatranscriptomic datasets using short-read sequencing data from clonal cultures of four algae of varying phylogenetic distance. We find that the proportion of chimeric transcripts reconstructed from community transcriptome sequencing is low, suggesting that metatranscriptomic sequencing can be used to accurately reconstruct the transcripts expressed by bloom-forming communities of eukaryotes. To further validate the bloom metatransciptome assembly we compared it to a transcriptomic assembly from a cultured, clonal isolate of the dominant bloom-causing alga and found that the two assemblies are highly similar. Eukaryote-wide phylogenetic analyses reveal the taxonomic composition of the bloom community, which is comprised of several dinoflagellates, ciliates, animals, and fungi. The assembled metatranscriptome reveals the functional genomic composition of a metabolically active community. Highlighting the potential power of these methods, we found that relative transcript abundance patterns suggest that the dominant dinoflagellate might be expressing toxin biosynthesis related genes at a higher level in the presence of competitors, predators and prey compared to it growing in monoculture.
Keywords: De novo assembly, Dinoflagellate, Flow cytometry, Harmful algal bloom, Metagenomics, Metatranscriptomics, Prorocentrum minimum, Transcriptomics
1. Introduction
Communities of microscopic organisms are ubiquitous and perform an enormous range of ecologically important functions. The organisms present within a community contribute to ecological function by their individual metabolic capabilities and through interacting metabolic networks. Great examples are marine systems, where autotrophs make a significant contribution to global carbon cycling. In contrast to any positive impact they might have on atmospheric carbon, periodic blooms of dinoflagellates can have devastating ecological and economic consequences through toxin production and localized oxygen depletion (Morey et al., 2011). The processes of bloom initiation, maintenance and termination are poorly understood (Cloern et al., 2005; Anderson and Rengefors, 2006; Adolf et al., 2008; Hense, 2010). Among the contributing parameters are community interactions and resource fluxes. Response to environmental variables and interacting partners is encoded in, and controlled by, the genome. The burgeoning field of metagenomics allows the composition and function of microscopic communities to be characterized and described as a whole, without the need to isolate and characterize the individual players and to experimentally reconstruct their networks of interactions.
Although the metagenomic study of Bacteria and Archaea over the last 20 years has revealed the tremendous power of such approaches for microbial ecology, comparable studies of eukaryotes have been relatively slow to emerge (Lin et al., 2010). Application of metagenomic techniques to eukaryotes has generally focused on the discovery of taxonomic diversity through rDNA surveys of diverse communities. These efforts have demonstrated that metagenomic studies will be valuable for eukaryotic microorganisms by revealing an extraordinary array of previously unknown eukaryotic lineages whose ecological roles remain obscure (Lopez-Garcia et al., 2001; Moon-van der Staay et al., 2001; Baldauf, 2003; Stoeck et al., 2006). Efforts to apply genome scale sequence surveys to eukaryotic communities have been limited. Eukaryotic genomes are typically far larger than those of prokaryotes and require significantly more sequencing depth to facilitate successful assembly of their genomes. Even single organism genome sequencing remains out of reach for many lineages. Dinoflagellates, a major group of marine eukaryotes, have extremely large and unusual genomes whose content and function remain largely unknown, and whose transcriptional and translational regulation fail to obey standard patterns (Wisecaver and Hackett, 2011). Most dinoflagellate genomes are thought to be too large and too repetitive to be accessible for sequencing at reasonable cost with current technology (Shoguchi et al., 2013). For organisms known only from environmental sampling of ribosomal RNA encoding sequences, we have no basis for evaluating the size and complexity of their genomes. Consequently, environmental genome sequencing of eukaryotic communities remains out of reach.
In contrast, transcriptome sequencing provides access to a wealth of genomic information from substantially less sequence data. Single-organism shotgun transcriptome sequencing has already been highly informative for resolving phylogenetic relationships deep in the tree of life (e.g., Dunn et al., 2008; Oakley et al., 2012; Timme et al., 2012; Kvist and Siddall, 2013) and is starting to reveal the origins of genomic features which have enabled major evolutionary transitions like the conquest of land by plants (Timme and Delwiche, 2010; Viaene et al., 2013). The potential value of environmental sequencing of eukaryote transcriptomes can be seen in the study of eukaryotic soil communities, focused on fungi and other microbes (Damon et al., 2012). Applications in marine systems include automated remote sampling of mixed microbial communities (Ottensen et al., 2013) and the transcriptional response of diatoms to iron availability (Marchetti et al., 2012).
For environmental transcriptome sequencing to be successful sufficient sequencing depth is required to sample the vast majority of transcripts present and to accurately describe the functional and taxonomic composition of the sample. Of currently available sequencing technologies, Illumina (Bentley et al., 2008) provides the greatest amount of data for equivalent cost (Glenn, 2011). However, Illumina sequencing favors data quantity over read length and therefore each transcript must be inferred by assembly of contiguous sequences (contigs) from multiple independent reads. A major concern in metagenomics and metatranscriptomics is the potential assembly of chimeric contigs by merging transcripts from multiple species due to regions of high sequence identity (e.g., Howe et al., 2014). In order to evaluate this potential source of error we simulated metatranscriptomic datasets for simple algal communities in silico. Because closely related organisms are likely to share more regions of high sequence identity, we hypothesized that phylogenetic distance will have a significant effect on the amount of chimerism in metatranscriptomic assemblies. We set out to test this hypothesis using simulated datasets comprised of two species of varying phylogenetic distance. We then applied Illumina short read sequencing and de novo transcriptome assembly to evaluate the feasibility of characterizing the taxonomic and functional composition of an environmental sample from a major dinoflagellate bloom. We validate the environmental data using a clonal culture of the dominant organism obtained from the bloom. Using this combination of in silico metatranscriptome simulations and applied environmental sequencing, we demonstrate that it is feasible to accurately assemble the transcripts expressed by a community of bloom-forming eukaryotes and to achieve informative taxonomic and functional annotation of these transcripts. The approach demonstrated here can be applied through the time course of an algal bloom and has the potential to yield important insights into the dynamic nature of species interactions during harmful algal blooms.
2. Materials and methods
2.1. Sample collection, culture isolation and RNA extraction and sequencing
The composition of the sample was analyzed using a custom built CytoSense portable flow cytometer (Cytobuoy b.v., Woerden, Netherlands). Undiluted sample was pumped through the flow cuvette at a rate of approximately 0.8 μl s−1 for 300's. After the initial run, repeat runs were performed under identical flow rate and triggering conditions, using a combination of length of signal and maximum red fluorescence to photograph 50 particles from each of the main clusters. Additionally, video and still images were captured using a Canon EOS 5D Mark II camera mounted on a Zeiss Axioscop using either a 10× Fluor or 40× plan-NeoFluor objective. Total RNA was extracted from a 50 ml subsample of the bloom within hours of collection, using Ambion RNAqueous extraction kit (Life Technologies) following the manufacturers protocol. Single cells of the dominant algal species were isolated with a sterile micropipette, washed by five serial transfers through sterile growth medium, and grown in L1-15ppt culture medium. Cultures were grown at 18 °C under cool white fluorescent illumination, 15 h day length, until a dense clonal culture was observed. One clonal culture was selected for transcriptome sequencing. Total RNA was extracted using Nucleospin RNA Plant extraction kit (Machery-Nagel) following the manufacturers protocol. Library preparation and sequencing were carried out by the University of Maryland's Institute for Bioscience and Biotechnology Research DNA Sequencing Facility (http://www.ibbr.umd.edu/facilities/sequencing). Poly-adenylated RNA was isolated and cDNA libraries prepared using the standard TruSeq protocol (Illumina). Indexing adapters were used and each sample was multiplexed with three other libraries on a single lane of an Illumina HiSeq1000 sequencer. On average 45 million paired-end, 101 base reads were produced for each library (Table 1).
Table 1.
Comparative statistics for the environmental and clonal isolate datasets.
| Environmental | Clonal | |
|---|---|---|
| Raw reads (millions of pairs) | 42.2 | 48.9 |
| Trimmed reads – paired (millions of pairs) | 28.4 | 41.2 |
| Trimmed reads – singletons (millions) | 3.7 | 3.8 |
| Number of contigs | 172,700 | 167,207 |
| Number of components | 128,806 | 113,967 |
| Contig length range (min–max) | 201–18,679 | 201–10,772 |
| Mean contig length | 750 | 816 |
| Median contig length | 469 | 543 |
| NCBI TSA accession number | GBFZ00000000 | GBFP00000000 |
| Number of unique components | 24,749 | 10,414 |
| Number of shared components | 104,058 | 103,554 |
2.2. Transcript assembly from an environmental sample and comparison to a clonal isolate
2.2.1. Comparison of the read sets and assembly statistics
FastQC version 0.10.1 (http://www.bioinformatics.bbsrc.ac.uk/projects/fastqc) was used for initial characterization of raw read sets. Reads that did not pass the Illumina chastity filter were discarded. Truseq adapter sequences were removed using Tag-Cleaner version 0.12 (Schmieder et al., 2010) allowing up to 17 mismatches in order to account for partial tags and sequencing error. Reads were trimmed to remove all poor quality bases (phred score <20) using a python script (https://github.com/bastodian/shed/blob/master/Python/q-trim.py). Reads shorter than 25 bases after trimming were discarded. The trimmed read sets were sorted to maintain paired end information, using the cluster coordinates in the FASTQ header. Reads whose pair had been discarded were retained as unpaired reads for assembly and mapping.
In order to estimate the diversity of the transcriptome and the extent to which the sequencing depth was sufficient to capture it, we calculated sequence diversity saturation curves. First we randomly drew read pairs from the quality controlled read sets, to make subsets of 1%3Fndash;28 million reads at 1 million read increments using a python script (https://github.com/bastodian/shed/blob/master/Python/randSeq.py). We then counted distinct subsequences of 25 bases in length (25-mers) using Jellyfish Version 1.1.6 (Marcais and Kingsford, 2011) and plotted the number of 25-mers against the number of reads. We chose subsequences of 25 bases because this is the length of the subsequences used by the assembly algorithm (see below) to build the initial assembly graph. More generally, short subsequences are referred to as k-mers where k represents the subsequence length.
Reads were assembled using Trinity release 2012-06-08 (Grabherr et al., 2011) with all parameters set to default values with the exception of minimum k-mer coverage, which, in order to decrease the probability of assembling chimeric contigs, was set to two. Because a proportion of reads are misassigned during demultiplexing (Kircher et al., 2012) we performed a high identity blast search (BLASTN, >95% identity) using as queries assembled contigs from the green algal samples run simultaneously with the metatranscriptomic and clonal isolate libraries, and removed those assembled contigs identified as likely contaminants (full pipeline described in supplementary data).
2.2.2. Comparison of transcript content between the environmental sample and clonal isolate
In order to compare the sequence content of the two transcriptomic assemblies we used reciprocal BLASTN (Camacho et al., 2009) to search for contigs with >95% sequence identity present in both datasets. A maximum e-value cut-off of 1 × 10−40 was enforced to ensure that shared sequences had high identity over a significant aligned length. This value was determined from the data by plotting the logarithm of the e-value against the alignment length (see supplementary figure 1). As an alternative approach to identify sequences present in one but not both datasets we mapped each read set against both assemblies using Bowtie using default settings (Langmead et al., 2009). In order to quantify transcript abundance we calculated the number of fragments mapped per kilobase of transcript per million mapped reads (FPKM) using the RSEM (Li and Dewey, 2011) script distributed with the Trinity package.
2.2.3. Phylogenetic analysis of the environmental sample
In order to place the bloom forming organisms within a phylogenetic context we obtained a recent eukaryote-wide dataset of mitochondrial proteins (Derelle and Lang, 2012). Using these sequences as queries we retrieved high quality matches (TBLASTN; best hit with e-value <1 × 10⁻¹⁰; Camacho et al., 2009) from the assembled transcriptome of the clonal isolate. For each gene we added the sequence identified from the transcriptome to the alignment and performed maximum likelihood (ML) phylogenetic analyses with RAxML (-m PROTGAMMAWAG; Stamatakis, 2006) to verify homology. Those sequences placed outside the eukaryote clade were discarded. We then concatenated all alignments that contained a sequence of the clonal isolate and re-ran the ML analysis. Because the ML analysis supported placement of the clonal isolate of the major bloom-forming organism within the alveolates we obtained single gene alignments from a recent study on alveolate phylogeny using ribosomal proteins (Bachvaroff et al., 2014). We used Perkinsus marinus (Mackin, Owen and Collier) Levine sequences to query the transcriptome of the clonal isolate because P. marinus was the closest taxon in the mitochondrial protein tree. Furthermore, P. marinus was represented by sequences for every gene in the ribosomal protein data matrix (Bachvaroff et al., 2014). Gene-by-gene analyses were performed as described above to exclude sequences outside the alveolates. We then concatenated all alignments and performed ML analysis with RAxML as described above.
To determine the phylogenetic composition of the environmental sample we followed the same protocol as for the clonal isolate with the modification that all significant hits (TBLASTN; e-value <1 × 10⁻¹⁰; Camacho et al., 2009) were retained. Each gene was analyzed separately because there was no information linking genes to their organismal origin, and because multiple homologous sequences were present in the environmental sample. In order to maintain maximum information for the backbone phylogeny, we analyzed the entire concatenated matrix without removing loci that contained missing data.
2.2.4. Functional composition of the bloom and clonal isolate transcriptomes
Domain based annotations were obtained using the hmmsearch utility of HMMER version 3.0 (http://hmmer.org/) in conjunction with the pfam-A database (Punta et al., 2012). First, pfam domain IDs were annotated to genes using the gathering threshold cutoffs incorporated in the pfam set of hidden markov models. Then we used the pfam2go mapping (Hunter et al., 2008) to assign gene ontology (GO) IDs to genes based on the pfam domain annotations. Gene ontology annotations were imported into Blast2GO (Conesa et al., 2005) and GO graph summaries prepared for the three GO categories at annotation level 3. Enrichment analysis was performed using Fisher's exact test implemented in Blast2GO.
2.3. Simulation of algal bloom metatranscriptomes
2.3.1. Composition of the sequence data sets
Four single-organism transcriptomic readsets were used to evaluate the effects of phylogenetic distance on metatranscriptome assembly: Prorocentrum minimum (the clonal isolate from the bloom as described above), Prorocentrum hoffmanianum, Mougeotia scalaris and Tetraselmis striata. The first two are dinoflagellates and the latter two are green algae (a charophyte and a chlorophyte respectively). Read libraries for P. hoffmanianum, M. scalaris and T. striata were generated for purposes beyond the scope of the present study. To avoid artifacts due to a low level of incorrect demultiplexing on the Illumina platform (Kircher et al., 2012) we selected only libraries that had not been run in the same lane as each other, the bloom sample, or the P. minimum clonal isolate. Metatranscriptomic read sets were simulated by combining reads from one of P. hoffmanianum, M. scalaris or T. striata, with reads from P. minimum in a fixed ratio such that the P. minimum readset contributed 90, 80, 70, 60 or 50% of the reads in the simulated metatranscriptome. Because assembly quality is influenced by the depth of sequencing we generated two series of simulated datasets. For one series the total size of the dataset was held constant, whilst for the other the number of reads contributed by P. minimum was held constant (Tables 2, S1 and S2). Where the P. minimum readset contributed 50% of the reads the two series were redundant so that only one dataset was analyzed. A total of 27 simulated metatranscriptomic readsets were generated.
Table 2.
Comparison of metatranscriptomic assemblies of Prorocentrum minimum and Prorocentrum hoffmanianum to the corresponding reference assemblies. Nine metatranscriptomic read sets were simulated in which P. minimum contributed 50–90% of the reads while the remainder were contributed by a second organism. Either the total number of reads was held constant (17 million read pairs) or the number of reads contributed by P. minimum was held constant (8.5 million pairs). Reference assemblies for evaluating simulated metatranscriptome assemblies were created by concatenation of transcriptome assemblies for the individual readsets of each individual species comprising each mixture. Contigs present in the metatranscriptome that are not found in the reference were identified by high identity blast searches and chimeric components are defined as those to which reads from both P. minimum and P. hoffmanianum were mapped.
| Read mixing experiments | |||||||||
|---|---|---|---|---|---|---|---|---|---|
| Proportion of reads from Prorocentrum minimum (%) | 90 | 90 | 80 | 80 | 70 | 70 | 60 | 60 | 50 |
| Total reads (million pairs) | 17 | 9.45 | 17 | 10.625 | 17 | 12.15 | 17 | 14.2 | 17 |
| Number of contigs – reference | 153,674 | 118,419 | 177,528 | 145,107 | 187,924 | 165,849 | 192,517 | 181,610 | 192,333 |
| Number of contigs – simulated metatranscriptome | 153,586 | 118,217 | 177,674 | 145,123 | 188,543 | 166,057 | 192,953 | 182,027 | 192,934 |
| Contigs in metatranscriptomic assembly not found in reference (%) | 0.662 | 0.686 | 0.761 | 0.806 | 0.843 | 0.811 | 0.857 | 0.882 | 0.948 |
| Potentially chimeric components (%) | 0.153 | 0.110 | 0.357 | 0.286 | 0.514 | 0.447 | 0.654 | 0.653 | 0.768 |
Because assembly problems may arise in cases where shared identical sequences are present we calculated the proportion of shared identical sequence. Specifically, we calculated the proportion of 25-mers shared between all pairs of monoculture readsets. For this purpose, we counted the total number of distinct 25-mers in each of the contributing readsets and the concatenated readset using Jellyfish Version 1.1.6 (Marcais and Kingsford, 2011). The difference between the sum of the distinct 25-mers in the contributing read sets and the number of distinct 25-mers in the concatenated read set is equal to the number of shared 25-mers.
2.3.2. Assembly of read sets
Reference assemblies were created for each simulated meta-transcriptome by separately assembling the readsets from each organism and then concatenating the two assemblies. This reference represents the expected assembly in the ideal case where assembly of the mixed readset perfectly separates the two transcriptomes. We then created a metatranscriptome assembly by pooling the readsets, as described above, prior to assembly. Assemblies were created using Trinity release 2012-06-08 (Grabherr et al., 2011) with parameters set to defaults with the exception of minimum k-mer coverage, which was set to two (see Section 2.2.1).
2.3.3. Assessment of assembly success
If the metatranscriptomic assemblies are free from artifacts introduced by the presence of short reads from distinct organisms then the metatranscriptomic assembly will be identical to the reference assembly. The assemblies produced by Trinity (Grabherr et al., 2011) are comprised of contiguous sequences (contigs) arranged in clusters of significantly overlapping sequences that represent alternative paths through the assembly graph. These clusters, known as connected components, are assumed to comprise putative splicing variants derived from a single gene (Grabherr et al., 2011). As a convenient shorthand we refer to these clusters of overlapping contigs as components. In our experience various other forms of assembly uncertainty lead to the presence of multi-contig components and overlapping identical sequences from distinct organisms in a metatranscriptomic sample are expected to generate more ambiguities in the assembly graph, and a larger number of multi-contig components. In comparing metatranscriptomic and reference assemblies we counted the number of contigs, the number of single-contig components, the number of multi-contig components, and the mean contig lengths. We counted the number of contigs present in the metatranscriptomic assemblies that were not present in the corresponding reference assemblies by performing high identity blast searches (BLASTN; e-value <1 × 10−40; Camacho et al., 2009). A major potential artifact of concern is the assembly of reads from distinct organisms into chimeric contigs. In order to evaluate the level of chimerism we mapped the individual readsets to the metatranscriptomic assembly using Bowtie (Langmead et al., 2009) via the RSEM (Li and Dewey, 2011) script distributed with Trinity and counted the number of components to which reads from both species datasets used for creating the simulated metatranscriptome were mapped.
3. Results
3.1. Characterization of a dinoflagellate bloom community using flow cytometry and light microscopy
On the 2nd of May 2012 during an early season algal bloom a water sample was collected from the Inner Harbor of Baltimore City, Maryland. The bloom sample consisted of a highly abundant prorocentroid dinoflagellate and a range of lower abundance eukaryotes (supplementary video 1). Based on morphology the prorocentroid dinoflagellate was tentatively identified as Prorocentrum minimum (Pavillard) Schiller. Flow cytometric analysis revealed that the sample consisted of approximately 50% small (<5 μm), unidentified particles with no observed autofluorescence. The remaining 50% of the particles were larger or had significant auto-fluorescence. Four main clusters were identified and photographed (Fig. 1). The densest cluster accounted for >90% of these particles and the image in flow photographs were consistent with the prorocentroid dinoflagellate observed with the light microscope.
Fig. 1.

Flow cytometric characterization of the environmental sample. Top panel: scatter plot of particles for parameters used to trigger image capture (forward scatter and red fluorescence). Below: pulse shapes and photographs of representative particles. Colored boxes link particles and clusters. The pulse shapes show the changing intensity of each signal as the particles pass through the laser beam: fine dotted line is the forward scatter, dashed line is the side scatter, and colored lines are fluorescence signals. The forward scatter signal saturated the detectors in B–I. Major clusters are: A and B, Prorocentrum minimum; C and D, Karlodinium veneficum amongst the larger particles in the black cluster; E, unknown ciliate with autofluorescent prey, also amongst the larger particles in the black cluster; F–H, Gyrodinium sp. with autofluorescent prey; I, Gymnodinium sp. without autofluorescent prey, amongst the larger black particles; J and K, unknown photoautotroph; L and M, small photoautotroph, consistent with Microcystis sp. a known Chesapeake Bay bloom former. The orange cluster adjacent to the red P. minimum cluster represents doublets of P. minimum simultaneously passing the detectors. (For interpretation of the references to color in this figure legend, the reader is referred to the web version of this article.)
3.2. Comparison of environmental and clonal isolate transcriptome assemblies
Two cDNA sequence libraries were generated, one from the bloom sample and one from a clonal isolate of the Prorocentrum minimum. From each quarter lane of Illumina HiSeq 1000 we obtained 42.2 and 48.9 million 101 base paired-end sequences (Table 1). After removing adapter sequence and bases with a phred score <20, 28.4 and 41.2 million paired reads plus 3.7 and 3.8 million singletons remained. The sequence diversity saturation curves show that, at equivalent sequencing depth, transcript diversity is more completely captured in the clonal isolate library (Fig. 2). Neither library represents an exhaustive sample of transcript diversity.
Fig. 2.

Sequence diversity saturation curves for the environmental transcriptomic dataset and the cultured clonal isolate dataset. The curve does not approach a horizontal line indicating that transcriptomic diversity has not been sampled exhaustively.
The assembled transcripts of both samples, available from the NCBI Transcriptome Shotgun Assembly database (Table 1), provide a substantial increase in publicly available genomic information for dinoflagellates. The assembled bloom sample had 172,700 contigs, derived from 128,806 components. Contig length ranged from 201 (default minimum length from Trinity) to 18,679 bases with mean contig length of 750, and median of 469. The clonal isolate library had 167,207 contigs from 113,967 components. Contig lengths ranged from 201 to 10,772 bases with mean length of 816 and median length of 543 bases. Using a reciprocal read mapping approach, 24,749 and 10,414 components from the environmental and clonal isolate assemblies respectively, were unique to each library. The environmental sample had 104,058 components to which reads from the clonal isolate mapped while the clonal isolate assembly had 103,554 components to which reads from the environmental sample mapped. High identity BLASTN searches confirmed that shared identical transcripts dominate the two libraries.
3.3. Validating the metatranscriptome assembly
Simulated metatranscriptome assemblies from mixed read sets were very similar to the reference assembly comprising the sum of transcripts assembled for each single organism read set from which the in silico metatranscriptome was compiled; this holds even for two congeneric dinoflagellates. The two-organism metatranscriptomes comprised nearly the same number of contigs, single contig components, and multi-contig components, as the sum of the individual assemblies when analyzed separately (Tables 2, S1–S3). Similarly, the contig lengths were highly comparable. High identity blast searches confirmed that the vast majority of sequences present in the metatranscriptomic assemblies were also present in the corresponding reference assembly. Very few components in the metatranscriptomic assembly had reads mapping from both contributing datasets consistent with a lack of chimeric contigs in the assembly. Shared 25-mer counts show that as the relative abundances of each organism, and the total size of the dataset increase, the proportion of shared 25-mers increases but is always less than 0.1%. The proportion of shared 25-mers and potentially chimeric contigs were highest when the two Prorocentrum readsets were combined but remained below 1% (Fig. 3).
Fig. 3.
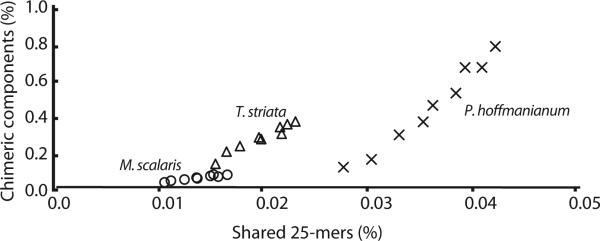
The proportion of shared 25-mers is a linear predictor of the potential for chimeric sequences in a metatranscriptomic assembly. Percentage of shared 25-mers and chimeric contigs reported in Tables S1–S3 were plotted for different abundances of the two species present in the simulated dataset; as the fraction of Prorocentrum minimum sequences decreases the amount of 25-mers shared between the two species increases. Hollow circles: Prorocentrum minimum plus Mougeotia scalaris; hollow triangles: Prorocentrum minimum plus Tetraselmis striata; crosses: Prorocentrum minimum plus Prorocentrum hoffmanianum.
3.4. Phylogenetic diversity of bloom
Phylogenetic analysis of two phylogenomic datasets with the addition of sequences from the clonal isolate of Prorocentrum minimum from the bloom, place this organism firmly within the alveolates and, more precisely, within a clade of prorocentroid dinoflagellates confirming the generic identification. Although poly-A selection was used to enrich for messenger RNA, sufficient ribosomal RNA remained for a complete assembly of the SSU-5.8S-LSU operon. Phylogenetic analysis of Prorocentrum rRNA sequences place the clonal isolate in a clade comprised of P. minimum (Pavillard) Schiller sequences thus confirming the morphological identification. Indeed, the P. minimum rRNA sequence from the clonal isolate is nearly identical – only 10 mismatches in 6136 bases –to a P. minimum sequence in genebank (JX402086). Using mapped reads to compare sequence diversity of the ribosomal RNA between the environmental sample and the clonal isolate indicated that the P. minimum in the bloom consists of a genetically uniform population, probably of clonal cells. A 346 base fragment corresponding to the Gyrodinium dominans rRNA (FN669510) was also found in the assembled data. Gene by gene placement of mitochondrial and ribosomal protein transcripts from the environmental sample in the context of eukaryote phylogeny highlights the presence of several phylogenetically diverse dinoflagellates, as well as ciliates, fungi and animals. For example, rpl4 genes from P. minimum and five other dinoflagellates, three basal alveolates, three ciliates and two stamenopiles were identified (Fig. 4). Although, limited reference data is available in public databases for most species we did find ribosomal protein sequences identical to Karlodinium veneficum (Ballantine) J.Larsen. (rps3a GU372980, rpl34 GU372981) indicating the presence of this toxin producer in the bloom.
Fig. 4.

Maximum likelihood tree from RAxML analysis of 75 ribosomal proteins. Sequence from the bloom metatranscriptome for one ribosomal protein, rpl4, are highlighted in bold type.
3.5. Functional and metabolic diversity of the bloom and potential toxin biosynthesis genes
Hidden Markov model based searches of the environmental and clonal isolate assemblies identified 22,479 (17.5%) and 18,451 (16.2%) genes respectively that contain domains homologous to Pfam-A domains. The most common domain annotations were protein kinases (PF00069), protein tyrosine kinases (PF07714) and pentatricopeptide repeats (PF01535 and PF13041). Gene ontology (GO) analyses of Pfam annotations show that the functional composition of the annotated sequences in the bloom and the clonal isolate are highly similar. Only 14 level-three GO terms are significantly enriched in either library (Table S4). These terms, all enriched in the environmental sample compared to the clonal isolate, are associated with core organismal functions. Two biological process terms describing organismal interactions are present only in the multi-organism environmental sample.
The environmental transcriptome provides insight into the metabolic activity of the bloom community. For example, it is rich in nutrient transporters such as ammonium (PF00909), sulphur (PF04143), sulphate (PF00916, PF13792), sodium/phosphate (PF02690) and bicarbonate (PF0955) transport domains. Trace element transporters such as magnesium (PF05653) and silicon (PF03842) transporter domains and various ion channels (PF00520, PF07885, PF08412) are present. Metabolic functions such as sulphatase (PF00884), nitrite/sulphite reductase (PF03460), ferric reductase (PF07194), and sulfotransferase (PF00685, PF03567, PF13469) were identified. In addition, we identified 138 genes containing potential toxin biosynthesis and/or fatty acid synthesis domains such as ketoacyl-synthase (PF00109, PF02801), ketoacyl-reductase (PF08659), phosphopantethein binding (PF00550), thioesterase (PF00975), condensation (PF00668) and acyl-transferase (PF00698). Using the abundance of mapped reads as a proxy for transcript abundance we found that several of these genes were more abundant in the environmental sample and a few were more abundant in the clonal isolate (Fig. 5).
Fig. 5.

Relative abundance of shared transcripts in the two transcriptome assemblies. Each point represents a transcript found in both datasets. The vertical axis indicates relative abundance of each transcript in the environmental assembly, whilst the horizontal axis shows relative abundance in the clonal isolate assembly. The diagonal line represents equal relative abundances. Genes containing putative toxin and/or fatty acid related domains are highlighted as white crosses.
4. Discussion
The low per-nucleotide sequencing costs offered by Illumina sequencing suggest increasing feasibility of metagenomics of eukaryotic microorganisms. However, the relatively short read length (100–300 nt), combined with the complexity and fallibility of assembly have made it uncertain how practical such approaches would be when applied to environmental sequencing of eukaryotes. Our complementary analyses of in silico simulated metatranscriptomes and an environmental sample from an algal bloom provide evidence that eukaryotic metatranscriptomic assembly from high throughput short read sequences can be used to obtain a high fidelity snapshot of community composition and transcription patterns during dynamic ecological processes such as harmful algal blooms.
Comparison of the environmental assembly and the clonal isolate showed a large number of identical contigs suggesting that the metatranscriptomic assembly was highly accurate. While the clonal Prorocentrum minimum dataset provides a comparator for the P. minimum transcripts in the environmental sample, no comparator was available for the minor transcript contributors. Simulation of metatranscriptomic read sets allowed us to explore the reliability of metatranscriptomic assembly under controlled conditions. Our analyses show that Trinity, a popular de Bruijn graph assembler, accurately assembles metatranscriptomic samples. As expected, the degree of shared identical sequence in the transcriptomes of organisms present in a metatranscriptomic sample is the best predictor of the risk of assembling chimeric contigs. Comparison of shared 25-mers between the datasets we used to simulate metatranscriptomes showed that the proportion of shared 25-mers is low and is influenced both by transcriptome size and phylogenetic distance (Fig. 3; Tables S1–S3). Chimeric contigs are rare as indicated by the small fraction (<0.8%) of contigs and components that had reads mapping from both reference read sets in any of the metatranscriptome assemblies. The metatranscriptomic assembly of P. minimum and Prorocentrum hoffmanianum comprises two organisms with less phylogenetic distance than any pair of organisms in the environmental sample. Even in the metatranscriptomic assemblies of these two Prorocentrum species, we observed few shared 25-mers. This observation adds confidence that our environmental metatranscriptomic assembly is largely free of chimeric contigs as well.
The greater the complexity of the community from which a metatranscriptomic sample is derived the more data will be required to capture sequence diversity. Neither our environmental nor our clonal Prorocentrum minimum libraries approach sequence saturation (Fig. 2), indicating that a portion of each transcriptome remains unsampled. Consequently, rare transcripts and low abundance organisms are likely to be absent from the dataset. Applications of metatranscriptomic methods to eukaryote communities will, therefore, require careful consideration of the tradeoff between the cost of sequencing and the sequencing depth necessary to recover rare transcripts and low abundance organisms.
Taxonomic characterization of a metagenomic dataset is nontrivial. In the ideal case every sequence captured could be annotated with the name of the taxon from which it was derived. Unfortunately, there are two primary impediments to achieving such complete taxonomic annotation. Firstly, the reference databases have highly non-uniform representation of biological diversity. Methods that apply a taxonomic annotation based on the origin of the most similar sequence in a reference database are therefore inappropriate for poorly represented lineages such as dinoflagellates. Secondly, horizontal gene transfer can be an important contributor to genomic diversity. Horizontally transferred genes have the potential to yield erroneous taxonomic annotations that reflect the donor organism's taxonomic identity. The approach taken here aims to avoid these problems by focusing on a narrow set of core genes of known function – mitochondrial proteins (Derelle and Lang, 2012), ribosomal proteins (Bachvaroff et al., 2014) and the SSU-5.8S-LSU ribosmal RNA operon – which are thought to be rarely transferred. We used an explicitly phylogenetic approach to assign organisms to eukaryote lineages that enabled comprehensive taxonomic annotation of the dinoflagellate bloom. A diverse community of dinoflagellates during a spring bloom, as observed by us, is consistent with long term community patterns in the Chesapeake Bay (Harding, 1994; Harding and Perry, 1997; Adolf et al., 2006). In particular, gene-by-gene analysis of ribosomal proteins revealed the presence of Prorocentrum minimum and Karlodinium venificum, both regular formers of harmful algal blooms in the region (Tango et al., 2005; Adolf et al., 2008).
A major advance of the metatranscriptomic approach is that the same dataset that was used to characterize the taxonomic composition of the bloom also provides a functional characterization of the active genes in the community. The functional composition of the bloom metatranscriptome is highly similar to the transcriptome of the clonal isolate of the dominant bloom-forming organism, Prorocentrum minimum, which contributed approximately 90% of the eukaryotic organisms present and therefore the bulk of mRNA in the sequenced sample. At the level of mRNA presence and absence, these data suggest limited transcriptome re-modeling in P. minimum. This possibly reflects the highly duplicated nature of dinoflagellate genomes (Bachvaroff and Place, 2008; Beauchemin et al., 2012) and unusual transcriptional behavior (Morey and Van Dolah, 2013). The small number of gene ontology annotations that were significantly enriched in the environmental sample corresponds to core eukaryotic ontologies, such as ‘ribosomal component’ which had more than twice as many annotations in the environmental sample. Their enrichment in the environmental sample indicates the presence of multiple eukaryotes and the conservation of genes involved in translation.
Toxins produced by dinoflagellates during blooms have devastating ecological and economic effects yet the role of toxin production in dinoflagellate ecology remains poorly known. Hotly debated is the possibility that toxicity of dinoflagellate metabolic products is incidental to their physiological role (Errera and Campbell, 2011, 2013; Sunda et al., 2013a,b). Prorocentrum minimum, the primary bloom causing dinoflagellate identified in the present study, is a putative toxin producer (Grzebyk et al., 1997) and has been associated with human shellfish poisoning and other ecological effects (Heil et al., 2005; Tango et al., 2005). Toxicity in Prorocentrum species has been attributed to okadaic acid, structurally similar to dinophysistoxins (Kellman et al., 2010). However, there is no evidence of okadaic acid production in P. minimum. These linear polyethers are likely produced by hybrid non-ribosomal peptide synthases (NRPS) and polyketide synthases (PKS) (Kellman et al., 2010). A range of possible NRPS/PKS domains were identified in both the environmental transcriptome and the clonal isolate. However, NRPS are also implicated in the synthesis of siderophores which function as iron chelators in the iron limited sea surface water in which dinoflagellates bloom (Trick et al., 1983). A highly plausible evolutionary scenario is toxin production as an outcome of gene duplication and neofunctionalisation, rampant in dinoflagellates (Jaeckisch et al., 2011). Competitive advantages conferred by toxin production would explain the retention of metabolically costly substances. Of course other selectively advantageous roles for these metabolites are possible. The taxonomic composition of the bloom is interesting in this regard. Seasonal patterns in the Chesapeake suggest competitive exclusion between three bloom forming dinoflagellates (Heterocapsa, Prorocentrum, and Karlodinium). The low abundance of Karlodinium in the bloom could be the result of allelopathic effects of Prorocentrum (Yamasaki et al., 2010). Similarly, Gyrodinium species are voracious predators of P. minimum (Kim and Jeong, 2004), and both fed (Fig. 1F–H) and unfed (Fig. 1I) Gyrodinium were present in the bloom. It is fascinating then that among the NRPS/PKS domain containing contigs, several were many fold more abundant in the bloom sample than in the clonal isolate, suggesting a possible allelopathic or protective role for metabolic substances they produce. However, alternative explanations for seasonal patterns of dinoflagellate abundance in the Chesapeake are equally plausible. For example, P. minimum blooms are known to track nitrogen and phosphorus availability (Glibert et al., 2008) and the presence and form of nutrient transporters and metabolic functions we identified in the bloom metatranscriptome could provide insights into the relationship between blooms and seasonal nutrient availability in the Chesapeake. Thus the prospect of studying metabolic function through environmental transcriptome profiling, demonstrated to be effective in this study, promises to greatly enhance our capacity to understand the genetics of toxin biosynthesis in situ and uncover the true ecophysiological role of toxic dinoflagellate metabolites. Similarly, environmental transcriptome profiling can reveal the metabolic processes underpinning bloom initiation, maintenance and termination. Furthermore, deeply sequenced marine metatranscriptomes might reveal toxin and fatty acid biosynthesis genes such as PKS whose structure can predict novel toxins and biological products, and could provide a valuable addition to the marine bio-prospecting toolbox (Winter et al., 2011). Our successful application of these methods suggests an exciting future for environmental transcriptomics of important eukaryote communities.
Supplementary Material
Acknowledgements
This work was made possible through funding from the National Science Foundation (grants DEB-1036506, DEB-1046075, DEB-0629624). We would like to thank Greg Conception for collecting the bloom sample and extracting its RNA, and Travis Rogers for extracting RNA from the clonal culture of P. minimum.[SS]
Footnotes
Appendix A. Supplementary data
Supplementary material related to this article can be found, in the online version, at http://dx.doi.org/10.1016/j.hal.2014.04.016.
References
- Adolf JE, Yeager CL, Miller WD, Mallonee ME, Harding LW. Environmental forcing of phytoplankton floral composition, biomass, and primary productivity in Chesapeake Bay, USA. Estuarine Coastal Shelf Sci. 2006;67(1–2):108–122. [Google Scholar]
- Adolf JE, Bachvaroff TR, Place AR. Can cryptophyte abundance trigger toxic Karlodinium veneficum blooms in eutrophic estuaries. Harmful Algae. 2008;8(1):119–128. [Google Scholar]
- Anderson DM, Rengefors K. Community assembly and seasonal succession of marine dinoflagellates in a temperate estuary: the importance of life cycle events. Limnol. Oceanogr. 2006;51(2):860–873. [Google Scholar]
- Bachvaroff TR, Place AR. From stop to start: tandem gene arrangement, copy number and trans-splicing sites in the dinoflagellate Amphidiunium carterae. PLoS ONE. 2008;3(8):e2929. doi: 10.1371/journal.pone.0002929. [DOI] [PMC free article] [PubMed] [Google Scholar]
- Bachvaroff TR, Gornik SG, Concepcion GT, Waller RF, Mendez GS, Lippmeier JC, Delwiche CF. Dinoflagellate phylogeny revisited: using ribosomal proteins to resolve deep branching dinoflagellate clades. Mol. Phylogenet. Evol. 2014;70:314–322. doi: 10.1016/j.ympev.2013.10.007. [DOI] [PMC free article] [PubMed] [Google Scholar]
- Baldauf SL. The deep roots of eukaryotes. Science. 2003;300(5656):1703–1706. doi: 10.1126/science.1085544. [DOI] [PubMed] [Google Scholar]
- Beauchemin M, Roy S, Daoust P, Dagenais-Bellefeuille S, Bertomeu T, Letourneau L, Lang BF, Morse D. Dinoflagellate tandem array gene transcripts are highly conserved and not polycistronic. Proc. Natl. Acad. Sci. U. S. A. 2012;109(39):15793–15798. doi: 10.1073/pnas.1206683109. [DOI] [PMC free article] [PubMed] [Google Scholar]
- Bentley DR, et al. Accurate whole human genome sequencing using reversible terminator chemistry. Nature. 2008;456(7218):53–59. doi: 10.1038/nature07517. [DOI] [PMC free article] [PubMed] [Google Scholar]
- Cloern JE, Schraga TS, Lopez CB, Knowles N, Labiosa RG, Dugdale R. Climate anomalies generate an exceptional dinoflagellate bloom in San Francisco Bay. Geophys. Res. Lett. 2005;32(14):L14608. [Google Scholar]
- Camacho C, Coulouris G, Avagyan V, Ma N, Papadopulos J, Bealer K, Madden TL. BLAST+: architecture and applications. BMC Bioinform. 2009;10:421. doi: 10.1186/1471-2105-10-421. [DOI] [PMC free article] [PubMed] [Google Scholar]
- Conesa A, Gotz S, García-Gomez JM, Terol J, Talon M, Robles M. Blast2GO: a universal tool for annotation, visualization and analysis in functional genomics research. Bioinformatics. 2005;21(18):3674–3676. doi: 10.1093/bioinformatics/bti610. [DOI] [PubMed] [Google Scholar]
- Damon C, Lehembre F, Oger-Desfeux C, Luis P, Ranger J, Fraissinet-Tachet L, Marmeisse R. Metatranscriptomics reveals the diversity of genes expressed by eukaryotes in forest soils. PLoS ONE. 2012;7(1):e28967. doi: 10.1371/journal.pone.0028967. [DOI] [PMC free article] [PubMed] [Google Scholar]
- Derelle R, Lang BF. Rooting the eukaryotic tree with mitochondrial and bacterial proteins. Mol. Biol. Evol. 2012;29(4):1277–1289. doi: 10.1093/molbev/msr295. [DOI] [PubMed] [Google Scholar]
- Dunn CW, Hejnol A, Matus DQ, Pang K, Browne WE, Smith SA, Seaver E, Rouse GW, Obst M, Edgecombe GD, Sørensen MV, Haddock SHD, Schmidt-Rhaesa A, Okusu A, Kristensen RM, Wheeler WC, Martindale MQ, Giribet G. Broad phylogenomic sampling improves resolution of the animal tree of life. Nature. 2008;452(7188):745–749. doi: 10.1038/nature06614. [DOI] [PubMed] [Google Scholar]
- Errera RM, Campbell L. Osmotic stress triggers toxin production by the dinoflagellate Karenia brevis. Proc. Natl. Acad. Sci. U. S. A. 2011;108(26):10597–10601. doi: 10.1073/pnas.1104247108. [DOI] [PMC free article] [PubMed] [Google Scholar]
- Errera RM, Campbell L. Osmotic stress does trigger brevetoxin production in the dinoflagellate Karenia brevis. Proc. Natl. Acad. Sci. U. S. A. 2013;110(25):E2255. doi: 10.1073/pnas.1306975110. [DOI] [PMC free article] [PubMed] [Google Scholar]
- Glenn TC. Field guide to next-generation DNA sequencers. Mol. Ecol. Resour. 2011;11(5):759–769. doi: 10.1111/j.1755-0998.2011.03024.x. [DOI] [PubMed] [Google Scholar]
- Glibert PM, Mayorga E, Seitzinger S. Prorocentrum minimum tracks anthropogenic nitrogen and phosphorus inputs on a global basis: application of spatially explicit nutrient export models. Harmful Algae. 2008;8:33–38. [Google Scholar]
- Grabherr MG, Haas BJ, Yassour M, Levin JZ, Thompson DA, Amit I, Adiconis X, Fan L, Raychowdhury R, Zeng Q, Chen Z, Mauceli E, Hacohen N, Gnirke A, Rhind N, di Palma F, Birren BW, Nusbaum C, Lindblad-Toh K, Friedman N, Regev A. Full-length transcriptome assembly from RNA-Seq data without a reference genome. Nat. Biotechnol. 2011;29(7):644–652. doi: 10.1038/nbt.1883. [DOI] [PMC free article] [PubMed] [Google Scholar]
- Grzebyk D, Denardou A, Berland B, Pouchus YF. Evidence for a new toxin in the red-tide dinoflagellate Prorocentrum minimum. J. Plankton Res. 1997;19(8):1111–1124. [Google Scholar]
- Harding LW. Long-term trends in the distribution of phytoplankton in Chesapeake Bay: roles of light, nutrients and streamflow. Mar. Ecol. Prog. Ser. 1994;104:267–291. [Google Scholar]
- Harding LW, Perry ES. Long-term increase of phytoplankton biomass in Chesapeake Bay, 1950–1994. Mar. Ecol. Prog. Ser. 1997;157:39–52. [Google Scholar]
- Heil CA, Glibert PM, Fan C. Prorocentrum minimum (Pavillard) Schiller: a review of a harmful algal bloom species of growing worldwide importance. Harmful Algae. 2005;4(3):449–470. [Google Scholar]
- Hense I. Approaches to model the life cycle of harmful algae. J. Mar. Syst. 2010;83(3–4):108–114. [Google Scholar]
- Howe AC, Jansson JK, Malfatti SA, Tringe SG, Tiedje JM, Brown CT. Tackling soil diversity with the assembly of large, complex metagenomes. Proc. Natl. Acad. Sci. U. S. A. (Early View) 2014 doi: 10.1073/pnas.1402564111. [DOI] [PMC free article] [PubMed] [Google Scholar]
- Hunter S, Apweiler R, Attwood TK, Bairoch A, Bateman A, Binns D, Bork P, Das U, Daugherty L, Duquenne L, Finn RD, Gough J, Haft D, Hulo N, Kahn D, Kelly E, Laugraud A, Letunic I, Lonsdale D, Lopez R, Madera M, Maslen J, McAnulla C, McDowall J, Mistry J, Mitchell A, Mulder N, Natale D, Orengo C, Quinn AF, Selengut JD, Sigrist CJA, Thimma M, Thomas PD, Valentin F, Wilson D, Wu CH, Yeats C. InterPro: the integrative protein signature database. Nucleic Acids Res. 2008;37:D211–D215. doi: 10.1093/nar/gkn785. [DOI] [PMC free article] [PubMed] [Google Scholar]
- Jaeckisch N, Yang I, Wohlrab S, Glockner G, Kroymann J, Vogel H, Cembella A, John U. Comparative genomic and transcriptomic characterization of the toxigenic marine dinoflagellate Alexandrium ostenfeldii. PLoS ONE. 2011;6(12):e28012. doi: 10.1371/journal.pone.0028012. [DOI] [PMC free article] [PubMed] [Google Scholar]
- Kellman R, Stuken A, Orr RJS, Svendsen HM, Jakobsen KS. Biosynthesis and molecular genetics of polyketides in marine dinoflagellates. Drugs. 2010 Mar;8(4):1011–1048. doi: 10.3390/md8041011. [DOI] [PMC free article] [PubMed] [Google Scholar]
- Kim JS, Jeong HJ. Feeding by the heterotrophic dinoflagellates Gyrodinium dominans and G. spirale on the red-tide dinoflagellate Prorocentrum minimum. Mar. Ecol. Prog. Ser. 2004;280:85L, 94. [Google Scholar]
- Kircher M, Sawyer S, Meyer M. Double indexing overcomes inaccuracies in multiplex sequencing on the illumina platform. Nucleic Acids Res. 2012;40(1):e3. doi: 10.1093/nar/gkr771. [DOI] [PMC free article] [PubMed] [Google Scholar]
- Kvist S, Siddall ME. Phylogenomics of Annelida revisited: a cladistic approach using genome-wide expressed sequence tag data mining and examining the effects of missing data. Cladistics. 2013;29(4):435–448. doi: 10.1111/cla.12015. [DOI] [PubMed] [Google Scholar]
- Langmead B, Trapnell C, Pop M, Salzberg SL. Ultrafast and memory-efficient alignment of short DNA sequences to the human genome. Genome Biol. 2009;10:R25. doi: 10.1186/gb-2009-10-3-r25. [DOI] [PMC free article] [PubMed] [Google Scholar]
- Li B, Dewey CN. RSEM: accurate transcript quantification from RNA-Seq data with or without a reference genome. BMC Bioinform. 2011;12:323. doi: 10.1186/1471-2105-12-323. [DOI] [PMC free article] [PubMed] [Google Scholar]
- Lin S, Zhang H, Zhuang Y, Tran B, Gill J. Spliced leader-based metatranscriptomic analyses lead to recognition of hidden genomic features in dinoflagellates. Proc. Natl. Acad. Sci. U. S. A. 2010;107(46):20033–20038. doi: 10.1073/pnas.1007246107. [DOI] [PMC free article] [PubMed] [Google Scholar]
- Lopez-Garcia P, Rodriguez-Valera F, Pedros-Alio C, Moreira D. Unexpected diversity of small eukaryotes in deep-sea Antarctic plankton. Nature. 2001;409(6820):603–607. doi: 10.1038/35054537. [DOI] [PubMed] [Google Scholar]
- Marcais G, Kingsford C. A fast, lock-free approach for efficient parallel counting of occurrences of k-mers. Bioinformatics. 2011;27(6):764–770. doi: 10.1093/bioinformatics/btr011. [DOI] [PMC free article] [PubMed] [Google Scholar]
- Marchetti A, Schruth DM, Durkin C, Parker MS, Kodner RB, Berthiaume CT, Morales R, Allen AE, Armbrust EV. Comparative metatranscriptomics identifies molecular bases for the physiological responses of phytoplankton to varying iron availability. Proc. Natl. Acad. Sci. U. S. A. 2012;109(6):E317–E325. doi: 10.1073/pnas.1118408109. [DOI] [PMC free article] [PubMed] [Google Scholar]
- Moon-van der Staay S, de Wachter R, Vaulot D. Oceanic 18S rDNA sequences from picoplankton reveal unsuspected eukaryote diversity. Nature. 2001;409(6820):607–610. doi: 10.1038/35054541. [DOI] [PubMed] [Google Scholar]
- Morey JS, Van Dolah FM. Global analysis of mRNA half-lives and de novo transcription in a dinoflagellate, Karenia brevis. PLoS ONE. 2013;8(6):e66347. doi: 10.1371/journal.pone.0066347. [DOI] [PMC free article] [PubMed] [Google Scholar]
- Morey JS, Monroe EA, Kinney AL, Beal M, Johnson JG, Hitchcock GL, Van Dolah FM. Transcriptomic response of the red tide dinoflagellate, Karenia brevis, to nitrogen and phosphorus depletion and addition. BMC Genom. 2011;12:346. doi: 10.1186/1471-2164-12-346. [DOI] [PMC free article] [PubMed] [Google Scholar]
- Oakley TH, Wolfe JM, Lindgren AR, Zaharoff AK. Phylotranscriptomics to bring the understudied into the fold: monophyletic Ostracoda, fossil placement, and pancrustacean phylogeny. Mol. Biol. Evol. 2012;30(1):215–233. doi: 10.1093/molbev/mss216. [DOI] [PubMed] [Google Scholar]
- Ottensen EA, Young CR, Eppley JM, Ryan JP, Chavez FP, Scholin CA, DeLong EF. Pattern and synchrony of gene expression among sympatric marine microbial populations. Proc. Natl. Acad. Sci. U. S. A. 2013 doi: 10.1073/pnas.1222099110. http://dx.doi.org/10.1073/pnas.1222099110 (Early Ed) [DOI] [PMC free article] [PubMed]
- Punta M, Coggill PC, Eberhardt RY, Mistry J, Tate J, Boursnell C, Pang N, Forslund K, Ceric G, Clements J, Heger A, Holm L, Sonnhammer ELL, Eddy SR, Bateman A, Finn RD. The Pfam protein families database. Nucleic Acids Res. 2012;40:D290–D301. doi: 10.1093/nar/gkr1065. [DOI] [PMC free article] [PubMed] [Google Scholar]
- Schmieder R, Lim YW, Edwards R. TagCleaner: identification and removal of tag sequences from genomic and metagenomic datasets. BMC Bioinform. 2010;11:341. doi: 10.1186/1471-2105-11-341. [DOI] [PMC free article] [PubMed] [Google Scholar]
- Shoguchi E, Shinzato C, Kawashima T, Gyoja F, Mungpakdee S, Koyanagi R, Takeuchi T, Hisata K, Tanaka M, Fujiwara M, Hamada M, Seidi A, Fujie M, Usami T, Goto H, Yamasaki S, Arakaki N, Suzuki Y, Sugano S, Toyoda A, Kuroki Y, Fujiyama A, Medina M, Coffroth MA, Bhattacharya D, Satoh N. Draft assembly of the Symbiodinium minutum nuclear genome reveals dinoflagellate gene structure. Curr. Biol. 2013;23:1399–1408. doi: 10.1016/j.cub.2013.05.062. [DOI] [PubMed] [Google Scholar]
- Stamatakis A. RAxML-VI-HPC: maximum likelihood-based phylogenetic analysis with thousands of taxa and mixed models. Bioinformatics. 2006;22(21):2688–2690. doi: 10.1093/bioinformatics/btl446. [DOI] [PubMed] [Google Scholar]
- Stoeck T, Hayward B, Taylor GT, Varela R, Epstein SS. A multiple PCR-primer approach to access the microeukaryotic diversity in environmental samples. Protist. 2006;157(1):31–43. doi: 10.1016/j.protis.2005.10.004. [DOI] [PubMed] [Google Scholar]
- Sunda WG, Burleson C, Hardison DR, Morey JS, Wang Z, Wolny J, Corcoran A, Flewelling LJ, Van Dolah FM. Osmotic stress does not trigger brevetoxin production in the dinoflagellate Karenia brevis. Proc. Natl. Acad. Sci. U. S. A. 2013a;110(25):10223–10228. doi: 10.1073/pnas.1217716110. [DOI] [PMC free article] [PubMed] [Google Scholar]
- Sunda WG, Burleson C, Hardison DR, Morey JS, Wang Z, Wolny J, Corcoran AA, Flewelling LJ, Van Dolah FM. Reply to Errera and Campbell: no low salinity shock does not increase brevetoxins in Karenia brevis. Proc. Natl. Acad. Sci. U. S. A. 2013b;110(25):E2256. doi: 10.1073/pnas.1307836110. [DOI] [PMC free article] [PubMed] [Google Scholar]
- Tango PJ, Magnien R, Butler W, Luckett C, Luckenbach M, Lacouture R, Poukish C. Impacts and potential effects due to Prorocentrum minimum blooms in Chesapeake Bay. Harmful Algae. 2005;4(3):525–531. [Google Scholar]
- Timme RE, Delwiche CF. Uncovering the evolutionary origin of plant molecular processes: comparison of the Coleochaete (Coleochaetales) and Spirogyra (Zygnematales) transcriptomes. BMC Plant Biol. 2010;10:96. doi: 10.1186/1471-2229-10-96. [DOI] [PMC free article] [PubMed] [Google Scholar]
- Timme RE, Bachvaroff TR, Delwiche CF. Broad phylogenetic sampling and the sister lineage of land plants. PLoS ONE. 2012;7(1):e29696. doi: 10.1371/journal.pone.0029696. [DOI] [PMC free article] [PubMed] [Google Scholar]
- Trick CG, Anderson RJ, Gillam A, Harrison PJ. Prorocentrim: an extra-cellular siderophore produced by the marine dinoflagellate Prorocentrum minimum. Science. 1983;219(4582):306–308. doi: 10.1126/science.219.4582.306. [DOI] [PubMed] [Google Scholar]
- Viaene T, Delwiche CF, Rensing SA, Friml J. Origin and evolution of PIN auxin transporters in the green lineage. Trends Plant Sci. 2013;18(1):5–10. doi: 10.1016/j.tplants.2012.08.009. [DOI] [PubMed] [Google Scholar]
- Winter JM, Behnken S, Hertweck C. Genomics-inspired discovery of natural products. Curr. Opin. Chem. Biol. 2011;15(1):22–31. doi: 10.1016/j.cbpa.2010.10.020. [DOI] [PubMed] [Google Scholar]
- Wisecaver JH, Hackett JD. Dinoflagellate genome evolution. Annu. Rev. Microbiol. 2011;65:369–387. doi: 10.1146/annurev-micro-090110-102841. [DOI] [PubMed] [Google Scholar]
- Yamasaki Y, Nagasoe S, Tameishi M, Shikata T, Zou Y, Jiang Z, Matsubara T, Shimasaki Y, Yamaguchi K, Oshima Y, Oda K, Honjo T. The role of interactions between Prorocentrum minimum and Heterosigma akashiwo in bloom formation. Hydrobiologia. 2010;641(1):33–44. [Google Scholar]
Associated Data
This section collects any data citations, data availability statements, or supplementary materials included in this article.