

Abstract
It has been proposed that forces resulting from the physical exclusion of macromolecules from the bacterial nucleoid play a central role in organizing the bacterial cell, yet this proposal has not been quantitatively tested. To investigate this hypothesis, we mapped the generic motion of large protein complexes in the bacterial cytoplasm through quantitative analysis of thousands of complete cell-cycle trajectories of fluorescently tagged ectopic MS2-mRNA complexes. We find the motion of these complexes in the cytoplasm is strongly dependent on their spatial position along the long axis of the cell, and that their dynamics are consistent with a quantitative model that requires only nucleoid exclusion and membrane confinement. This analysis also reveals that the nucleoid increases the mobility of MS2-mRNA complexes, resulting in a fourfold increase in diffusion coefficients between regions of the lowest and highest nucleoid density. These data provide strong quantitative support for two modes of nucleoid action: the widely accepted mechanism of nucleoid exclusion in organizing the cell and a newly proposed mode, in which the nucleoid facilitates rapid motion throughout the cytoplasm.
Introduction
In vivo imaging of the bacterial cell has revealed that even the simplest of organisms still display complex, cellular-scale spatial and temporal structure. For instance, genes on the bacterial nucleoid, a highly condensed circular DNA molecule, have been found to localize to sequence-specific locations with a precision of 10% of cell length (1,2). Proteins also show diverse and dynamic spatial localization patterns, from the polar localization of chemotaxis receptors (3) to the precise positioning of the cytokinetic Z-ring at midcell (4) to the cellular-scale oscillations of the min system (5). This cellular-scale structure is particularly striking considering that bacterial cells lack both membrane-bound organelles and cytoskeletal molecular motors, components that together play a central role in the spatiotemporal organization of the eukaryotic cell. The organizing principles of the bacterial cell, in particular the detailed mechanisms that drive cellular-scale spatial and temporal organization, are still poorly understood.
A number of groups have proposed that the nucleoid may play a central role as an organization template in the bacterial cell (6). It has long been known that aggregates of misfolded or nonfunctional proteins tend to localize at the cell poles, a process that has been implicated in cellular aging effects (7,8). But it is not entirely clear whether the complexes move under the influence of biased forces throughout the cytoplasm or undergo unbiased Brownian motion until they become trapped at the poles. Modeling studies have suggested that membrane curvature, nucleoid exclusion, and overexpression are sufficient to cause polar localization of protein complexes (9–13), but a comprehensive quantitative experimental investigation has yet to confirm this hypothesis. Recent studies have also reported that the nucleoid plays a significant role in gene expression: mRNA-bound ribosomal subunits are excluded from the nucleoid whereas free ribosomal units are not, allowing for easy access to nascent mRNA transcripts and tight coupling between transcription and translation (14). Furthermore, it has also been proposed that entropic effects from the nucleoid may be an essential component in cellular-scale chromosome organization, in particular in the poorly understood chromosome segregation process in Escherichia coli (E. coli) (15,16).
To explicitly investigate the hypothesis that the bacterial nucleoid plays an essential role in the organization and dynamics of the cell, we set out to quantitatively map the dynamics of molecular complexes in the cytoplasm of growing E. coli cells. We make use of an existing green fluorescent protein (GFP)-labeled MS2-mRNA system (17) as a tracer to quantitatively map the cellular-scale, spatially dependent dynamics of the cytoplasm in thousands of complete cell cycles. The complexes are approximately twice the size of the E. coli ribosome and the MS2-bound messages are neither translated nor degradable, thus facilitating complete cell-cycle imaging (17). Because this system is ectopic to E. coli, it is believed that it is subject only to nonspecific interactions that would be general to all large complexes, including blobs of condensed chromosomal DNA, plasmids, ribosomes, and large protein aggregates.
Our measurements recapitulate the results of previous reports describing a polar-directed drift of molecular complexes and provide a new spatial map of this drift throughout the cell (18,19). Quantitative analysis of this drift closely matches the predictions of a minimal model composed of two basic physical mechanisms: nucleoid exclusion and membrane confinement. To confirm our model, we made perturbations to nucleoid structure, cellular shape, and cell physiology, and found results that reveal an unexpectedly central role for the nucleoid in determining the mobility of protein complexes in the cytoplasm. Although extensive studies have previously been performed on characterizing the dynamics of bacterial cytoplasm (17,20,21), our study is the first to quantitatively characterize the spatial dependence of the dynamics throughout the entire cell cycle, which reveals that the mobility of protein complexes is significantly larger over the nucleoid region and tends to increase when nucleoid structure is perturbed. These observations may explain many of the phenomena previously attributed to more complicated physical mechanisms.
Material and Methods
Bacterial strains
The E. coli strain used in this study (a gift from I. Golding) is DH5α-Z1 carrying the plasmids pIG-K133 and pIG-BAC2. pIG-BAC2 is a low-copy plasmid that encodes an mRNA molecule with a 96-tandem repeat of binding sites for the RNA-binding protein MS2 under the Plac promoter. pIG-K133 contains a GFP-MS2 protein fusion under the tetracycline promoter. Note that in the absence of pIG-BAC2, no aggregation of GFP-MS2 is observed. A detailed description of this system can be found in (17).
Growth conditions and microscopy
All strains were grown overnight from a single colony in Luria Broth (LB) media with the appropriate antibiotics (Kanamycin and Chloramphenicol). Doubling time in liquid media was ∼ 30 min. Overnights were diluted 1:1000 the next day into fresh media and grown to midlogarithmic phase at 30°C (OD600 ∼ 0.2). The cells were then induced with Isopropyl β-D-1-thiogalactopyranoside (IPTG) (1 mM) and aTc (10 ng/ml) for 15 min at 30°C. Cells were rinsed and grown in fresh media for 1 hr at 30°C.
Agarose pads were prepared by pouring 1 mL of growth media with IPTG (0.25 mM) and 0.2% agarose into 2 × 2 cm wells cut into a rubber gasket sealed onto a standard microscope slide. 2 μL of cells were spotted onto dried pads and a cover slip was placed on top of the pad. The entire slide was sealed with VALP (1:1:1 vaseline, lanolin, paraffin). Under imaging conditions, the average doubling time for cells was 46 min.
For biological perturbations: Rifampicin treatment: agarose pads were treated with 100 μg/ml Rif and cells where inoculated on the pad for 30 min before imaging. A22: cells were grown in LB and 10 μg/ml A22 for 2 hr and then spotted on agarose pad with the same concentration of A22. Novobiocin: cells were spotted on agarose pads with 1000 μg/ml of novobiocin and inoculated on the pad for 30 min before imaging. Sodium azide: cells were grown in sodium azide (0.01%) and 2-Deoxy-D-glucose (1 mM) for 30 min before being spotted on a pad with the same concentrations. UV radiation: cells on the pad were exposed to high intensity UV light (λ = 254 nm) for 2 s and then left to grow for 1 hr before imaging.
For the visualization of the chromosome, cells were fixed in 1 ml of 70% ethanol and 30% phosphate buffered solution (PBS) for 3 min, rinsed twice in PBS, and then resuspended in 1 μg/ml of 4',6-diamidino-2-phenylindole (DAPI).
Time-lapse phase-contrast and wide-field fluorescence microscopy images were collected with a large-format sCMOS camera (Andor Neo, Belfast, Northern Ireland) at 1 min intervals using NIS-Elements software connected to a Nikon-TiE (Nikon, Tokyo, Japan) inverted microscope outfitted with an environmental chamber.
Image analysis
Cells were identified and linked from frame to frame using automated custom MATLAB (Mathworks, Natick, MA) segmentation software (22). The MS2-GFP foci were tracked in each frame and linked to form trajectories. For analysis, we included only cells in which both birth and division were observed, precluding filamentous and nongrowing cells.
Results
Complete cell-cycle imaging of MS2-mRNA dynamics
To quantitatively characterize MS2-mRNA dynamics throughout the cell cycle, we captured thousands of complete cell cycles: cells in which both birth and division are explicitly observed. We analyzed 6655 complete cell cycles with at least one MS2-mRNA trajectory (Fig. 1). For image analysis, the coordinate system in cells was oriented along the major and minor axes of the cell with the origin at cell-center. Because we combine trajectories from cells with significant cell-to-cell variation in length, it is convenient to express the long-axis positions as a fraction of total cell length, which we refer to as relative position. Finally, because we capture the entire cell cycle, we can also orient our coordinate system by the old and new cell pole (the cell pole that originated from the previous division event), where we define the center of the cell as 0, the old pole as 0.5, and the new pole as -0.5 in relative cell-length units.
Figure 1.
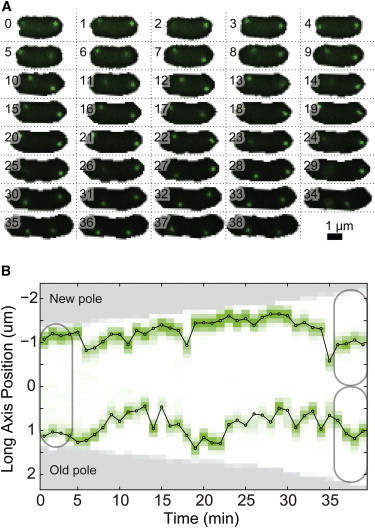
(A) Wide-field fluorescence images showing the dynamics of MS2-mRNA complexes in a typical cell throughout the entire cell cycle. Frame numbers are measured in minutes. (B) Kymograph of MS2-mRNA cell-cycle trajectory plotted along the long axis of the cell shows dynamic localization of protein complexes throughout the cell cycle. To see this figure in color, go online.
It has been previously noted that MS2-mRNA complexes tend to be produced at the 1/4 or 3/4 positions of the cell and then migrate to the poles asymmetrically, with a strong bias toward the old pole of the cell (23). We also observe that most of the MS2-mRNA molecules (76%) are indeed located less than 0.2 cell length away from the poles during the entire cell cycle, with a majority of those (70%) located near the old cell pole. We also find a smaller amount (10%) of MS2-mRNA within ± 0.1 cell length from the center of the cell, with the occupancy distribution shifting from a single peak early in the cell cycle into two centrally located peaks late in the cell cycle before division (Fig. 2 A).
Figure 2.
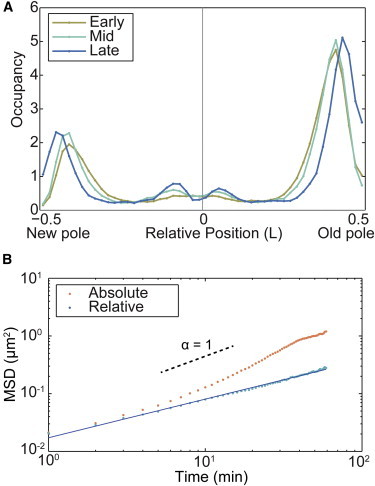
(A) Normalized histogram of the position of MS2-mRNA complexes in relative length units (N = 282,860). Because of cell-to-cell variation in doubling time, cell cycles were partitioned into thirds: early, mid, and late. 76% of the molecular complexes are localized near the poles of the cell. (B) MSD analysis of MS2-mRNA motion. The MSD is computed using two velocity models: absolute (orange) and relative (blue). The relative model MSD has a constant slope with a scaling parameter α = 0.66, consistent with previous measurements, whereas the absolute model increases in slope because of cell growth at times greater than 10 min (N = 8053 trajectories). To see this figure in color, go online.
MS2-mRNA motion is dominated by cell growth
A fundamental unanswered question related to intracellular motion in growing cells is whether cytoplasmic factors tend to maintain their absolute position in the cell (in relation to some cellular landmark) or their relative position as a function of cell length, e.g., quarter-cell. We tested the two models: complexes execute stochastic motion about their (1) absolute or (2) relative position in the cell. In the absolute motion model, we measure the positions and displacements of the MS2-mRNA complexes at all times from the center of the cell. In the relative velocity model, factors that maintain their relative position in the cell from frame-to-frame, e.g., stay at quarter-cell, are defined to have zero displacement. To calculate this relative velocity, we subtract from the absolute velocity a correction term proportional to the rate of cell growth:
| (1) |
where is the absolute velocity, is the initial position of the displacement vector, and L(t) is the length of the cell.
To compare the two models, we computed the mean squared displacement (MSD) for the two models of motion. The MSD is defined as follows:
| (2) |
where the Δx(t) is the long-axis displacement over time t in either the absolute or relative coordinates, and the averaging is performed over time and distinct trajectories. The model that minimizes the MSD as a function of time minimizes the bias in the motion and is therefore the best model for the motion. The two model are expected to be equal on short times but divergent on timescales over which the bias in the motion is significant in comparison with stochastic motion. (See Supporting Material for a more detailed explanation.)
The MSD plots for the two velocity models are shown in Fig. 2 B for observation times up to 70 min, two decades longer than previously reported for this system. As expected, the MSD measurements are consistent at short times for both models; but at times greater than 10 min, the slope of the absolute velocity model significantly increases, and consequently the MSD for the absolute model is nearly an order of magnitude greater than the relative velocity model for times on the order of the cell cycle. If we were to use absolute velocities in the analysis of cell-cycle length trajectories, our results would be completely dominated by the apparent motion of complexes moving to maintain their relative position in the cell. Therefore, in all subsequent analysis we use the relative velocity model.
For the relative velocity model, the MSD is well fit at all times by the following power-law:
| (3) |
with a scaling parameter α = 0.66 ± 0.01. This value of the scaling parameter has been previously reported for shorter timescales using the absolute velocity model. Our observations remain consistent with these previous measurements because the discrepancy in MSD scaling between absolute and relative models is only observable at timescales much longer than previous experiments explored. The observed MSD scaling parameter leads to a broad class of dynamics called subdiffusion (α < 1). Weber et al. (19) attributed this observation to the viscoelastic nature of the cytoplasm, in which a characteristic feature of viscoelasticity is anticorrelation of sequential steps in particle trajectories, which we also observe in our trajectories, further supporting the use of the relative velocity model (Fig. S1 in the Supporting Material).
Step-size distribution has exponential tails
Although we observe a subdiffusive MSD, we also observe rare but relatively large displacements of complexes, e.g., from midcell to the cell pole in a few minutes. These events, which have also been recently observed in the motion of the nucleoid (24), suggest variability in the mobility beyond the expected statistical variability of subdiffusive motion. To quantitatively characterize these rare events, we compute the step-size distribution (frame-to-frame displacements) shown in Fig. 3. Note that for clarity the data shown in Fig. 3 is only for MS2-mRNA complexes found in the middle of the cell. (Additional distributions from other cellular positions are included in the Supporting Material, Fig. S2). A standard diffusive model would predict a Gaussian distribution of step sizes. Instead, we observe that the step-size distribution is well characterized by a symmetric exponential decay function:
| (4) |
with a decay constant λ = 125 ± 2 nm. Both the Gaussian and exponential fits in Fig. 3 have identical variance, but the exponential model has a higher frequency of large steps, in agreement with our qualitative observations of MS2-mRNA dynamics.
Figure 3.
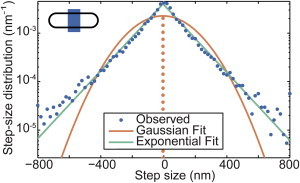
Step-size distribution. The step-size distribution is shown for MS2-mRNA complexes for a 1 min lag time for complexes with an initial position in the middle fifth of the cell, as illustrated in the inset. The data (blue circles) are compared with two models for the step-size distribution: exponential (green line) and Gaussian (orange line). Both models have the same mean and variance as the experimental data. The observed step-size distribution is in excellent agreement with the exponential model (N = 8053 trajectories). To see this figure in color, go online.
Mapping cell-cycle and position-dependent particle motion
Fig. 3 displays the step-size distribution for MS2-mRNA complexes found at midcell, but we have trajectory information from nearly every region of the cell. To efficiently characterize the step-size distribution at different regions along the long axis of the cell, we calculate the first two moments of the distribution: we define the drift velocity as the mean of the step-size distribution divided by the lag time (the time between successive measurements),
| (5) |
and the diffusion coefficient as the variance of the step-size distribution divided by twice the lag time,
| (6) |
where these definitions are consistent with the standard definitions of drift velocity and diffusion coefficient for a diffusive particle in a Newtonian fluid.
To map the dynamics of MS2-mRNA complexes in distinct regions of the cell, the long axis of the cell was split into 50 regions and the frame-to-frame displacement of each MS2-mRNA complex was binned by the starting position of each displacement vector. We then calculate the drift velocity (Eq. 5) and diffusion coefficient (Eq. 6) for each region. Because of cell-to-cell variation in doubling time, to investigate cell-cycle-dependent dynamics we split the cell cycle in three relative time phases (early, mid, late), and calculated the drift velocity and diffusion coefficient map for each time phase individually.
Fig. 4 A shows an annotated drift velocity map, i.e., the drift velocity as a function of position along the long axis of the cell, averaged over the entire cell cycle for a lag time Δt = 1 min. To interpret the velocity map, we identify locations along the long axis of the cell where the drift velocity is zero. If the slope of the velocity map is negative at the zero crossing, the position corresponds to a stable point (dashed line). If the slope of the velocity map is positive at the zero crossing, the position corresponds to a saddle point dividing two catchment regions, corresponding to regions in the cell from which a MS2-mRNA complex would move toward a stable point (in the absence of diffusive motion).
Figure 4.
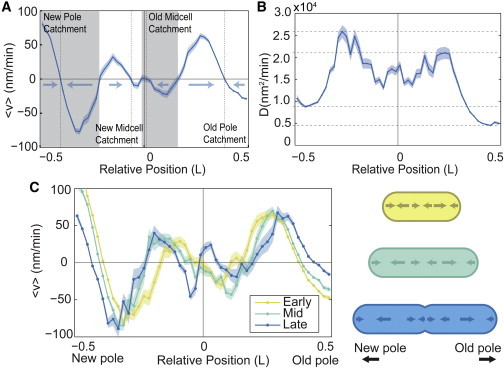
(A) Annotated map of drift velocity averaged over the cell cycle, with stable points (dashed lines) and catchment regions (gray and white regions) annotated. (B) Map of diffusion coefficient along the long axis of the cell averaged over the cell cycle. The highest mobility occurs over regions occupied by the nucleoid (± 0.25 cell lengths). The lowest mobility is observed at the old pole. (C) The drift velocity map shown for three relative cell-cycle times (early, mid, late) displays weak cell-cycle dependence. During the last third of the cell cycle, the velocity map is qualitatively changed at midcell, where the centrally located stable point divides into two stable point before division. (For all, N = 8053 trajectories.) To see this figure in color, go online.
Fig. 4 B shows the diffusion coefficient of MS2-mRNA complexes as a function of position along the long axis of the cell. Rather than being constant throughout the cell, we observe a large variability in the diffusion coefficient as a function of long-axis position in the cell. The most striking feature of Fig. 4 B is that the diffusion coefficient is highest at the cell-quarters, corresponding to the location of the nucleoid. The lowest mobility is at the old pole, where the diffusion coefficient is roughly half the value (4900 nm2/min) than at the new pole (9500 nm2/min).
Fig. 4 C shows the drift velocity map for the three relative phases of the cell cycle. For the first two-thirds of the cell cycle (early and mid) there are three stable points, corresponding to the cell poles and midcell. The stable points at the old and new pole correspond to the high-occupancy regions adjacent to the cell poles the occupancy of the stable region at midcell is much lower (see Fig. 2 A). During the last third of the cell cycle (late), the central stable point splits into two stronger stable points, which will become the new cell poles of the daughter cells after division. Because the overall cell-cycle dependence of the drift velocity map is generally weak, we ignore the cell-cycle dependence in most of the analysis that follows.
Finally, to test whether or not it is appropriate to interpret the observed data by a steady-state drift-diffusion model, we calculated whether or not the observed occupancy, drift velocities, and diffusion coefficients satisfied Fick’s Law for zero net flux:
| (7) |
where j is the flux and n is the number density of the MS2-mRNA complexes. Using Eq. 7, we can infer the drift velocity required to equilibrate the observed MS2-mRNA occupancy and compare this inferred drift velocity with the observed drift velocity. As shown in the Supporting Material, there is excellent agreement between these velocities, supporting the use of drift-diffusion model.
Quantitative model of nucleoid-exclusion and membrane confinement
To quantitatively test the proposed role of nucleoid-exclusion in generating the observed drift velocities found in Fig. 4, we construct a minimal statistical mechanics model of nucleoid exclusion. The model is derived and discussed in detail in the Supporting Material. Briefly, we treat the cytoplasm as a lattice where nucleoid DNA and MS2-mRNA cannot occupy the same site and then estimate the free energy cost from the excluded volume of the nucleoid. The model depends on a single unitless geometric parameter, Φ, that is fit by comparing the spatial distribution of MS2-mRNA complexes with the density of the nucleoid. The predicted velocity profile is as follows:
| (8) |
where nDNA is the number density of the nucleoid, V is the cell volume, and D is the measured diffusion coefficient (as a function of position and cell-cycle age). To estimate the density of the nucleoid, we measure the mean fluorescence intensity of DAPI-stained nucleoids (Fig. 5 A). The predicted velocity profile from nucleoid exclusion is plotted in Fig. 5 B (green dotted line), which shows excellent agreement to the observed drift velocity maps throughout the long axis of the cell, although notably fails at the cell poles.
Figure 5.
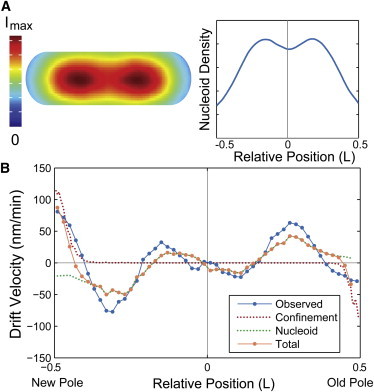
(A) At the left, nucleoid density in the cell. Cell-cycle and cell-to-cell mean interpolated fluorescent image of DAPI stained nucleoids (N = 369). At the right, nucleoid density as the sum of intensity of DAPI-stained nucleoids over the minor axis of the cell for relative positions along the major axis of the cell. (B) Comparison between predicted and measured velocity profiles. Measured velocity profile (blue) and predicted velocity profiles because of confinement at the poles from the inner membrane (red dotted) and nucleoid exclusion (green dotted) versus relative cell position. The combination of the two predicted velocity profiles (orange) is in excellent agreement with the measured profile. To see this figure in color, go online.
In addition to the exclusion forces generated by the nucleoid, the inner membrane of the cell also confines the motion of cytoplasmic complexes. To estimate the effect of membrane confinement of MS2-mRNA complexes at the cell poles (where our nucleoid exclusion model fails), we model the dynamics of protein complexes near the cell poles as diffusive particles near a hard wall. The solution to this problem is worked out in detail in the Supporting Material. Briefly, we calculate a theoretical step-size distribution by solving the diffusion equation with a hard-wall boundary condition using the method of images, which provides the following exact solution for the drift velocity:
| (9) |
where δ is the distance from the cell pole and Δt is the lag time in the velocity measurement. Note that this makes a fit-parameter-free prediction of the drift velocity at the poles of the cell solely because of membrane confinement. The predicted velocity profile from Eq. 9 is shown in Fig. 5 B (red dotted line), which shows excellent agreement with the observed drift velocity map near the cell poles.
If we combine the predicted drift velocity maps for the nucleoid exclusion and membrane confinement models, we see striking agreement with the qualitative shape and quantitative scale of the observed drift velocity map throughout the entire cell, indicating that both contributions are required to accurately model cytoplasmic dynamics. More parameters can be included in the model to recapitulate subtle features of the velocity map, for instance, the observed cell-cycle velocity map (Fig. 4 C) contains the late cell-cycle splitting of the midcell stable-point, consistent with an outward force at midcell because of the closing septum, which can be reproduced (Fig. S3 B). But in the interest of isolating the most general aspects of cytoplasmic dynamics, for the rest of the analysis we focus on the contributions from nucleoid exclusion and polar confinement.
Perturbations of nucleoid structure, cell geometry and physiology affect drift velocities and diffusion coefficients
To further investigate the role of the nucleoid in determining the mobility of complexes in the cell, we perturb cell physiology using a variety of small-molecule inhibitors. To identify changes to the MS2-mRNA motion we consider perturbations to the diffusion coefficient and changes to the nucleoid-induced exclusion. Based on previous work, we expect reductions in the metabolic activity through ATP-depletion would reduce the diffusion coefficient without significantly effecting nucleoid structure (21,25), whereas treatments that alter cell shape or the structure of the nucleoid would affect the nucleoid-exclusion-induced forcing.
For each perturbation, we again map the drift velocity and diffusion coefficient of MS2-mRNA complexes along the long axis of the cell. As Eq. 8 shows, because the predicted drift velocity distribution from nucleoid exclusion depends on both the spatially varying diffusion coefficient and the shape of the nucleoid, it is convenient to introduce the following forcing ratio, defined as the ratio of drift velocity to the diffusion coefficient:
| (10) |
to isolate contributions from nucleoid structure.
It has been reported that metabolic activity (21) and ATP-hydrolysis (24) increase the mobility of complexes in vivo. To investigate the role of ATP-hydrolysis, we treated the cells with the ATP-synthesis inhibitor sodium azide. As previously reported, the mean diffusion coefficient is significantly reduced, consistent with ATP-hydrolysis playing a role in the dynamics of molecular complexes in the cytoplasm (25). But because the forcing ratio is not significantly affected by ATP-depletion (Fig. S5 A), we conclude that because ATP-driven processes do not significantly affect nucleoid structure on the timescale of the cell cycle, they do not significantly contribute to nucleoid-exclusion-driven forcing.
To further test the hypothesis that nucleoid exclusion is a key contributor to the observed drift velocity map, we first perform a nonperturbative test: The small molecule A22 inhibits the activity of MreB, an essential protein involved in cell-wall synthesis (26). Without a proper cell wall, cells treated with A22 lose their rod-like shape and become more spherical and the nucleoid appears to be more diffusely localized throughout the cell (Fig. S4). The forcing ratio for cells treated with A22 is shown in Fig. 6 A. Under these conditions, the spheroid cells were still capable of undergoing division, therefore for analysis we define the long axis of the cell to be perpendicular to the division plane. Strikingly, the qualitative shape of the forcing ratio curve for A22 treated cells is nearly opposite that of untreated cells, supporting the hypothesis that nucleoid exclusion (specifically the overall shape and density of the nucleoid) is a key component of the dynamics of molecular complexes in the cytoplasm.
Figure 6.
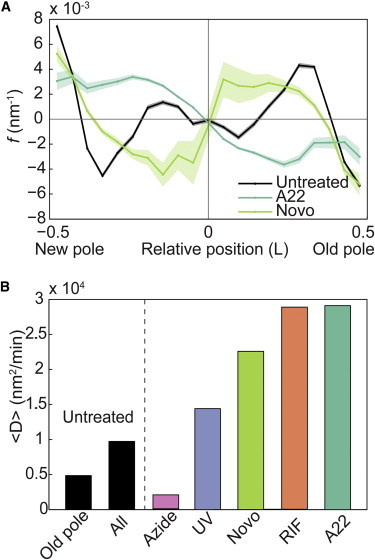
(A) Forcing ratio (<v>/D) versus relative position in the cell for MS2-mRNA complexes in untreated, spherical (A22) (N = 3207 trajectories), and gyrase-inhibited cells (novobiocin) (N = 643). (B) Mean diffusion coefficient of MS2-mRNA complexes at the old pole and at all positions in untreated cells, in ATP-depleted (azide) (N = 163), DNA-damaged (UV) (N = 338), gyrase-inhibited (novobiocin) (N = 643), transcription-inhibited (rifampicin) (N = 195), and spherical cells (A22) (N = 3207). To see this figure in color, go online.
The A22 treatment leads to large-scale changes in cellular structure. To more specifically test our hypothesis, we also attempt a more subtle perturbation to the shape and density profile of the nucleoid: we treat the cells with novobiocin, an antibiotic that inhibits DNA-gyrase activity and leads to DNA damage. Extended treatment with novobiocin leads to significant condensation of the nucleoid (Fig. S4). Because the nucleoids of cells treated with novobiocin are shorter with respect to the long axis of the cell, we expect the positions of the peaks in the forcing ratio (located at ±0.3 cell lengths in untreated cells) to shift inward toward midcell, matching the shrinking geometry of the nucleoid. As expected, the forcing ratio of novobiocin treated cells shows inward movement of the peak forces (Fig. 6). In addition, the stable point at midcell is lost in novobiocin treated cells, consistent with the loss of the typical bi-lobed structure of the nucleoid because of extreme condensation.
In general, with the exception of ATP-depletion, we find that most physiological perturbations to the cell, e.g., altered cell shape (A22), DNA-gyrase inhibition (novobiocin), DNA damage (UV radiation), or transcription inhibition (rifampicin), tend to increase the diffusion coefficient of the MS2-mRNA complexes without significantly affecting the qualitative shape of the drift velocity map (Figs. 6 and S5).
Discussion
Our results provide quantitative evidence for both the existence and relevance of forces induced by nucleoid exclusion and membrane confinement on the motion of large molecular complexes in the bacterial cell. Although nucleoid exclusion and confinement have often been invoked to explain the retention of large complexes at the poles, a detailed picture of the dynamics, including the understanding of how complexes move to the poles, has never been described from a quantitative biophysical perspective.
Exponential step-size distribution
The observation of non-Gaussian step size for the motion of protein complexes in the bacterial cell has recently been reported by Parry et al. as a central argument for identifying the dynamics of the bacterial cytoplasm as glass-like (21). The observation of exponential tails, and more generally non-Gaussian step-size distributions, is rather generic in biology and soft-condensed matter physics (e.g., see (27)). The exponential dependence of the step-size distribution has been explained as a consequence of standard Fickian diffusion with a wide distribution of diffusion coefficients. A number of mechanisms can result in variability in diffusion coefficients, including quenched disorder in the media or transitions between states with different mobility that have lifetimes that are comparable with the lag time of observation (27). The dynamics observed in glasses is one specific example of this more general phenomenology. In the context of the bacterial cytoplasm, it would be natural to assume both mechanisms may contribute to the long tails of the step-size distribution. For instance, we observe in this study that the diffusion coefficient of MS2-mRNA complexes varies as a function of position along the long axis of the cell. Although these effects are typically obscured by cell-to-cell variation, the step-size distribution is explicitly not affected by cell-to-cell averaging.
Unexpectedly high mobility over regions of high nucleoid density
Classic investigations of the effects of molecular crowding on diffusive particles show that diffusion coefficients tend to decrease with increased concentration of the crowding agent (e.g., (28,29).). In our nucleoid-exclusion model (Eq. 8), we proposed that DNA crowds the MS2-mRNA complexes in the vicinity of the nucleoid, reducing both the number of local configurations overlapping the nucleoid (leading to depletion in MS2-mRNA occupancy) and frustrating diffusion by occluding neighboring sites. Therefore, the nucleoid-exclusion model would naively predict both decreased occupancy over the nucleoid as well as a decreased diffusion coefficient. Strikingly, our results show exactly the opposite phenomenology: comparison between the occupancy of MS2-mRNA (Fig. 2 A) and the position dependent diffusion coefficient (Fig. 4 B) reveals that the highest diffusion coefficients are observed in regions with the lowest MS2-mRNA occupancy and the highest nucleoid density.
One attractive hypothesis is that the nucleoid, acting as a crowding agent and depleting MS2-mRNA complexes from the central region of the cell, is also very dynamic, in part because of active processes such as transcription and replication, which can both result in large-scale rearrangements of the nucleoid. In fact, a number of lines of evidence support the central role of the nucleoid in the high MS2-mRNA mobility. For instance, the transcription inhibitor rifampicin is known to affect nucleoid structure, but its dominant effect on MS2-mRNA motion is to significantly increase the diffusion coefficient. Although one might expect transcription inhibition to diminish chromosome mobility, it in fact leads to a significant increase in mobility (20). It has been previously shown that the effect of rifampicin treatment on the mobility of chromosomal loci depends on the length of the treatment (19). Our experimental methods are such that we measure MS2-mRNA diffusion constants on time scales that are in the regime of higher chromosomal mobility due to rifampicin treatment A tight link between MS2-mRNA and chromosome dynamics would therefore account for the large increase in diffusion coefficient and make a key prediction: the increased mobility of MS2-mRNA complexes would be most pronounced over the nucleoid in cells treated with rifampicin. By applying our analysis to rifampicin-treated cells, we do in fact observe nearly a fourfold increase in the diffusion coefficient of MS2-mRNA complexes in regions of highest nucleoid density (Fig. S5 B).
In contrast, many large macromolecular complexes, e.g., ribosomes and protein aggregates, are known to accumulate at the cell poles. Although many processes (including translation) are active at the poles, these processes do not appear to efficiently facilitate MS2-mRNA mobility. It is possible that the presence of large complexes further frustrates the movement of the MS2-mRNA complexes (8). Consistent with this model is the observation that the diffusion coefficient of MS2-mRNA complexes at the old pole is smaller by a factor of two than the diffusion coefficient at the new pole (Fig. 4 B), since it is known that nonfunctional protein aggregates tend to accumulate at the old pole (7). But, despite the lower mobility at the old pole, there is still strong evidence of significant nonthermal contributions to the dynamics at both poles since the mobility is significantly decreased with the depletion of ATP (Fig. 6 B).
Parry et al. also proposed that cellular metabolism fluidizes a glass-like cytoplasm (21). The glass model was invoked because glass-like dynamics, such as cytoplasmic dynamics, are the result of crowding and caging-related phenomena. In particular, Parry et al. reported distinct subpopulations of protein complexes with fast and slow dynamics, in analogy to distinct subpopulations observed in glass forming-liquids (21). In a glass, rapid particle movement is the result of collective motion by neighboring particles, but there is currently no direct evidence for collective motion of this type in the bacterial cytoplasm. Our observations are consistent with the observations of Parry et al. in that we observe trajectories with a wide range of diffusion coefficients, but our spatial analysis of the diffusion coefficient as a function of position in the cell reveals that these subpopulation can be explained, at least in part, by the presence or absence of the nucleoid (Fig. S7). Since Parry et al. reported metabolism-dependent differences in mobility in DNA-free regions, we suspect the proposed metabolism-dependent mechanism must be distinct from the phenomena we report in this paper.
Conclusions
Our observations provide strong quantitative support for two modes of nucleoid action: both for the widely accepted mechanism of nucleoid-exclusion and a newly proposed mode, facilitating rapid complex motion through the cytoplasm. These combined roles of the nucleoid in facilitating the movement of protein complexes has important biological implications and suggests that the nucleoid may play a much more active role in the organization and transport of macromolecules in the bacterial cytoplasm than previously thought.
Acknowledgments
The authors would like to thank I. Golding for the generous gift of strains. The authors would also like to thank H. Kim and I. Backus for early work on this project. This work was supported by the National Science Foundation under grant Nos. NSF-PHY-084845 and NSF-MCB-1151043-CAREER.
Supporting Material
Supporting Citations
Reference (30) appears in the Supporting Material.
References
- 1.Viollier P.H., Thanbichler M., Shapiro L. Rapid and sequential movement of individual chromosomal loci to specific subcellular locations during bacterial DNA replication. Proc. Natl. Acad. Sci. USA. 2004;101:9257–9262. doi: 10.1073/pnas.0402606101. [DOI] [PMC free article] [PubMed] [Google Scholar]
- 2.Wiggins P.A., Cheveralls K.C., Kondev J. Strong intranucleoid interactions organize the Escherichia coli chromosome into a nucleoid filament. Proc. Natl. Acad. Sci. USA. 2010;107:4991–4995. doi: 10.1073/pnas.0912062107. [DOI] [PMC free article] [PubMed] [Google Scholar]
- 3.Maddock J.R., Shapiro L. Polar location of the chemoreceptor complex in the Escherichia coli cell. Science. 1993;259:1717–1723. doi: 10.1126/science.8456299. [DOI] [PubMed] [Google Scholar]
- 4.Lutkenhaus J. Assembly dynamics of the bacterial MinCDE system and spatial regulation of the Z ring. Annu. Rev. Biochem. 2007;76:539–562. doi: 10.1146/annurev.biochem.75.103004.142652. [DOI] [PubMed] [Google Scholar]
- 5.Raskin D.M., de Boer P.A. The MinE ring: an FtsZ-independent cell structure required for selection of the correct division site in E. coli. Cell. 1997;91:685–694. doi: 10.1016/s0092-8674(00)80455-9. [DOI] [PubMed] [Google Scholar]
- 6.Ptacin J.L., Shapiro L. Chromosome architecture is a key element of bacterial cellular organization. Cell. Microbiol. 2013;15:45–52. doi: 10.1111/cmi.12049. [DOI] [PMC free article] [PubMed] [Google Scholar]
- 7.Lindner A.B., Madden R., Taddei F. Asymmetric segregation of protein aggregates is associated with cellular aging and rejuvenation. Proc. Natl. Acad. Sci. USA. 2008;105:3076–3081. doi: 10.1073/pnas.0708931105. [DOI] [PMC free article] [PubMed] [Google Scholar]
- 8.Landgraf D., Okumus B., Paulsson J. Segregation of molecules at cell division reveals native protein localization. Nat. Methods. 2012;9:480–482. doi: 10.1038/nmeth.1955. [DOI] [PMC free article] [PubMed] [Google Scholar]
- 9.Huang K.C., Mukhopadhyay R., Wingreen N.S. A curvature-mediated mechanism for localization of lipids to bacterial poles. PLoS Comp. Bio. 2006;2:e151. doi: 10.1371/journal.pcbi.0020151. [DOI] [PMC free article] [PubMed] [Google Scholar]
- 10.Howard M. A mechanism for polar protein localization in bacteria. J. Mol. Biol. 2004;335:655–663. doi: 10.1016/j.jmb.2003.10.058. [DOI] [PubMed] [Google Scholar]
- 11.Winkler J., Seybert A., Bukau B. Quantitative and spatio-temporal features of protein aggregation in Escherichia coli and consequences on protein quality control and cellular ageing. EMBO J. 2010;29:910–923. doi: 10.1038/emboj.2009.412. [DOI] [PMC free article] [PubMed] [Google Scholar]
- 12.Saberi S., Emberly E. Chromosome driven spatial patterning of proteins in bacteria. PLoS Comp. Bio. 2010;6:e1000986. doi: 10.1371/journal.pcbi.1000986. [DOI] [PMC free article] [PubMed] [Google Scholar]
- 13.Saberi S., Emberly E. Non-equilibrium polar localization of proteins in bacterial cells. PLoS ONE. 2013;8:e64075. doi: 10.1371/journal.pone.0064075. [DOI] [PMC free article] [PubMed] [Google Scholar]
- 14.Sanamrad A., Persson F., Elf J. Single-particle tracking reveals that free ribosomal subunits are not excluded from the Escherichia coli nucleoid. Proc. Natl. Acad. Sci. USA. 2014;111:11413–11418. doi: 10.1073/pnas.1411558111. [DOI] [PMC free article] [PubMed] [Google Scholar]
- 15.Jun S., Wright A. Entropy as the driver of chromosome segregation. Nat. Rev. Microbiol. 2010;8:600–607. doi: 10.1038/nrmicro2391. [DOI] [PMC free article] [PubMed] [Google Scholar]
- 16.Youngren B., Nielsen H.J., Austin S. The multifork Escherichia coli chromosome is a self-duplicating and self-segregating thermodynamic ring polymer. Genes Dev. 2014;28:71–84. doi: 10.1101/gad.231050.113. [DOI] [PMC free article] [PubMed] [Google Scholar]
- 17.Golding I., Cox E.C. RNA dynamics in live Escherichia coli cells. Proc. Natl. Acad. Sci. USA. 2004;101:11310–11315. doi: 10.1073/pnas.0404443101. [DOI] [PMC free article] [PubMed] [Google Scholar]
- 18.Gupta A., Lloyd-Price J., Ribeiro A.S. In vivo kinetics of segregation and polar retention of MS2-GFP-RNA complexes in Escherichia coli. Biophys. J. 2014;106:1928–1937. doi: 10.1016/j.bpj.2014.03.035. [DOI] [PMC free article] [PubMed] [Google Scholar]
- 19.Weber S.C., Spakowitz A.J., Theriot J.A. Bacterial chromosomal loci move subdiffusively through a viscoelastic cytoplasm. Phys. Rev. Lett. 2010;104:238102. doi: 10.1103/PhysRevLett.104.238102. [DOI] [PMC free article] [PubMed] [Google Scholar]
- 20.Coquel A.S., Jacob J.P., Berry H. Localization of protein aggregation in Escherichia coli is governed by diffusion and nucleoid macromolecular crowding effect. PLOS Comput. Biol. 2013;9:e1003038. doi: 10.1371/journal.pcbi.1003038. [DOI] [PMC free article] [PubMed] [Google Scholar]
- 21.Parry B.R., Surovtsev I.V., Jacobs-Wagner C. The bacterial cytoplasm has glass-like properties and is fluidized by metabolic activity. Cell. 2014;156:183–194. doi: 10.1016/j.cell.2013.11.028. [DOI] [PMC free article] [PubMed] [Google Scholar]
- 22.Kuwada N.J., Cheveralls K.C., Wiggins P.A. Mapping the driving forces of chromosome structure and segregation in Escherichia coli. Nucleic Acids Res. 2013;41:7370–7377. doi: 10.1093/nar/gkt468. [DOI] [PMC free article] [PubMed] [Google Scholar]
- 23.Lloyd-Price J., Häkkinen A., Ribeiro A.S. Asymmetric disposal of individual protein aggregates in Escherichia coli, one aggregate at a time. J. Bacteriol. 2012;194:1747–1752. doi: 10.1128/JB.06500-11. [DOI] [PMC free article] [PubMed] [Google Scholar]
- 24.Javer A., Kuwada N.J., Lagomarsino M.C. Persistent super-diffusive motion of Escherichia coli chromosomal loci. Nat. Comm. 2014;5:3854. doi: 10.1038/ncomms4854. [DOI] [PubMed] [Google Scholar]
- 25.Weber S.C., Spakowitz A.J., Theriot J.A. Nonthermal ATP-dependent fluctuations contribute to the in vivo motion of chromosomal loci. Proc. Natl. Acad. Sci. USA. 2012;109:7338–7343. doi: 10.1073/pnas.1119505109. [DOI] [PMC free article] [PubMed] [Google Scholar]
- 26.Gitai Z., Dye N.A., Shapiro L. MreB actin-mediated segregation of a specific region of a bacterial chromosome. Cell. 2005;120:329–341. doi: 10.1016/j.cell.2005.01.007. [DOI] [PubMed] [Google Scholar]
- 27.Wang B., Kuo J., Granick S. When Brownian diffusion is not Gaussian. Nat. Mater. 2012;11:481–485. doi: 10.1038/nmat3308. [DOI] [PubMed] [Google Scholar]
- 28.Phillips R., Kondev J., Garcia H. Garland Science, Taylor & Francis Group; New York, NY: 2009. Physical Biology of the Cell. [Google Scholar]
- 29.Muramatsu N., Minton A.P. Tracer diffusion of globular proteins in concentrated protein solutions. Proc. Natl. Acad. Sci. USA. 1988;85:2984–2988. doi: 10.1073/pnas.85.9.2984. [DOI] [PMC free article] [PubMed] [Google Scholar]
- 30.Weber S.C., Thompson M.A., Theriot J.A. Analytical tools to distinguish the effects of localization error, confinement, and medium elasticity on the velocity autocorrelation function. Biophys. J. 2012;102:2443–2450. doi: 10.1016/j.bpj.2012.03.062. [DOI] [PMC free article] [PubMed] [Google Scholar]
Associated Data
This section collects any data citations, data availability statements, or supplementary materials included in this article.