

Abstract
Activation of the small guanosine triphosphatase H-Ras by the exchange factor Son of Sevenless (SOS) is an important hub for signal transduction. Multiple layers of regulation, through protein and membrane interactions, govern activity of SOS. We characterized the specific activity of individual SOS molecules catalyzing nucleotide exchange in H-Ras. Single-molecule kinetic traces revealed that SOS samples a broad distribution of turnover rates through stochastic fluctuations between distinct, long-lived (more than 100 seconds), functional states. The expected allosteric activation of SOS by Ras–guanosine triphosphate (GTP) was conspicuously absent in the mean rate. However, fluctuations into highly active states were modulated by Ras-GTP. This reveals a mechanism in which functional output may be determined by the dynamical spectrum of rates sampled by a small number of enzymes, rather than the ensemble average.
Cellular membranes organize signal transduction, serving as platforms for protein interactions as well as direct modulators of enzymatic function (1, 2). The activation of lipid-anchored guanosine triphosphatases (GTPases) of the Ras superfamily by cytosolic guanine nucleotide exchange factors (GEFs) represents a broadly important class of membrane-localized signaling reactions. Control of GEF activity is multilayered and involves membrane recruitment, lateral interactions on the membrane surface, as well as allosteric regulation (3, 4). A recurring feature across several Ras, Rho, and Arf GTPase subfamily GEFs is the release of autoinhibition mediated by GTPase and membrane binding. The molecular mechanisms underlying these regulatory couplings remain poorly understood, in large part because of the intrinsic experimental challenge of working within a membrane environment. We reconstituted the inner-leaflet signaling geometry of Son of Sevenless (SOS)–catalyzed nucleotide exchange in H-Ras on supported membranes that were partitioned into arrays of two-dimensional corrals by lithographically defined chromium diffusion barriers. With this system, we monitored the real-time catalytic activity of individual SOS molecules in order to observe the functional mechanisms of allosteric activation and autoinhibition on the membrane surface.
SOS is widely distributed in mammalian cells. In vivo, inactive cytosolic SOS is recruited to the plasma membrane in response to ligand binding by receptors on the cell surface. There, it activates membrane-tethered Ras by catalyzing the exchange of Ras-bound guanosine diphosphate (GDP) with guanosine triphosphate (GTP), which triggers the mitogen-activated protein kinase (MAPK) cascade (5). SOS is activated by Ras-GTP binding to an allosteric site, located between the Cdc25 and Ras exchanger motif (REM) domains in the catalytic core termed SOScat (C) (Fig. 1A) (6). This allosteric activation depends sensitively on the nucleotide state of Ras (7) and contributes an important aspect of SOS biology. Functionally, this is thought to enable SOS to operate as an analog-to-digital converter through a Ras-GTP positive-feedback loop operating at the membrane, such as during T cell activation (8, 9). However, the nucleotide specificity of allosteric activation of the catalytic site remains poorly understood. SOS activation is autoinhibited by its N-terminal Histone fold (H), Dbl homology (DH), and Pleckstrin homology (PH) domains (10). Autoinhibition is thought to occur through steric occlusion of the allosteric site, which can be released by interaction of the PH domain with phosphatidylinositol-4,5-bisphosphate (PIP2) or other negative lipids on the membrane (11, 12). Several SOS mutations, including R552G in the helical linker, lead to weakened autoinhibition, excessive Ras activation, and Noonan Syndrome developmental disorders (13). (Single-letter abbreviations for the amino acid residues are as follows: A, Ala; C, Cys; D, Asp; E, Glu; F, Phe; G, Gly; H, His; I, Ile; K, Lys; L, Leu; M, Met; N, Asn; P, Pro; Q, Gln; R, Arg; S, Ser; T, Thr; V, Val; W, Trp; and Y, Tyr. In themutants, other amino acids were substituted at certain locations; for example, R552G indicates that arginine at position 552 was replaced by glycine.)
Fig. 1. Platform for single-enzyme kinetics.
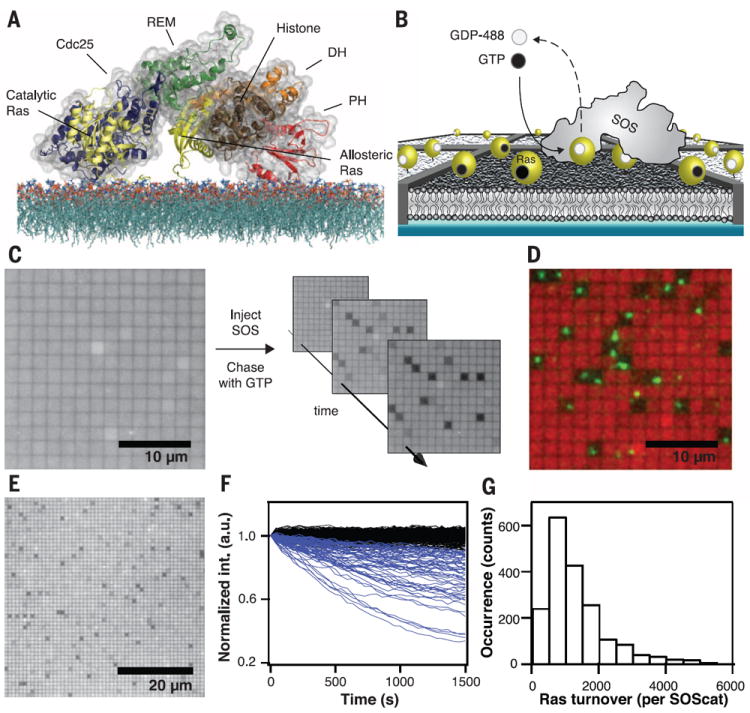
(A) Schematic showing the crystal structure and domain architecture of SOS-HDPC (surface and illustrated rendering) with Ras molecules (yellow, illustrated rendering) modeled onto the allosteric and catalytic sites, facing a lipid bilayer. SOS-HDPC is depicted in a sterically closed and auto-inhibited conformation. The actual on-membrane configuration is expected to be more open. The SOS-HDPC crystal structure, the HVR region of Ras, and the 1-palmitoyl-2-oleoyl-sn-glycero-3-phosphocholine (POPC) bilayer structure are adapted from published works (20). (B) Scheme of the experimental setup. Nanofabricated chromium metal lines (10 nm high and 100 nm wide) partition a supported bilayer into micrometer-scale corrals, each containing lipid-anchored Ras loaded with fluorescent nucleotide at densities from hundreds to approximately a thousand molecules per square micrometer. When a single SOS engages Ras at the allosteric site, the catalytic site is free to turn over the remaining Ras in the corral, replacing fluorescent with nonfluorescent nucleotide and leading to a confined decrease of emission intensity. (C) Wide-field epifluorescence image of fluorescently loaded Ras before injection of SOS (left) shows no initial dark corrals. Injection of a pulse of SOS followed by continuous flow of nonfluorescent nucleotide (right) leads to enzymatic turnover in a subset of corrals. (D) False color overlay of fluorescently loaded Ras emission (red) and TIRFM image of fluorescently labeled SOScat-Atto647N (green) reveals colocalization of dark corrals and single SOScat enzymes. (E) Zoomedout view showing a field of 1 × 1 μm2 corrals with SOS activity. (F) Collection of single-corral kinetic traces from an array of SOScat turning over Ras-GTP, showing the percentage of fluorescent Ras in the corral as a function of time (blue traces). The black traces represent signals from empty corrals without enzymatic activity. (G) Histogram of total Ras-GTP-488 turnovers by individual SOScat enzymes. Scale bars, 10 μm (C) and (D); and 20 μm (E). Lipid composition (in molar percent): Egg-PC/MCC-PE/DOPS/TR-DHPE = 93.99/3/3/0.01.
Most biological and biochemical studies of SOS activity have relied on bulk assays. Physically distinct aspects of SOS regulation, such as membrane recruitment and allosteric modulation of specific catalytic activity, are intrinsically convolved in such observations (supplementary text S1). Furthermore, any stochastic variation among SOS molecules, such as fluctuations between different activity states, is averaged out in the ensemble result. Becausemany signaling processes in cells involve small numbers of molecules, the ability to average over large ensembles is not a benefit that live cell-signaling networks necessarily enjoy (14-17). Stochastic variation itself, rather than ensemble average properties, can be a viable mechanism of regulation (18). To gain a clear understanding of SOS activity and its regulation on membranes will require direct observations of individual SOS molecules functioning in a membrane environment.
Single-molecule SOS activity assay
We developed an assay platform to observe realtime single-molecule activity of SOS with Ras in a partitioned, supported membrane (Fig. 1B). H-Ras(C118S, 1 to 181) (referred to as Ras from here on) was linked to the membrane through maleimide coupling of Cys181 to supported lipid bilayers (SLBs), resulting in stably bound, laterally mobile Ras that is fully functional with respect to SOS activation (19, 20). We also used an H-Ras construct truncated at Cys184 [H-Ras (C118S, 1 to 184)], which contains both native cysteine palmitoylation sites (181 and 184) in the hypervariable region (HVR), which we linked to lipids through maleimide chemistry. Membranes were composed primarily of l-α-phosphatidylcholine (Egg, Chicken) (Egg-PC) with 2 to 3% anionic 1,2-dioleoyl-sn-glycero-3-phospho-l-serine lipids (DOPS) and in some cases PIP2, which bind the PH domain on SOS and release autoinhibition (19). Molecules within the supported membrane were confined in micrometer-scale corrals by lithographically defined barriers to lateral mobility, prefabricated onto the underlying substrate (21). The barriers trapped membrane-tethered Ras and SOS (through its interactions with Ras and membrane lipids) within individual corrals. In each corral, the membrane remained entirely fluid, thus permitting SOS and Ras to diffuse freely while SOS processively catalyzed nucleotide exchange. Ras surface density was calibrated with fluorescence correlation spectroscopy (FCS) (22) and subsequently measured in each corral by means of epifluorescence imaging (fig. S1). Ras surface densities in these experiments ranged from several hundred to 1000 Ras molecules per square micrometer, corresponding to the broad Ras density range measured in vivo (8, 19). Measurement of Ras lateral mobility with FCS and fluorescence recovery after photobleaching (FRAP) (fig. S2) ensured that fluid bilayers were partitioned by leak-free corrals.
SOS was introduced into the system from solution in a transient pulse traveling through the flow cell. We examined several SOS constructs derived from a truncated SOS containing the H, DH, PH, and C domains but lacking the C-terminal Grb2 binding domain (SOS-HDPC). SOS binds to Ras on the membrane surface and, in the absence of free nucleotide, becomes trapped (3). After free SOS was rinsed from the system, unlabeled nucleotide was flowed in, and the exchange reaction commenced. By loading Ras with Atto488-labeled fluorescent nucleotide 2′/3′-O-(2-aminoethyl-carbamoyl)-guanosine-5′-diphosphate or -[(β,γ)-imido]triphosphate (Atto488-EDA-GDP or Atto488-EDA-GppNp, respectively; referred to as GDP-488 and GTP-488, respectively, from here on), catalytic exchange with nonfluorescent nucleotide from solution (GDP or GTP) could be directly observed as a local, corral-confined decrease of surface fluorescence. Constant flow during the exchange reaction ensured removal of unbound fluorescent nucleotides, allowing the reaction kinetics to be recorded by means of wide-field imaging of the fluorescence decay. Fluorescent and nonhydrolysable nucleotide analogs did not substantially perturb SOS activity (20).
Representative images taken during SOScatcatalyzed turnover showed a small percentage of active corrals (those with a SOS molecule) undergoing nucleotide exchange. These develop a clear negative contrast relative to inactive corrals (those without a SOS molecule) (Fig. 1C and movie S1). In all experiments, SOS concentrations were adjusted so that >95% of active corrals contained exactly one enzyme (fig. S3) (20). Total internal reflection fluorescence microscopy (TIRFM) of Atto647N-labeled SOScat (SOScat-647) revealed a clear correspondence between active dark corrals and individually confined SOScat enzymes (Fig. 1D and movie S2), which were laterally mobile within corrals (fig. S4) (20). However, it was not necessary to label SOS to run the assay. By imaging arrays of corrals on the surface, the exchange reactions of hundreds of individually confined enzymes were monitored in parallel (Fig. 1E). Quantitative analysis of fluorescence decays (fig. S5) (20) allowed individual kinetic traces of SOS activity to be analyzed (Fig. 1F). The total number of molecules tracked in an experimental run was similar to that in some bulk experiments (19), except that the individual contribution of every single molecule was observed.
SOScat enzymes were highly processive on the membrane surface. Hundreds to several thousand Ras could be activated by one SOScat molecule during a single membrane residency period (Fig. 1G). Comparable results for SOS activity were observed with both the single- (C118S, 1 to 181) and double-anchored (C118S, 1 to 184) Ras constructs (fig. S6). Because SOScat lacks any of the other membrane binding domains, this confirms that Ras alone is sufficient to stably recruit SOS to the membrane. A W729E point mutation in SOScat that abolishes Ras binding in the allosteric pocket (10, 19) inhibited processive activity (fig. S7). Bivalent interaction with Ras through both the catalytic and allosteric sites was required for sustained membrane localization of SOScat.
Dynamic heterogeneity of SOS activity
Kinetic traces of nucleotide exchange from individual SOS molecules revealed discrete transitions between well-defined catalytic states. Traces from two representative SOS molecules, each in its own corral, are plotted in Fig. 2A (more traces are provided in fig. S8). One molecule ran for more than 1200 s with a single catalytic rate (1.1 molecules/s). The other molecule shown started out with a similar rate, abruptly changed to 4 molecules/s at ~400 s, then abruptly changed back after another ~500 s. Using a change point algorithm (20, 23) to detect transitions revealed such events in 30% of traces for SOScat turning over Ras-GDP (fig. S9). Changes in turnover rate were not associated with changes in lateral diffusion of SOS (fig. S10). Because the transitions were discrete and the individual states exhibited well-defined kinetic rates, we suggest that these are the result of transitions between different stable configurations of the protein complex itself (SOScat with Ras bound in its allosteric site). Such conformational fluctuations have been traditionally observed on the microsecond to millisecond time scale (24-26), but longer-lived dynamic conformers exist in proteins (27), extending well into the minute time scale (supplementary text S2).
Fig. 2. Allosteric autoinhibition by N-terminal domains of SOS.
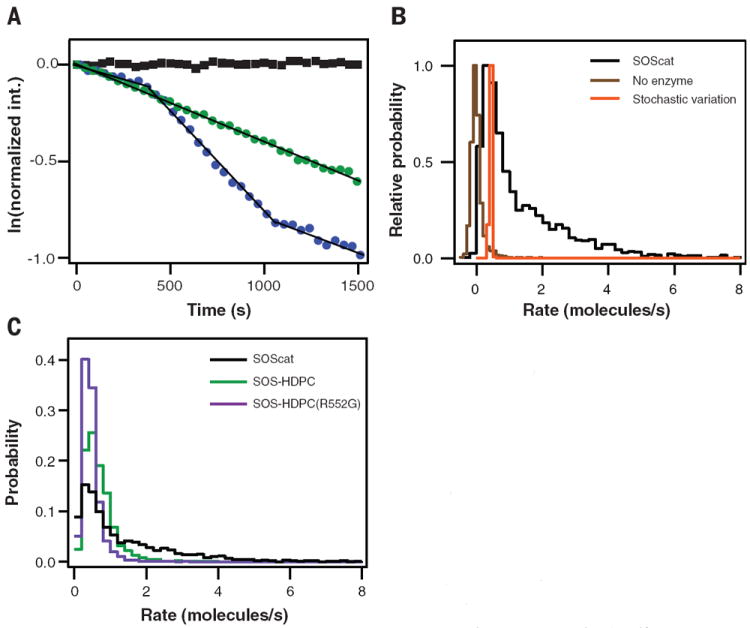
(A) Logarithmic plots of single-enzyme kinetic traces. Discrete activity levels of SOScat are identified as linear segments. Some SOScat enzymes remain in a single functional state throughout the reaction (straight trace, green), whereas others fluctuate between different states (kinked trace, blue). The black trace (square) represents corral that does not undergo SOScat-catalyzed turnovers. (B) Normalized and lifetime-weighted probability distributions of catalytic rates sampled by (i) the SOScat ensemble (black), (ii) corrals without enzyme (brown), and (iii) modeled single-state enzyme stochastic variation (orange). (C) Catalytic rate probability distributions from SOScat (black), SOS-HDPC (green), and SOS-HDPC (R552G) (purple). The N-terminal domains auto-inhibit SOS specific activity. A Noonan syndrome– associated point mutation in SOS-HDPC(R552G) (purple) does not relieve inhibition. Lipid composition (in molar percent): Egg-PC/MCC-PE/DOPS/TR-DHPE = 93.99/3/3/0.01.
By identifying individual functional substates, we constructed the lifetime-weighted probability histogram of distinct catalytic rates sampled by hundreds of SOScat enzymes (Fig. 2B) (20). The histogram spans almost 2 orders of magnitude, with a broad peak at ~1 s−1 and a wide shoulder and tail of sparsely populated states extending toward higher rates. The histogram of apparent rates from inactive corrals, arising from intrinsic nucleotide release and photobleaching, represents the limit of resolution in this experiment (20). Even in a single catalytic state, stochastic variation resulting from the discrete nucleotide exchange events will lead to a real distribution of turnover rates over time and between enzymes. We estimated this intrinsic stochastic noise through simulations of a one-state system (supplementary text S3 and fig. S11). The overall distribution of SOScat turnover rates is much broader than either the experimental or intrinsic stochastic noise limits. However, it is likely that the assay does not resolve individual state peaks, giving instead the appearance of a broad continuous distribution.
SOS regulation through intradomain interaction
A key finding comes from a comparison of rate histograms for SOScat and SOS-HDPC (Fig. 2C and fig. S12). The N-terminal H, DH, and PH domains have a pronounced effect on the distribution of rates sampled by SOS. Whereas the peak of the rate distribution for SOS-HDPC overlaps with that of SOScat, the extended tail of molecules with faster rates is strongly suppressed, resulting in a sharper histogram. The N-terminal domains also dampen the frequency with which state transitions occur, dropping to 10% of kinetic traces with transitions for SOSHDPC (fig. S9). These observations were made under conditions in which autoinhibition was previously thought to be released by interactions between the PH domain and anionic lipids (PS or PIP2 in these experiments) (10, 19, 28). However, we observed that the N-terminal domains still influence SOS activity by allosterically suppressing fluctuations that populate multiple high-activity states, which is consistent with a mechanism of conformational selection (supplementary text S2) (29-31). This represents a previously unknown layer of SOS regulation and emphasizes that not just the allosteric site, but also the N-terminal domains, communicate directly with the catalytic site.
The Noonan syndrome associated R552G SOS mutation leads to excessive activation of Ras in vivo (13) and increases the apparent rate of catalysis in bulk assays, but only when membranes are present (19). In vesicle assays, Ras activation is monitored as a function of the total amount of SOS in the system, but the fraction of SOS actually recruited to the membrane is unknown. The singlemolecule rate histogram for SOS-HDPC(R552G) shows that the R552G mutation is not activating at the level of SOS specific activity (Fig. 2C) and results in a similar low-fluctuation frequency as seen for SOS-HDPC (fig. S9). Taken together with this observation, the accelerated turnover of Ras-GTP by SOS-HDPC(R552G) reported from vesicle assays (19) is likely to be a result of increased surface binding from solution. Abnormally high membrane recruitment of SOS-HDPC(R552G) may contribute to the pathogenic hyperactivation of Ras signaling in vivo as well.
Allosteric regulation of SOS
A second key observation is that the expected activation of SOS by Ras-GTP bound in its allosteric site is surprisingly weak over most of the range of the observed distribution of rates. Rate histograms for SOScat, SOS-HDPC, and SOSHDPC(R552G) are shown in Fig. 3, A, B, and C, respectively. Although small differences in the distributions and most probable rates do exist, it is unlikely that these minor effects would be consequential in the context of a living cell. Some cellular signaling processes can be triggered by as little as a few individual ligand-receptor interactions (15-17). In such cases, only a small number of SOS molecules are likely to be involved as well. Variation of the ensemble mean (stochastic noise) becomes large when sample sizes become small, and thus, small differences in the mean rates become obscured in stochastic noise (supplementary text S4 and fig. S13).
Fig. 3. Nucleotide specificity of allosteric activation of SOS.

(A to C) The nucleotide-dependent rate distributions for (A) SOScat, (B) SOS-HDPC, and (C) SOS-HDPC(R552G) on a logarithmic scale. For all constructs, Ras-GTP bound in the allosteric site of SOS (blue traces) has a small activating effect relative to Ras-GDP in the allosteric site (red traces). (D to F) Scatterplots of SOS turnover rate as a function of Ras surface density for (D) SOScat, (E) SOS-HDPC, and (F) SOS-HDPC(R552G). Each point in the scatterplots represents an observed catalytic state, and the area of the point represents the number of Ras turned over by that catalytic state. For all constructs, Ras-GTP bound in the allosteric site of SOS (blue points) results in longer-lived high-activity states capable of highly processive catalysis. Lipid composition (in molar percent): Egg-PC/MCC-PE/DOPS/TR-DHPE = 93.99/3/3/0.01.
However, the dynamics of SOS fluctuations do exhibit differences, depending on whether Ras-GTP or Ras-GDP is bound in the allosteric site. Whereas SOS accesses the rare, highly active states in either case, individual molecules linger for longer periods in these active states when interacting allosterically with Ras-GTP. This is made vivid if we examine the total Ras activation by individual SOS molecules. In Fig. 3, D, E, and F, each observed catalytic state is plotted on the basis of its specific activity and the Ras surface density on which it was observed. The total Ras turnover, equivalent to the number of Ras molecules activated by this particular SOS molecule while in this state, is represented by the size of the mark. Ras-GTP allosterically promotes high-activity long-lived states at the expense of low-activity shorter-lived states (figs. S14 and S15). In cells, these highly active individual molecules would produce all of the Ras they activate in the same location (supplementary text S5) and over a short time. This is especially consequential in a signaling context, in which GTPase-activating proteins (GAPs) catalyze the hydrolysis of GTP to GDP, thus inactivating Ras at a basal level. The effects of such GAP activity would render small bursts of Ras activation inconsequential but may not keep pace with the highly active molecules. In such a situation, the average activity of the entire SOS ensemble is relatively unimportant because the rare, highly active individuals dominate the overall system behavior. Furthermore, the important functional consequences of feedback regulation of SOS by Ras-GTP observed in computer simulations and cellular experiments (8) could well be mediated by the long-lived active states that allosteric regulation by Ras-GTP enables but that by Ras-GDP does not. Ras reportedly forms dimers on membrane surfaces (32). Such dimers could potentially affect SOS activity and, depending on the two-dimensional dimerization affinity on membrane surfaces, could contribute to the mild Ras density–dependence of SOS activity seen in Fig. 3D.
Effect of fluctuation dynamics on the signaling network
To explore the general feasibility of rate fluctuations that provide a mechanism of allosteric regulation, we conducted a series of stochastic simulations, beginning with a simple enzymatic system that does not account for feedback regulation (Fig. 4, A and B). The simple system demonstrates the functional importance of rate fluctuations and the existence of long-lived active states. We consider a substrate, S, that is converted to its active state, S*, by an enzyme E, which can sample different possible states of activity (supplementary text S6 and fig. S16). A deactivating enzyme (analog of RasGAP) can convert S* to S. We first carried out Gillespie simulations (33) with single enzymes, with different trajectories corresponding to different choices of the enzyme activity and switching rates. In one set of trajectories, the enzymes were allowed to sample only low-activity states (allosteric Ras-GDP–bound SOS), whereas in another set, an additional highly active state was sampled (allosteric Ras-GTP); in another set of simulations, the enzymes sampled identical enzymatic rate distributions but transitioned between catalytic states at different rates. Our simulations demonstrate that placing additional weight in the highly active tail of the distribution or having enzymes with long-lived states can lead to fast threshold-crossing by a subset of the enzymes, whereas a collection of enzymes all operating at an increased but average catalytic rate are unable to support activation (Fig. 4A). We also made simulations in which the rates of a number of enzymes in a single reaction group [such as a cell or a localized membrane signaling cluster (34)] were chosen from the same distribution, but their rates of switching between states were different. Histograms of simulation results for many such reaction groups showed that for small numbers of enzymes (analog of weak stimulation), slower switching rates can enable some groups to become activated, whereas activity at the average rate would not (Fig. 4B).
Fig. 4. Modeling effects of stochastic transitions between long-lived enzymatic states by using a minimal signaling model or broader network model.
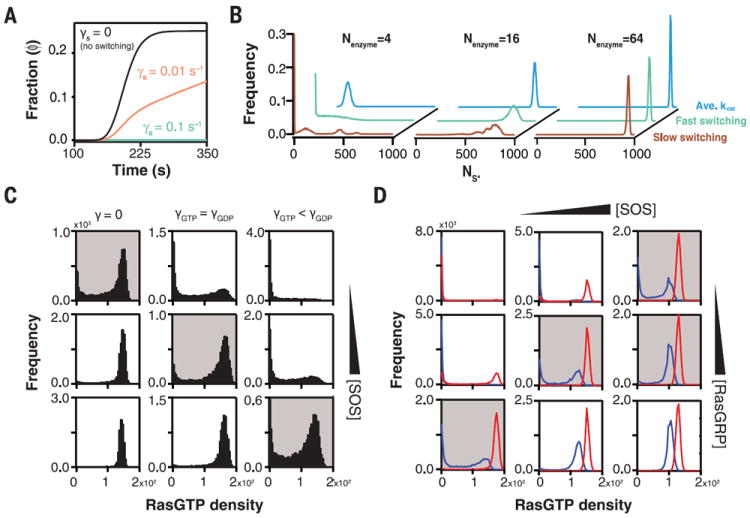
(A) Fraction of trajectories (ϕ) reaching a threshold amount (NS*) of product S* during activation by single GEF-like enzymes fluctuating with switching frequencies (γS). GAP-like enzymes simultaneously deactivate S* to S at a fixed rate. The ensembles of enzymes represented by the three traces have identical mean activity levels and differ only in the rate with which enzymes fluctuate between activity states (details of the model are provided in supplementary text S6). Enzymes with a fast switching rate (green trace) do not reach the signaling threshold, whereas enzymes with a lower switching rate (orange trace) do. Enzymes that do not switch between states on the time scale of the simulation show the most rapid activation and threshold crossing. Additionally, no threshold crossing is observed for static enzymes operating at the average catalytic rate. (B) Probability distributions of (NS*) for various ensemble sizes (Nenzyme = 4, 16, or 64), with slow switching (brown trace, γS = 10−3), fast switching (green trace, γS = 10−1), or enzymes operating only at the average catalytic rate (blue trace). In all cases, the average catalytic rate is the same. At low (4) and intermediate (16) copy number, the activation pattern depends strongly on the switching rate. At low copy number, slow switching gives rise to a population of highly activating enzymes (resulting in more than 400 S*). (C) Distributions of Ras-GTP resulting from coarse-grained modeling of the Ras-SOS signaling network (details of the model are provided in supplementary text S7). Each histogram contains 8000 modeled cells. Left column shows simulations without catalytic rate fluctuations, γS = 0. Middle column shows simulations with catalytic rate fluctuations for which the switching rate of SOS with Ras-GTP or Ras-GDP allosterically bound is the same: γGTP = γGDP. Right column shows simulations in which SOS with Ras-GTP allosterically bound switches more slowly than did SOS with Ras-GDP allosterically bound: γGTP < γGDP. For each switching condition, the Ras-GTP distribution is plotted for increasing cellular levels of SOS. (D) Distributions of Ras-GTP resulting from static SOS (red traces) or fluctuating SOS (blue traces). The histograms span a matrix of cellular levels of the two RasGEFs SOS and RasGRP. Conditions in which only fluctuating SOS gives rise to a bimodal Ras-GTP distribution are shaded gray.
We also investigated a coarse-grained model of lymphocyte SOS signaling, which has been used to interpret bimodal early signaling events in lymphocytes (supplementary text S7) (8). This model includes feedback regulation through Ras-GTP and the interplay between SOS and the RasGEF Ras guanyl nucleotide-releasing protein (RasGRP), as well as the signal attenuation through GAP activity (8). The resulting histograms of cellular Ras-GTP levels are shown in Fig. 4C, each containing thousands of simulated cells. The existence of stochastic activity fluctuations between long-lived states in the simulated SOS-like GEF shifted the regime of bimodal Ras-GTP signaling (gray-shaded histograms) and broadened the ability of the network to exhibit bistability. This effect propagated through the network as a whole. Bimodality resulting from static SOS (Fig. 4D, red lines) or fluctuating SOS (Fig. 4D, blue lines) differed across the SOS and RasGRP concentration matrix (Fig. 4D). Gray-shaded histograms highlight regions of the parameter space where only fluctuating SOS enzymes gave rise to bimodal Ras-GTP distributions, illustrating how the threshold of the overall signaling network is fine-tuned by stochastic rate fluctuations of a single constituent enzyme—in this case, SOS. Various models have been advanced to explain how Ras-GTP (35, 36) and other cellular signals (37, 38) are spatiotemporally shaped to process information, for example, for analog or digital response to stimuli. Stochastic rate fluctuations, as reported here for SOS, constitute another mechanism for tuning cellular signaling dynamics (39).
Dynamic heterogeneity has been reported for multiple enzymes (40-42). However, the duration of dynamic SOS states we observed [several minutes (Fig. 3B)] is longer than that reported for other enzyme systems [up to tens of seconds (41, 42)]. The SOScat fluctuation behavior shows that dynamic conformational modes in signaling enzymes may extend well into time scales comparable with receptor signaling processes (37, 39). Evolutionary pressure is required to evolve and maintain increased enzymatic efficiency (43), so high-activity states are likely to be biologically important. SOS is the key enzyme involved in bimodal switching of Ras-GTP levels during T cell receptor–triggering in T cells (8, 44). It is certainly possible that rare high-activity states could function in threshold-crossing and bistability, leading to robust Ras-GTP positivefeedback activation of SOS and robust response to antigen.
More fundamentally, we developed a singlemolecule enzymatic assay that enables detailed observation of the activation of membrane-linked GTPases by GEFs. This system is generalizable to a broad class of such interactions. We anticipate that fluctuations and distributions of rates may well prove to be just as important, if not more so, than ensemble averages in the behavior of cellular signaling networks. The single-molecule membrane surface assays introduced here render such phenomena accessible to quantitative experimental investigation.
Supplementary Material
Acknowledgments
Major support was provided by NIH P01 AI091580. Additional support was provided by the Danish Council for Independent Research, Natural Sciences (L.I., S.M.C., and D.S.), by the Mechanobiology Institute, National University of Singapore (C.-H.Y. and J.T.G.), and by the Berkeley Education Alliance for Research in Singapore (J.T.G.). L.I., H.-L.T., W.-C.L., and J.T.G. planned and designed the research; H.-L.T. and L.I. performed experiments and analyzed data; S.M.C. and W.-C.L. assisted with experiments; H.-L.T., S.M.C., and H.-J.W. developed algorithms for data analysis; H.-L.T., S.M.A., and P.T. performed stochastic simulations; J.I., J.G., and S.D.H. prepared proteins; C.-H.Y., C.R., and R.S.P. prepared patterned substrates; L.I., H.-L.T., and J.T.G. wrote the manuscript; J.T.G. supervised the project. All authors commented on the manuscript.
Footnotes
SUPPLEMENTARY MATERIALS
www.sciencemag.org/content/345/6192/50/suppl/DC1
Materials and Methods
Figs. S1 to S18
Tables S1 to S4
References (45–69)
Movies S1 and S2
REFERENCES AND NOTES
- 1.Groves JT, Kuriyan J. Nat Struct Mol Biol. 2010;17:659–665. doi: 10.1038/nsmb.1844. [DOI] [PMC free article] [PubMed] [Google Scholar]
- 2.Scott JD, Pawson T. Science. 2009;326:1220–1224. doi: 10.1126/science.1175668. [DOI] [PMC free article] [PubMed] [Google Scholar]
- 3.Bos JL, Rehmann H, Wittinghofer A. Cell. 2007;129:865–877. doi: 10.1016/j.cell.2007.05.018. [DOI] [PubMed] [Google Scholar]
- 4.Cherfils J, Zeghouf M. Physiol Rev. 2013;93:269–309. doi: 10.1152/physrev.00003.2012. [DOI] [PubMed] [Google Scholar]
- 5.Mor A, Philips MR. Annu Rev Immunol. 2006;24:771–800. doi: 10.1146/annurev.immunol.24.021605.090723. [DOI] [PubMed] [Google Scholar]
- 6.Margarit SM, et al. Cell. 2003;112:685–695. doi: 10.1016/s0092-8674(03)00149-1. [DOI] [PubMed] [Google Scholar]
- 7.Boykevisch S, et al. Curr Biol. 2006;16:2173–2179. doi: 10.1016/j.cub.2006.09.033. [DOI] [PubMed] [Google Scholar]
- 8.Das J, et al. Cell. 2009;136:337–351. doi: 10.1016/j.cell.2008.11.051. [DOI] [PMC free article] [PubMed] [Google Scholar]
- 9.Jun JE, Rubio I, Roose JP. Front Immunol. 2013;4:239. doi: 10.3389/fimmu.2013.00239. [DOI] [PMC free article] [PubMed] [Google Scholar]
- 10.Sondermann H, et al. Cell. 2004;119:393–405. doi: 10.1016/j.cell.2004.10.005. [DOI] [PubMed] [Google Scholar]
- 11.Yadav KK, Bar-Sagi D. Proc Natl Acad Sci U S A. 2010;107:3436–3440. doi: 10.1073/pnas.0914315107. [DOI] [PMC free article] [PubMed] [Google Scholar]
- 12.Gureasko J, et al. Proc Natl Acad Sci U S A. 2010;107:3430–3435. doi: 10.1073/pnas.0913915107. [DOI] [PMC free article] [PubMed] [Google Scholar]
- 13.Tartaglia M, et al. Nat Genet. 2007;39:75–79. doi: 10.1038/ng1939. [DOI] [PubMed] [Google Scholar]
- 14.Korobkova E, Emonet T, Vilar JM, Shimizu TS, Cluzel P. Nature. 2004;428:574–578. doi: 10.1038/nature02404. [DOI] [PubMed] [Google Scholar]
- 15.Irvine DJ, Purbhoo MA, Krogsgaard M, Davis MM. Nature. 2002;419:845–849. doi: 10.1038/nature01076. [DOI] [PubMed] [Google Scholar]
- 16.Manz BN, Jackson BL, Petit RS, Dustin ML, Groves J. Proc Natl Acad Sci U S A. 2011;108:9089–9094. doi: 10.1073/pnas.1018771108. [DOI] [PMC free article] [PubMed] [Google Scholar]
- 17.O’Donoghue GP, Pielak RM, Smoligovets AA, Lin JJ, Groves JT. eLife. 2013;2:e00778. doi: 10.7554/eLife.00778. [DOI] [PMC free article] [PubMed] [Google Scholar]
- 18.Choi PJ, Cai L, Frieda K, Xie XS. Science. 2008;322:442–446. doi: 10.1126/science.1161427. [DOI] [PMC free article] [PubMed] [Google Scholar]
- 19.Gureasko J, et al. Nat Struct Mol Biol. 2008;15:452–461. doi: 10.1038/nsmb.1418. [DOI] [PMC free article] [PubMed] [Google Scholar]
- 20.Materials and methods are available as supplementary materials on Science Online.
- 21.Groves JT, Ulman N, Boxer SG. Science. 1997;275:651–653. doi: 10.1126/science.275.5300.651. [DOI] [PubMed] [Google Scholar]
- 22.Groves JT, Parthasarathy R, Forstner MB. Annu Rev Biomed Eng. 2008;10:311–338. doi: 10.1146/annurev.bioeng.10.061807.160431. [DOI] [PubMed] [Google Scholar]
- 23.Ensign DL, Pande VS. J Phys Chem B. 2010;114:280–292. doi: 10.1021/jp906786b. [DOI] [PubMed] [Google Scholar]
- 24.Boehr DD, Nussinov R, Wright PE. Nat Chem Biol. 2009;5:789–796. doi: 10.1038/nchembio.232. [DOI] [PMC free article] [PubMed] [Google Scholar]
- 25.Henzler-Wildman K, Kern D. Nature. 2007;450:964–972. doi: 10.1038/nature06522. [DOI] [PubMed] [Google Scholar]
- 26.Henzler-Wildman KA, et al. Nature. 2007;450:913–916. doi: 10.1038/nature06407. [DOI] [PubMed] [Google Scholar]
- 27.Min W, Luo G, Cherayil BJ, Kou SC, Xie XS. Phys Rev Lett. 2005;94:198302. doi: 10.1103/PhysRevLett.94.198302. [DOI] [PubMed] [Google Scholar]
- 28.Zhao C, Du G, Skowronek K, Frohman MA, Bar-Sagi D. Nat Cell Biol. 2007;9:706–712. doi: 10.1038/ncb1594. [DOI] [PubMed] [Google Scholar]
- 29.del Sol A, Tsai CJ, Ma B, Nussinov R. Structure. 2009;17:1042–1050. doi: 10.1016/j.str.2009.06.008. [DOI] [PMC free article] [PubMed] [Google Scholar]
- 30.Changeux JP. Annu Rev Biophys. 2012;41:103–133. doi: 10.1146/annurev-biophys-050511-102222. [DOI] [PubMed] [Google Scholar]
- 31.Csermely P, Palotai R, Nussinov R. Trends Biochem Sci. 2010;35:539–546. doi: 10.1016/j.tibs.2010.04.009. [DOI] [PMC free article] [PubMed] [Google Scholar]
- 32.Güldenhaupt J, et al. Biophys J. 2012;103:1585–1593. doi: 10.1016/j.bpj.2012.08.043. [DOI] [PMC free article] [PubMed] [Google Scholar]
- 33.Gillespie DT. J Comput Phys. 1976;22:403–434. [Google Scholar]
- 34.Hartman NC, Groves JT. Curr Opin Cell Biol. 2011;23:370–376. doi: 10.1016/j.ceb.2011.05.003. [DOI] [PMC free article] [PubMed] [Google Scholar]
- 35.Harding AS, Hancock JF. Trends Cell Biol. 2008;18:364–371. doi: 10.1016/j.tcb.2008.05.006. [DOI] [PMC free article] [PubMed] [Google Scholar]
- 36.Kholodenko BN, Hancock JF, Kolch W. Nat Rev Mol Cell Biol. 2010;11:414–426. doi: 10.1038/nrm2901. [DOI] [PMC free article] [PubMed] [Google Scholar]
- 37.Wu H. Cell. 2013;153:287–292. doi: 10.1016/j.cell.2013.03.013. [DOI] [PMC free article] [PubMed] [Google Scholar]
- 38.Grecco HE, Schmick M, Bastiaens PI. Cell. 2011;144:897–909. doi: 10.1016/j.cell.2011.01.029. [DOI] [PubMed] [Google Scholar]
- 39.Purvis JE, Lahav G. Cell. 2013;152:945–956. doi: 10.1016/j.cell.2013.02.005. [DOI] [PMC free article] [PubMed] [Google Scholar]
- 40.Lu HP, Xun L, Xie XS. Science. 1998;282:1877–1882. doi: 10.1126/science.282.5395.1877. [DOI] [PubMed] [Google Scholar]
- 41.English BP, et al. Nat Chem Biol. 2006;2:87–94. doi: 10.1038/nchembio759. [DOI] [PubMed] [Google Scholar]
- 42.Prakash MK, Marcus RA. Proc Natl Acad Sci U S A. 2007;104:15982–15987. doi: 10.1073/pnas.0707859104. [DOI] [PMC free article] [PubMed] [Google Scholar]
- 43.Albery WJ, Knowles JR. Biochemistry. 1976;15:5631–5640. doi: 10.1021/bi00670a032. [DOI] [PubMed] [Google Scholar]
- 44.Roose JP, Mollenauer M, Ho M, Kurosaki T, Weiss A. Mol Cell Biol. 2007;27:2732–2745. doi: 10.1128/MCB.01882-06. [DOI] [PMC free article] [PubMed] [Google Scholar]
Associated Data
This section collects any data citations, data availability statements, or supplementary materials included in this article.