
Fig. 1. Platform for single-enzyme kinetics.
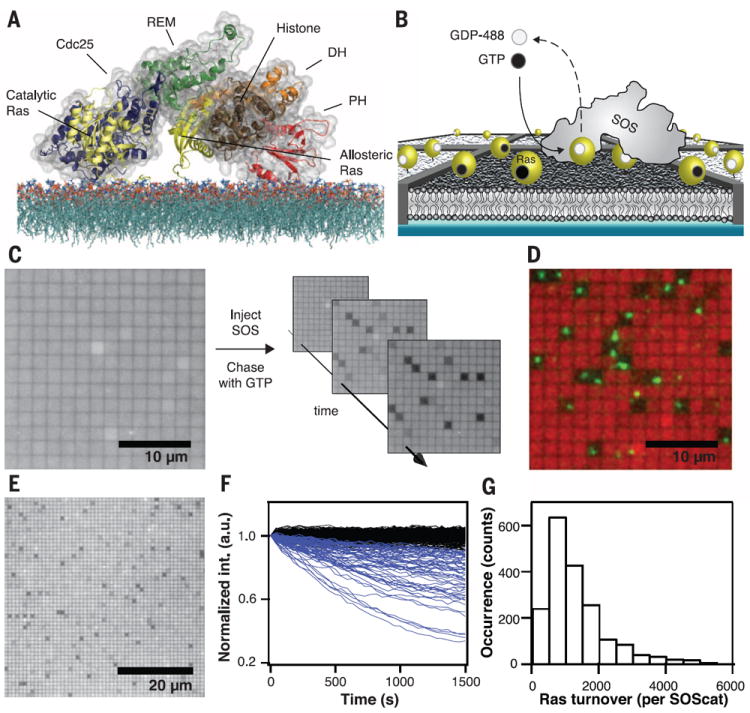
(A) Schematic showing the crystal structure and domain architecture of SOS-HDPC (surface and illustrated rendering) with Ras molecules (yellow, illustrated rendering) modeled onto the allosteric and catalytic sites, facing a lipid bilayer. SOS-HDPC is depicted in a sterically closed and auto-inhibited conformation. The actual on-membrane configuration is expected to be more open. The SOS-HDPC crystal structure, the HVR region of Ras, and the 1-palmitoyl-2-oleoyl-sn-glycero-3-phosphocholine (POPC) bilayer structure are adapted from published works (20). (B) Scheme of the experimental setup. Nanofabricated chromium metal lines (10 nm high and 100 nm wide) partition a supported bilayer into micrometer-scale corrals, each containing lipid-anchored Ras loaded with fluorescent nucleotide at densities from hundreds to approximately a thousand molecules per square micrometer. When a single SOS engages Ras at the allosteric site, the catalytic site is free to turn over the remaining Ras in the corral, replacing fluorescent with nonfluorescent nucleotide and leading to a confined decrease of emission intensity. (C) Wide-field epifluorescence image of fluorescently loaded Ras before injection of SOS (left) shows no initial dark corrals. Injection of a pulse of SOS followed by continuous flow of nonfluorescent nucleotide (right) leads to enzymatic turnover in a subset of corrals. (D) False color overlay of fluorescently loaded Ras emission (red) and TIRFM image of fluorescently labeled SOScat-Atto647N (green) reveals colocalization of dark corrals and single SOScat enzymes. (E) Zoomedout view showing a field of 1 × 1 μm2 corrals with SOS activity. (F) Collection of single-corral kinetic traces from an array of SOScat turning over Ras-GTP, showing the percentage of fluorescent Ras in the corral as a function of time (blue traces). The black traces represent signals from empty corrals without enzymatic activity. (G) Histogram of total Ras-GTP-488 turnovers by individual SOScat enzymes. Scale bars, 10 μm (C) and (D); and 20 μm (E). Lipid composition (in molar percent): Egg-PC/MCC-PE/DOPS/TR-DHPE = 93.99/3/3/0.01.