

Abstract
Objective
To estimate the burden of diarrhoeal diseases from exposure to inadequate water, sanitation and hand hygiene in low- and middle-income settings and provide an overview of the impact on other diseases.
Methods
For estimating the impact of water, sanitation and hygiene on diarrhoea, we selected exposure levels with both sufficient global exposure data and a matching exposure-risk relationship. Global exposure data were estimated for the year 2012, and risk estimates were taken from the most recent systematic analyses. We estimated attributable deaths and disability-adjusted life years (DALYs) by country, age and sex for inadequate water, sanitation and hand hygiene separately, and as a cluster of risk factors. Uncertainty estimates were computed on the basis of uncertainty surrounding exposure estimates and relative risks.
Results
In 2012, 502 000 diarrhoea deaths were estimated to be caused by inadequate drinking water and 280 000 deaths by inadequate sanitation. The most likely estimate of disease burden from inadequate hand hygiene amounts to 297 000 deaths. In total, 842 000 diarrhoea deaths are estimated to be caused by this cluster of risk factors, which amounts to 1.5% of the total disease burden and 58% of diarrhoeal diseases. In children under 5 years old, 361 000 deaths could be prevented, representing 5.5% of deaths in that age group.
Conclusions
This estimate confirms the importance of improving water and sanitation in low- and middle-income settings for the prevention of diarrhoeal disease burden. It also underscores the need for better data on exposure and risk reductions that can be achieved with provision of reliable piped water, community sewage with treatment and hand hygiene.
Keywords: burden of disease, diarrhoea, water, sanitation, hygiene
Introduction
Information on the burden of disease, its causes and prevention is fundamental to health policy. Among other things, an improved understanding of the disease burden and the relative contribution of key risks points towards opportunities for preventive action in a context of increasing healthcare costs (OECD 2013).
In recognition of the value of this information, several comprehensive disease burden studies, focusing mainly on diarrhoeal diseases, have been undertaken in recent decades (Murray & Lopez 1996; WHO 2002, 2004, 2009; Prüss-Ustün et al. 2008; Lim et al. 2012). These report important changes in the roles of various risk factors (Clasen et al. 2014).
Inadequate drinking water, sanitation and hygiene (WASH) are important risk factors, particularly in low-income settings. In 2011, an estimated 768 million people relied on ‘unimproved’ water supplies (as defined by the WHO/UNICEF Joint Monitoring Program for Water and Sanitation – JMP), which are thought to have high levels of pathogen contamination (WHO & UNICEF 2013a). Many more use sources that are classified as ‘improved’ but are still unsafe for consumption (Bain et al. 2014). More than 2.5 billion people lack access to an improved sanitation facility (WHO & UNICEF 2013a). Inadequate hand hygiene practices have been estimated to affect 80% of the population globally (Freeman et al. 2014b).
The health risks from inadequate WASH have been documented previously (Esrey et al. 1991; Fewtrell et al. 2005; Waddington et al. 2009). However, the unpublished review on which the 2010 Global Burden of Disease (GBD) study is based (Lim et al. 2012) departed from earlier reviews by finding no additional benefit from further improvements such as higher water quality or continuous piped supply over the exposure defined as using ‘other improved water supplies’ (Engell & Lim 2013). A more recent systematic review, however, is largely consistent with previous evidence (Wolf et al. 2014).
Estimating the impact of WASH on diarrhoeal diseases has commonly been assessed with comparative risk assessment methods (Ezzati et al. 2002; WHO 2004; Lim et al. 2012), although other methods such as population intervention models could also be considered (Clasen et al. 2014). Other diseases cannot currently be estimated with such methods due to insufficient evidence and require alternative approaches. As these would require considerable additional assessments and analyses, they are not analysed in detail in this article.
Accrual of substantive recent evidence, as well as trends in the total diarrhoea burden, justifies the revision of methods and estimates of the burden of diarrhoeal disease associated with inadequate WASH. While the estimate presented focuses mainly on low- and middle-income settings, the approach used can accommodate a wider range of settings. An overview of previous findings on the impacts of WASH on other diseases than diarrhoea is also provided.
Methods
Framework for estimation
For the purpose of this assessment, we defined WASH to include the following transmission pathways: (i) ingestion of water – for example diarrhoea, arsenicosis, fluorosis; (ii) lack of water linked to inadequate personal hygiene – for example diarrhoea, trachoma, scabies; (iii) poor personal, domestic or agricultural hygiene – for example diarrhoea, Japanese encephalitis; (iv) contact with water – for example schistosomiasis; (v) vectors proliferating in water – for example malaria; and (vi) contaminated water systems – for example legionellosis (Prüss et al. 2002). The impact of WASH on most diseases cannot be precisely estimated, because of insufficient information on global exposures of concern or lack of widely applicable risk estimates matching the exposures. Table 1 provides an overview of main diseases related to WASH and previously estimated attributable fractions by disease. An overview of previous results is provided in the Discussion section.
Table 1.
Diseases related to water, sanitation and hygiene
| Disease outcomes and range of the fraction of disease globally attributable to WASHa | |||
|---|---|---|---|
| Contribution of WASH not quantified at global level | 0–33% | 33–66% | 66–100% |
| Hepatitis A, E, F Legionellosis Scabies Arsenicosis Fluorosis Methaemoglobinaemia | Onchocerciasis | Lymphatic filariasis Malaria Undernutrition and its consequences Drowning | Ascariasis Hookworm Trichuriasis Dengue Schistosomiasis Japanese encephalitis Trachoma |
The burden of diarrhoea associated with inadequate WASH can, however, be estimated using comparative risk assessment methods (Ezzati et al. 2002; WHO 2004; Lim et al. 2012) and is addressed in detail in this article. This approach estimates the proportional reduction in disease or death that would occur if exposures were reduced to an alternative baseline level bearing a minimum risk (also referred to as theoretical minimum risk), while other conditions remain unchanged. It is derived from the proportion of people exposed to the conditions of interest and the relative risk of disease related to the exposure.
Proportion of the population exposed and relative risk values were specified by level of exposure, age group and sex. Estimates were calculated for the 145 low- and middle-income countries (WHO Member States with income levels defined by the World Bank for 2012), which were then grouped into the six WHO Regions (WHO 2013b, Supporting Information). The estimation was performed for the year 2012 (WHO 2013a).
Selection of exposure-risk pairs for diarrhoeal disease
Water
Exposure levels were selected according to the availability of exposure data and corresponding exposure-risk information (Wolf et al. 2013, 2014) and included the following: (i) using an unimproved water source; (ii) using an improved water source other than piped to premises; (iii) using basic piped water on premises (improved source); and (iv) using a water filter or boiling water in the household (on water from an unimproved or improved source).
As piped water on premises is often intermittent and of suboptimal quality, the risks associated with having access to a ‘basic’ piped water supply in most settings of low- and middle-income countries are not equal to zero. A single study (meeting the criteria for the systematic review – Wolf et al. 2014) was identified which could inform this estimate of risk (i.e. by demonstrating the effect of improving water quality through the better operation of an existing piped water system in a context relevant to a low- or middle-income country). This study (Hunter et al. 2010) showed a significant and large reduction in diarrhoea and had an effect size of 0.32 (95% CI: 0.14–0.74). This evidence is also supported by information from disease outbreaks resulting from contaminated piped water (Mermin et al. 1999) and by interventions to further improve water supply systems in developed countries (Gunnarsdottir et al. 2012). However, given that only one study is currently available on the improvement beyond piped water to premises, a conservative approach was taken and the next best exposure level was used as the counterfactual (i.e. baseline) exposure (which consists of using a filter to treat water at household level – Wolf et al. 2014). Household water filtering is therefore used as a proxy for further improvement beyond currently available improved water sources.
It has been documented that lower water use (Cairncross & Feachem 1993; Royal Scientific Society 2013) and increasing distance to a water source (Tonglet et al. 1992; Galiani et al. 2007; Pickering & Davis 2012; Evans et al. 2013) have been associated with an increased risk of diarrhoea. The number of studies identified, however, was not sufficient to derive a pooled estimate. To account for this, in the current analysis, people living at distances greater than a 30-min round trip from their water source were assumed to have unimproved water.
Among assessed household water treatment methods, after adjusting for bias introduced through non-blinding of study participants, only use of a filter showed significant reductions in diarrhoeal disease morbidity; the effect of other methods, such as solar disinfection and chlorination, became non-significant after adjusting for bias (Wolf et al. 2014). Boiling of drinking water is a widespread practice in certain areas (Rosa & Clasen 2010), and while boiling may be an effective water treatment, recontamination has been reported (Clasen et al. 2008; Rosa et al. 2010). Only one study, however, has reported on the health effect of this practice (Iijima et al. 2001) and, for the purposes of this analysis, people who boil their drinking water have been classified with those who filter their water. Safe storage was assumed for all households filtering or boiling their water as information on recontamination was not available. Households filtering or boiling their water, with subsequent safe storage, represent the minimum risk group in this analysis.
The exposure levels for inadequate drinking water, used in this analysis, along with additional levels of exposure to water with improved quality or quantity that are not currently supported by sufficient epidemiological evidence, are shown in Figure 1. This approach can accommodate further exposure levels when supported by sufficient evidence. The exposure–risk relationships (taken from Wolf et al. 2014) are summarised in Table 2.
Figure 1.
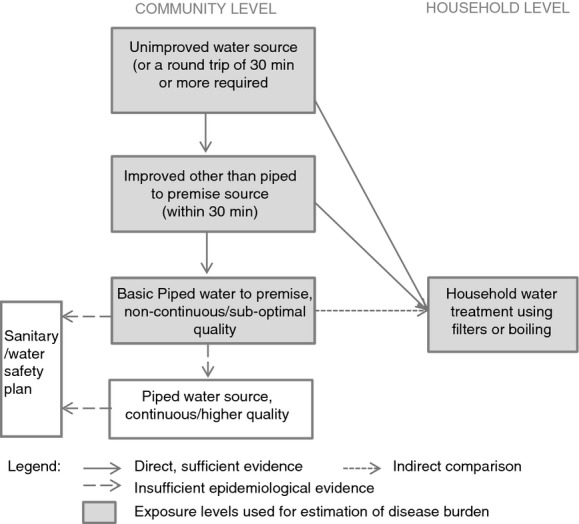
Exposure levels and associated risks for drinking water-related burden of disease estimates.
Table 2.
Effect sizes used for estimating diarrhoeal disease burden estimates from inadequate drinking water
| Baseline water | Outcome water | ||
|---|---|---|---|
| Improved sourceother than piped to premise | Basic piped water to premise‡ | Filter and safe storage in the household* | |
| Unimproved source | 0.89 (0.78–1.01) | 0.77 (0.64–0.92) | 0.55 (0.38–0.81) |
| Improved source other than piped to premise | 0.86 (0.72–1.03) | 0.62 (0.42–0.93) | |
| Basic piped water to premise‡ | 0.72 (0.47–1.11)† | ||
Not all steps of this body of evidence may be significant; however, risk estimates of the overall chain of improvements in water and sanitation are significant.
Adapted from: Wolf et al. (2014); Figures constitute relative risks (and 95% confidence intervals).
Estimate for filtering water in the household also used for boiling water.
Obtained through indirect comparison with improved non-piped or community water source in the meta-regression.
possibly non-continuous, and/or of sub-optimal quality.
Sanitation
The only exposure levels for inadequate sanitation with both globally representative exposure data and sufficient evidence for its effect on diarrhoea were the use of an improved or unimproved sanitation facility (as defined by JMP – WHO & UNICEF 2013b). Evidence based on two studies suggests that further reduction in diarrhoea morbidity can be achieved with sewer connections in urban settings (although it should be noted that potential adverse impacts of untreated sewage on receiving communities have not been well studied). As the evidence for sewer connection was limited, it was not retained for the current diarrhoeal disease burden estimates. The overall effect for access to an improved sanitation facility on reduction in diarrhoea morbidity used was 28% (RR 0.72, 95% CI 0.59–0.88) from Wolf et al. (2014).
Hygiene
An updated review of the evidence linking interventions of the promotion of hand hygiene with soap and diarrhoea morbidity (Freeman et al. 2014b) showed a 40% reduction in diarrhoea (RR 0.60, 95% CI 0.53–0.68). When correcting for bias due to non-blinding in studies using subjective health outcomes (Savović et al. 2012), this estimate changes to 0.77 (95% CI 0.32–1.86) and becomes non-significant. It should be noted, however, that this bias correction is based on a wide array of medical interventions, which may be of limited applicability to this type of intervention. A 23% reduction in diarrhoeal disease risk remains the best estimate of the effect of handwashing promotion.
Estimation of the proportion of people exposed
We drew on the definitions of the use of improved water sources, piped water to premises and improved sanitation of the JMP (WHO & UNICEF 2013b). Exposure by country was estimated by multilevel modelling as previously described (Wolf et al. 2013) based on over 1400 data points from national and international household surveys and censuses reported by JMP (WHO & UNICEF 2013b). Households with a travel time to the water source >30 min were deducted from improved sources at community level. We applied a linear two-level model with a logit transformation of the dependant variable (use of improved water source, improved sanitation or piped water to premises) to obtain estimates for the year 2012 (Wolf et al. 2013). The model also used a cubic spline transformation of the main predictor (time) and WHO region (WHO 2013b) as covariates, as well as a random intercept and slope by country.
Travel time of >30 min was reported by 178 household surveys [Demographic Health Surveys (USAID 2014), Multiple Indicator Cluster Surveys (UNICEF 2014), World Health Surveys (WHO 2014)] from 79 countries and was estimated for the year 2012 using a similar but simplified approach with a linear two-level model, with time and region as covariates and a random intercept and slope by country.
The proportion of country populations practising water treatment in the household was estimated using data from 78 household surveys [Demographic Health Surveys (USAID 2014), Multiple Indicator Cluster Surveys (UNICEF 2014), World Health Surveys (WHO 2014)] from 68 countries containing information on reported household water treatment (including chlorination, boiling, filtering, solar disinfection and others). A similar modelling approach as for travel time >30 min was used to obtain the proportion of households boiling or filtering their drinking water for the year 2012, with the difference that it did not use a random slope at country level. For countries with no information, the regional mean trend was taken as the best estimate.
Based on a review of water quality (Bain et al. 2014), no significant proportion of households in low- and middle-income settings are currently assumed to benefit from regulated and fully functional piped water supply systems.
The hand-washing prevalence, based on 75 observations, was taken from the systematic review reported by Freeman et al. (2014b).
Population-attributable fractions of diarrhoeal disease for individual risk factor and for the cluster
For each risk factor, the population-attributable fraction (PAF) was estimated by comparing current exposure distributions to a counterfactual distribution, for each exposure level, sex and age group, and by country:
| 1 |
where pi and RRi are the proportion of the exposed population and the relative risk at exposure level i, respectively, and n is the total number of exposure levels.
Exposure to inadequate WASH is related by similar mechanisms and policy interventions. The following formula has been proposed for the estimation of burden attributable to a cluster of risk factors (Lim et al. 2012):
| 2 |
where r is the individual risk factor and R the total number of risk factors accounted for in the cluster. This formula assumes that risk factors are independent. This assumption is likely to be an oversimplification for WASH as, for instance, handwashing promotion is unlikely to be effective if water quantity is limited. However, this approach has been applied in the assessment for ease of interpretation of the results, and in the absence of a more suitable approach.
Estimation of burden of diarrhoeal disease
The burden of disease attributable to each risk factor (AB), or to the cluster of risk factors, in deaths or disability-adjusted life years (DALYs), was obtained by multiplying the PAFs by the total burden of disease of diarrhoea (B):
| 3 |
The PAFs were applied equally to burden of disease in deaths and DALYs, and we assumed that the case fatality related to WASH was the same as the mean case fatality of diarrhoeal diseases.
Uncertainty estimates
To estimate uncertainty intervals, we developed a Monte Carlo simulation of the results with 5000 draws of the exposure distribution, and of the relative risks. As lower and upper uncertainty estimates, we used the 2.5 and 97.5 percentiles of the attributable fractions, attributable deaths and DALYs resulting from the Monte Carlo analysis (Palisade 2013).
Results
The worldwide distribution of exposure and the resulting attributable deaths and DALYs from diarrhoeal disease associated with inadequate WASH practices were estimated for the year 2012.
Exposure estimates
In low- and middle-income countries, it was found that in 31% of households people report boiling or filtering their water; 31% of households use piped water to premises; 27% use a non-piped or community water source; 12% use only an unimproved water source and do not filter or boil their water; and on the sanitation side, 58% of households were estimated to use an improved sanitation facility, respectively.
Handwashing after using a sanitation facility or contact with faecal material is practised by 19% of people worldwide (based on observation data), with a mean of 14% in low- and middle-income countries, and 43% in high-income countries (Freeman et al. 2014b). The estimated regional distribution of exposure is presented in Table 3 (drinking water) and Table 4 (sanitation and hygiene); more detail by country is provided in the Supporting Information.
Table 3.
Distribution of the population to exposure levels of drinking water, by region, for 2012
| Region | Use of piped water on premises | Use of non-piped or community sources | Use of unimproved water sources | Total* | |||
|---|---|---|---|---|---|---|---|
| Proportion of total population by region | |||||||
| Filtering/boiling in the household | Without | With | Without | With | Without | With | |
| Sub-Saharan Africa | 0.16 | 0.03 | 0.36 | 0.04 | 0.38 | 0.04 | 1.00 |
| America, LMI | 0.58 | 0.30 | 0.05 | 0.01 | 0.05 | 0.01 | 1.00 |
| Eastern Mediterranean, LMI | 0.54 | 0.04 | 0.25 | 0.01 | 0.15 | 0.01 | 1.00 |
| Europe, LMI | 0.54 | 0.27 | 0.10 | 0.05 | 0.03 | 0.02 | 1.00 |
| South-East Asia | 0.16 | 0.09 | 0.48 | 0.14 | 0.09 | 0.04 | 1.00 |
| Western Pacific, LMI | 0.31 | 0.35 | 0.13 | 0.14 | 0.04 | 0.04 | 1.00 |
| Total LMI | 0.31 | 0.18 | 0.27 | 0.09 | 0.12 | 0.03 | 1.00 |
LMI, low and middle income.
The total may not equal the sum of numbers displayed in the rows due to rounding error.
Table 4.
Distribution of the population to exposure levels of sanitation and hygiene, by region, for 2012
| Region | Access to improved sanitation facility | Prevalence of handwashing after contact with excreta |
|---|---|---|
| Proportion of total population | ||
| Sub-Saharan Africa | 0.35 | 0.14 |
| America, HI | – | 0.49 |
| America, LMI | 0.83 | 0.16 |
| Eastern Mediterranean, HI | – | 0.44 |
| Eastern Mediterranean, LMI | 0.68 | 0.14 |
| Europe, HI | – | 0.44 |
| Europe, LMI | 0.87 | 0.15 |
| South-East Asia | 0.47 | 0.17 |
| Western Pacific, HI | – | 0.43 |
| Western Pacific, LMI | 0.64 | 0.13 |
| Total | – | 0.19 |
| Total HI | – | 0.43 |
| Total LMI | 0.58 | 0.14 |
LMI, low and middle income; HI, high income; –, not estimated.
Estimates of the burden of diarrhoeal disease
The resulting burden of diarrhoea, in low- and middle-income countries, linked to these exposures amounts to 502 000 deaths associated with inadequate water and 280 000 deaths due to inadequate sanitation from a total of 1.50 million diarrhoeal deaths in the year 2012.
In addition, it was estimated that 297 000 deaths could be prevented by the promotion of hand hygiene, although this estimate is based on an effect size which is not statistically significant. The estimate without adjusting for non-blinding would be 539 000 deaths.
Together (using Equation 2), the deaths attributable to inadequate water and sanitation amount to 685 000. Adding (bias-adjusted) inadequate hand hygiene increases this estimate to 842 000 deaths, which represents 1.5% of the global disease burden in 2012. A regional summary of attributable deaths and DALYs for each of the risk factors is provided in Tables 7, and the cluster data are shown in Table 8. Detail by country can be found in the Supporting Information.
Table 7.
Diarrhoea burden attributable to inadequate hand hygiene by region, 2012
| Region | PAF (95% CI) | Deaths (95% CI) | DALYs (in 1000s) (95% CI) |
|---|---|---|---|
| Sub-Saharan Africa | 0.20 (0–0.61) | 122 955 (0–365 911) | 9411 (0–28 006) |
| America, HI | 0.13 (0–0.45) | – | – |
| America, LMI | 0.20 (0–0.60) | 5026 (0–15 013) | 416 (0–1243) |
| Eastern Mediterranean, HI | 0.14 (0–0.48) | – | – |
| Eastern Mediterranean, LMI | 0.21 (0–0.61) | 28 699 (0–85 369) | 2314 (0–6884) |
| Europe, HI | 0.14 (0–0.48) | – | – |
| Europe, LMI | 0.19 (0–0.59) | 1972 (0–5975) | 202 (0–611) |
| South-East Asia | 0.20 (0–0.60) | 131 519 (0–392 018) | 6857 (0–20 444) |
| Western Pacific, HI | 0.16 (0–0.50) | – | – |
| Western Pacific, LMI | 0.21 (0–0.61) | 6690 (0–19 891) | 758 (0–2253) |
| Total | 0.20 (0–0.60) | – | – |
| Total HI | 0.14 (0–0.47) | – | – |
| Total LMI | 0.20 (0–0.60) | 296 860 (0–885 355) | 19 958 (0–59 491) |
DALYs, disability-adjusted life years; PAF, population-attributable fraction; LMI, low and middle income; HI, high income; –, not estimated.
Table 8.
Diarrhoea deaths attributable to the cluster of inadequate water, and inadequate sanitation and hand hygiene
| Region | Inadequate water, sanitation and hand hygiene | Inadequate water and sanitation | ||
|---|---|---|---|---|
| PAF (95% CI) | Deaths (95% CI) | PAF (95% CI) | Deaths (95% CI) | |
| Sub-Saharan Africa | 0.61 (0.55–0.66) | 367 605 (326 795–402 438) | 0.51 (0.47–0.55) | 307 493 (276 989–335 899) |
| America, LMI | 0.46 (0.36–0.50) | 11 519 (9310–13 616) | 0.32 (0.28–0.34) | 8125 (7101–9158) |
| Eastern Mediterranean, LMI | 0.58 (0.47–0.66) | 81 064 (65 359–94 707) | 0.47 (0.40–0.53) | 65 700 (55 266–75 876) |
| Europe, LMI | 0.35 (0.28–0.46) | 3564 (2462–4678) | 0.19 (0.19–0.27) | 1970 (1654–2280) |
| South-East Asia | 0.56 (0.36–0.70) | 363 904 (225 359–477 720) | 0.45 (0.31–0.57) | 291 763 (193 198–383 423) |
| Western Pacific, LMI | 0.44 (0.31–0.54) | 14 160 (10 035–18 009) | 0.29 (0.23–0.33) | 9429 (7519–11 242) |
| Total LMI | 0.58 (0.48–0.65) | 841 818 (699 059–963 626) | 0.47 (0.40–0.53) | 684 479 (580 456–780 463) |
PAF, population-attributable fraction; LMI, low and middle income.
Table 5.
Diarrhoea burden attributable to inadequate water by region, 2012
| Region | PAF (95% CI) | Deaths (95% CI) | DALYs (in 1000s) (95% CI) |
|---|---|---|---|
| Sub-Saharan Africa | 0.38 (0.19–0.50) | 229 316 (106 664–300 790) | 17 587 (8152–23 065) |
| America, LMI | 0.26 (0.14–0.33) | 6441 (624–9748) | 522 (39–801) |
| Eastern Mediterranean, LMI | 0.36 (0.19–0.46) | 50 409 (22 498–66 604) | 4046 (1784–5351) |
| Europe, LMI | 0.16 (0.10–0.26) | 1676 (196–2606) | 174 (19–271) |
| South-East Asia | 0.32 (0.11–0.44) | 207 773 (59 708–293 068) | 10 748 (3097–15 160) |
| Western Pacific, LMI | 0.20 (0.09–0.27) | 6448 (2005–9469) | 716 (198–1081) |
| Total LMI | 0.34 (0.16–0.45) | 502 061 (217 119–671 945) | 33 793 (14 930–44 871) |
DALYs, disability-adjusted life years; PAF, population-attributable fraction; LMI, low and middle income.
Table 6.
Diarrhoea burden attributable to inadequate sanitation by region, 2012
| Region | PAF (95% CI) | Deaths (95% CI) | DALYs (in 1000s) (95% CI) |
|---|---|---|---|
| Sub-Saharan Africa | 0.21 (0.07–0.31) | 126 294 (42 881–186 850) | 9694 (3291–14 333) |
| America, LMI | 0.09 (0.03–0.15) | 2370 (774–3724) | 188 (61–295) |
| Eastern Mediterranean, LMI | 0.17 (0.06–0.26) | 24 441 (8339–36 809) | 1914 (651–2887) |
| Europe, LMI | 0.03 (0.01–0.06) | 352 (107–597) | 36 (11–61) |
| South-East Asia | 0.19 (0.06–0.28) | 123 279 (42 116–185 426) | 6376 (2177–9595) |
| Western Pacific, LMI | 0.11 (0.04–0.17) | 3709 (1171–5954) | 444 (136–737) |
| Total LMI | 0.19 (0.07–0.29) | 280 443 (95 699–417 482) | 18 650 (6380–27 769) |
DALYs, disability-adjusted life years; PAF, population-attributable fraction; LMI, low and middle income.
Among children under 5 years, 361 000 deaths could have been prevented through reduction of these risks in low- and middle-income settings, representing 5.5% of the total burden of disease in this age group.
Discussion
These estimates of the burden of diarrhoea attributable to inadequate WASH are lower than previous estimates coordinated by WHO (WHO 2009) and higher than the recent estimate of the 2010 GBD study (Lim et al. 2012). There is strong evidence that the number of deaths due to diarrhoeal disease has dropped considerably since 2004 (WHO 2009; Liu et al. 2012; Lozano et al. 2012) due to a combination of improved management of diarrhoeal disease (especially the use of oral rehydration therapy) and better access to water and sanitation. This is in line with the lower burden of diarrhoeal disease estimates in both the 2010 GBD study and the current work. The larger burden of diarrhoeal disease found in this study, compared with the 2010 GBD study, can be explained by the different counterfactuals used, the consideration in this study of disease burden due to poor hand hygiene and to the adjustments made to account for bias resulting from the lack of blinding in studies on different household water treatment interventions.
The estimate of diarrhoeal disease burden attributable to inadequate WASH practices is limited by the underlying evidence, which remains scarce for the transition between an improved water source and a functional and regulated water supply system. The evidence is also limited on sanitation; in particular, there is a dearth of information on wastewater and excreta management from improved facilities and the impact this has on downstream communities when it is disposed of, untreated, to the environment. In addition, a conservative effect size was chosen for the impact of hand hygiene on diarrhoea, based on figures adjusted for possible bias (Freeman et al. 2014b). This approach is, thus, more conservative than previous estimates (Curtis & Cairncross 2003).
Exposure data are limited in terms of representative measures of water quality. Handwashing prevalence has not yet been widely assessed, although studies have shown surprisingly little variation across countries and population groups within income groups (Freeman et al. 2014b). Surveys reporting the use of household water treatment options have shown some over-reporting. This would, however, have led to an underestimation of diarrhoeal disease burden in this analysis as households reported as filtering or boiling their water were assigned as having no risk related to inadequate WASH.
Certain potentially relevant exposure/exposure-risk pairs cannot yet be considered. These include, for example, incomplete community sanitation (i.e. incomplete community coverage) meaning that contact with excreta may persist within the community. Another example consists in improved sanitation facilities without treatment, which are likely to result in exposure of receiving communities to untreated sewage and could affect 22% of the global population (Baum et al. 2013). Also, this assessment is limited to non-outbreak situations.
The global assessment of exposure to faecal contamination through drinking water (Bain et al. 2014) has highlighted that piped water supplies in the American, European and Western Pacific low- and middle-income regions show particularly low contamination in urban areas, with <10% of investigated samples faecally contaminated. The relative risks from the meta-regression (Wolf et al. 2014) may overrate the risks of water sources with such low proportions of contamination, as they have been relatively poorly investigated in the underlying epidemiological literature. If assuming that urban piped supplies in those regions carry no increased risk for diarrhoea, the total diarrhoea burden from inadequate water sources would have decreased from 502 000 to 497 000 deaths in 2012, with 2800 fewer deaths in the American region, 700 fewer deaths in the European region and 1500 fewer deaths in the Western Pacific region, respectively. The contamination of piped water in those regions may, however, have been underestimated because (i) studies tend to take place in formal urban areas and especially in capital cities, (ii) the assessment reported the per cent of samples containing contamination rather than compliance with WHO guidelines, and (iii) the focus was on water quality at the source and not stored at home or sampled just before consumption (Bain et al. 2014).
The current estimation has focused on diarrhoeal diseases and has not re-analysed the impact on other diseases, which have been linked to inadequate WASH, including soil-transmitted helminth infections (Ziegelbauer et al. 2012), vector-borne diseases (Emerson et al. 2000), environmental enteropathy (Humphrey 2009). Furthermore, improved WASH has been shown to significantly reduce undernutrition (Dangour et al. 2013), a major cause of mortality in children under 5 years of age (Black et al. 2013). Previous estimates, based on literature reviews combined with expert opinion, have, however, attempted to provide quantitative estimates of other diseases than diarrhoea, with the following results: In 2004, 881 000 deaths were attributed to water supply, sanitation and hygiene, mainly through the effect on undernutrition and its consequences, but also from schistosomiasis and lymphatic filariasis. The impacts of water resource management, mainly on malaria but also dengue and Japanese encephalitis, were estimated to amount to 557 000 deaths in the same year. Finally, safer water environments could have prevented 244 000 deaths from drowning, globally (Prüss-Ustün & Corvalán 2007; Prüss-Ustün et al. 2008). Although these figures would require an update, they indicate that the impacts of WASH on other diseases combined are likely to be even higher than those on diarrhoea.
The estimation of diarrhoeal disease burden relies on proxies such as access to water and sanitation facilities rather than water quality, water quantity or behaviours associated with these facilities (such as consistent or exclusive use by individuals) which are also a determining factor in characterising actual exposure. They were selected because of the available exposure information and their best match in the latest findings on risk estimates from the epidemiological literature. Greater precision of estimates is expected with better assessment of these more proximal risks and their population exposures. In addition, in common with a number of other disease burden estimates (Lim et al. 2012), the estimate is based on risk estimates for morbidity rather than mortality.
Due to these limitations, it is unlikely that this estimate accounts for the full health benefits in diarrhoea reduction that could be achieved by improvements in WASH. By relying on evidence of interventions that have often only achieved limited or partial compliance, this disease burden reflects reduction in diarrhoea that can be achieved with currently documented interventions in low- and middle-income countries. It is unlikely that the estimate accounts for the full reduction in burden that could be achieved by well-functioning water supply or sewage systems. For example, this estimate does not reflect health benefits that may be achieved through improvements following the implementation of management systems such as water safety plans (Gunnarsdottir et al. 2012), a proactive, comprehensive approach to managing risks throughout the water supply system. In addition, the estimates do not account for the potential impact of improvements to institutional settings, such as health centres and schools, and where studies have shown impact on other age groups (Dreibelbis et al. 2014; Freeman et al. 2014a).
Through the reassessment of the evidence linking drinking water to diarrhoea using a more scaled approach (Wolf et al. 2014), it has been possible to develop an estimate that takes account of the reduction in risks when further improving water quality or quantity over what is currently defined as an ‘improved source’, which was not carried out in more basic assessments (Lim et al. 2012). Indeed, improved water sources have been shown to carry important contamination and risks to a significant share of the population (Bain et al. 2014).
The separate assessment of the risks of WASH is not ideal, as those risk factors are likely to have linkages in terms of both exposure and effects on diarrhoeal risk. This choice was made, however, to facilitate policy interpretation, and because of the availability of factor-specific data sets. Nevertheless, the validity of some of these aspects, such as joint interventions, has been assessed in the meta-regression (Wolf et al. 2014) by testing the significance of covariates.
It is acknowledged that this assessment does not account for a number of relevant exposures including access to a continuous supply of safe piped water, community sewerage which prevents exposure to untreated wastewater or excreta (rather than focusing on household exposure alone) – evidence in this area is still limited. The counterfactual for the current assessment corresponds to currently achievable options that have been documented in developing countries and does not yet take into account the improvements that could be made beyond such a status. Although this assessment is limited to low- and middle-income settings, it is acknowledged that health risks exist even in apparently well-managed drinking water systems in developed countries (Zmirou et al. 1995; Naumova et al. 2005; Lake et al. 2007; Tinker et al. 2009), and further improvements have been shown to reduce health risks (Gunnarsdottir et al. 2012). This assessment does, however, act as a step towards a more comprehensive future estimate.
Conclusion
This updated estimate of the diarrhoeal disease burden due to inadequate WASH has made use of a meta-regression approach to the evidence, based on specific information of baseline and outcome situation for each relevant study. This approach has resulted in a more refined estimate of disease burden according to exposure specificities. It can accommodate further consolidation as evidence accrues. It confirms the important role of the provision of safe water, adequate sanitation and hygiene promotion to protect health. Previous finding indicating an important impact of WASH on other diseases than diarrhoea further strengthens these findings.
Acknowledgments
The study was partially funded by the United Kingdom Department for International Development (DFID). The funder had no role in study design, data collection and analysis, decision to publish or preparation of the manuscript. Some authors are staff members of the World Health Organization (WHO) or other institutions. The authors alone are responsible for the views expressed in this publication, which do not necessarily represent the views, decisions or policies of the WHO, the UK DFID or other institutions. This article should not be reproduced for use in association with the promotion of commercial products, services or any legal entity. The WHO does not endorse any specific organisation or products. Any reproduction of this article cannot include the use of the WHO logo.
Conflict of interest
Thomas Clasen has participated in research and consulting services supported by Unilever and Vestergaard-Frandsen, which manufacture and sell household or other point of use water filtration devices.
Supporting Information
Additional Supporting Information may be found in the online version of this article
Deaths attributable to inadequate water, sanitation, and hygiene by low- and middle-income countriesa for the year 2012.
Table S2. Deaths attributable to the combined inadequate water and sanitation, and to the combined inadequate water, sanitation and hygiene by low- and middle-income countrya, for the year 2012.
References
- Bain R, Cronk R, Bonjour S, et al. Assessment of the level of exposure to fecally contaminated drinking water in developing countries. Tropical Medicine and International Health. 2014 [Google Scholar]
- Baum R, Luh J. Bartram J. Sanitation: a global estimate of sewerage connections without treatment and the resulting impact on MDG progress. Environmental Science & Technology. 2013;47:1994–2000. doi: 10.1021/es304284f. [DOI] [PubMed] [Google Scholar]
- Black RE, Victora CG, Walker SP, et al. Maternal and child undernutrition and overweight in low-income and middle-income countries. Lancet. 2013;382:427–477. doi: 10.1016/S0140-6736(13)60937-X. [DOI] [PubMed] [Google Scholar]
- Cairncross S. Feachem R. Environmental Health Engineering in the Tropics. An Introductory Text. Chichester: John Wiley & Sons; 1993. [Google Scholar]
- Clasen T, Mclaughlin C, Nayaar N, et al. Microbiological effectiveness and cost of disinfecting water by boiling in semi-urban India. American Journal of Tropical Medicine & Hygiene. 2008;79:407–413. [PubMed] [Google Scholar]
- Clasen T, Prüss-Ustün A, Mathers C, Cumming O, Cairncross S. Colford JM., Jr Estimating the impact of unsafe water, sanitation and hygiene on the global burden of disease: evolving and alternative methods. Tropical Medicine & International Health. 2014 doi: 10.1111/tmi.12330. [DOI] [PubMed] [Google Scholar]
- Curtis V. Cairncross S. Effect of washing hands with soap on diarrhoea risk in the community: a systematic review. The Lancet Infectious Diseases. 2003;3:275–281. doi: 10.1016/s1473-3099(03)00606-6. [DOI] [PubMed] [Google Scholar]
- Dangour AD, Watson L, Cumming O, et al. Interventions to improve water quality and supply, sanitation and hygiene practices, and their effects on the nutritional status of children. The Cochrane Database of Systematic Reviews. 2013;8:CD009382. doi: 10.1002/14651858.CD009382.pub2. [DOI] [PMC free article] [PubMed] [Google Scholar]
- Dreibelbis R, Freeman MC, Greene LE, Saboori S. Rheingans R. The impact of school water, sanitation, and hygiene interventions on the health of younger siblings of pupils: a cluster-randomized trial in Kenya. American Journal of Public Health. 2014;104:e91–e97. doi: 10.2105/AJPH.2013.301412. [DOI] [PMC free article] [PubMed] [Google Scholar]
- Emerson PM, Cairncross S, Bailey RL. Mabey DC. Review of the evidence base for the ‘F’ and ‘E’ components of the SAFE strategy for trachoma control. Tropical Medicine & International Health. 2000;5:515–527. doi: 10.1046/j.1365-3156.2000.00603.x. [DOI] [PubMed] [Google Scholar]
- Engell RE. Lim S. Does clean water matter? An updated meta-analysis of water supply and sanitation interventions and diarrhoeal diseases. The Lancet. 2013;381:S44. [Google Scholar]
- Esrey SA, Potash JB, Roberts L. Shiff C. Effects of improved water supply and sanitation on ascariasis, diarrhoea, dracunculiasis, hookworm infection, schistosomiasis, and trachoma. Bulletin of the World Health Organization. 1991;69:609–621. [PMC free article] [PubMed] [Google Scholar]
- Evans B, Bartram J, Hunter P, et al. Public Health and Social Benefits of At-House Water Supplies. Leeds, UK: University of Leeds; 2013. [Google Scholar]
- Ezzati M, Lopez AD, Rodgers A, Vander Hoorn S. Murray CJL. Selected major risk factors and global and regional burden of disease. Lancet. 2002;360:1347–1360. doi: 10.1016/S0140-6736(02)11403-6. [DOI] [PubMed] [Google Scholar]
- Fewtrell L, Kaufmann RB, Kay D, Enanoria W, Haller L. Colford JM. Water, sanitation, and hygiene interventions to reduce diarrhoea in less developed countries: a systematic review and meta-analysis. The Lancet Infectious Diseases. 2005;5:42–52. doi: 10.1016/S1473-3099(04)01253-8. [DOI] [PubMed] [Google Scholar]
- Freeman MC, Clasen T, Dreibelbis R, et al. The impact of a school-based water supply and treatment, hygiene, and sanitation programme on pupil diarrhoea: a cluster-randomized trial. Epidemiology & Infection. 2014a;142:340–351. doi: 10.1017/S0950268813001118. [DOI] [PMC free article] [PubMed] [Google Scholar]
- Freeman M, Stocks M, Cumming O, et al. Hygiene and health: systematic review of handwashing practices worldwide and update of health effects. Tropical Medicine and International Health. 2014b doi: 10.1111/tmi.12339. [DOI] [PubMed] [Google Scholar]
- Galiani S, Gonzalez-Rozada M. Schargrodsky E. Water Expansions in Shantytowns: Health and Savings. Washington, DC: Inter-American Development Bank; 2007. [Google Scholar]
- Gunnarsdottir MJ, Gardarsson SM, Elliott M, Sigmundsdottir G. Bartram J. Benefits of water safety plans: microbiology, compliance, and public health. Environmental Science & Technology. 2012;46:7782–7789. doi: 10.1021/es300372h. [DOI] [PubMed] [Google Scholar]
- Humphrey JH. Child undernutrition, tropical enteropathy, toilets, and handwashing. Lancet. 2009;374:1032–1035. doi: 10.1016/S0140-6736(09)60950-8. [DOI] [PubMed] [Google Scholar]
- Hunter PR, Ramírez Toro GI. Minnigh HA. Impact on diarrhoeal illness of a community educational intervention to improve drinking water quality in rural communities in Puerto Rico. BMC Public Health. 2010;10:219. doi: 10.1186/1471-2458-10-219. [DOI] [PMC free article] [PubMed] [Google Scholar]
- Iijima Y, Karama M, Oundo JO. Honda T. Prevention of bacterial diarrhea by pasteurization of drinking water in Kenya. Microbiology & Immunology. 2001;45:413–416. doi: 10.1111/j.1348-0421.2001.tb02639.x. [DOI] [PubMed] [Google Scholar]
- Lake IR, Harrison FC, Chalmers RM, et al. Case-control study of environmental and social factors influencing cryptosporidiosis. European Journal of Epidemiology. 2007;22:805–811. doi: 10.1007/s10654-007-9179-1. [DOI] [PMC free article] [PubMed] [Google Scholar]
- Lim SS, Vos T, Flaxman AD, et al. A comparative risk assessment of burden of disease and injury attributable to 67 risk factors and risk factor clusters in 21 regions, 1990–2010: a systematic analysis for the Global Burden of Disease Study 2010. The Lancet. 2012;380:2224–2260. doi: 10.1016/S0140-6736(12)61766-8. [DOI] [PMC free article] [PubMed] [Google Scholar]
- Liu L, Johnson HL, Cousens S, et al. Global, regional, and national causes of child mortality: an updated systematic analysis for 2010 with time trends since 2000. Lancet. 2012;379:2151–2161. doi: 10.1016/S0140-6736(12)60560-1. [DOI] [PubMed] [Google Scholar]
- Lozano R, Naghavi M, Foreman K, et al. Global and regional mortality from 235 causes of death for 20 age groups in 1990 and 2010: a systematic analysis for the Global Burden of Disease Study 2010. Lancet. 2012;380:2095–2128. doi: 10.1016/S0140-6736(12)61728-0. [DOI] [PMC free article] [PubMed] [Google Scholar]
- Mermin JH, Villar R, Carpenter J, et al. A massive epidemic of multidrug-resistant typhoid fever in Tajikistan associated with consumption of municipal water. The Journal of Infectious Diseases. 1999;179:1416–1422. doi: 10.1086/314766. [DOI] [PubMed] [Google Scholar]
- Murray C. Lopez AD. The Global Burden of Disease. Geneva: World Health Organization, Harvard School of Public Health, World Bank; 1996. [Google Scholar]
- Naumova EN, Christodouleas J, Hunter PR. Syed Q. Effect of precipitation on seasonal variability in cryptosporidiosis recorded by the North West England surveillance system in 1990–1999. Journal of Water and Health. 2005;3:185–196. [PubMed] [Google Scholar]
- OECD. Public Spending on Health and Long-Term Care: A New Set of Projections. Paris: Organization for Economic Co-operation and Development; 2013. [Google Scholar]
- Palisade. 2013. Risk 6 http://www.palisade.com/risk.
- Pickering AJ. Davis J. Freshwater availability and water fetching distance affect child health in sub-Saharan Africa. Environmental Science & Technology. 2012;46:2391–2397. doi: 10.1021/es203177v. [DOI] [PubMed] [Google Scholar]
- Prüss A, Kay D, Fewtrell L. Bartram J. Estimating the burden of disease from water, sanitation, and hygiene at a global level. Environmental health perspectives. 2002;110:537–542. doi: 10.1289/ehp.110-1240845. [DOI] [PMC free article] [PubMed] [Google Scholar]
- Prüss-Ustün A. Corvalán C. How much disease burden can be prevented by environmental interventions? Epidemiology. 2007;18:167–178. doi: 10.1097/01.ede.0000239647.26389.80. [DOI] [PubMed] [Google Scholar]
- Prüss-Ustün A, Bos R, Gore F. Bartram J. Safer Water, Better Health. Geneva, Switzerland: World Health Organization; 2008. [Google Scholar]
- Rosa G. Clasen T. Estimating the scope of household water treatment in low- and medium-income countries. The American Journal of Tropical Medicine and Hygiene. 2010;82:289–300. doi: 10.4269/ajtmh.2010.09-0382. [DOI] [PMC free article] [PubMed] [Google Scholar]
- Rosa G, Miller L. Clasen T. Microbiological effectiveness of disinfecting water by boiling in rural Guatemala. American Journal of Tropical Medicine & Hygiene. 2010;82:473–477. doi: 10.4269/ajtmh.2010.09-0320. [DOI] [PMC free article] [PubMed] [Google Scholar]
- Royal Scientific Society. To Identify Minimum Household Water Security Requirements for Health Protection. Amman, Jordan: Royal Scientific Society; 2013. [Google Scholar]
- Savović J, Jones HE, Altman DG, et al. Influence of reported study design characteristics on intervention effect estimates from randomized, controlled trials. Annals of Internal Medicine. 2012;157:429–438. doi: 10.7326/0003-4819-157-6-201209180-00537. [DOI] [PubMed] [Google Scholar]
- Tinker SC, Moe CL, Klein M, et al. Drinking water residence time in distribution networks and emergency department visits for gastrointestinal illness in Metro Atlanta, Georgia. Journal of Water and Health. 2009;7:332–343. doi: 10.2166/wh.2009.022. [DOI] [PMC free article] [PubMed] [Google Scholar]
- Tonglet R, Isu K, Mpese M, Dramaix M. Hennart P. Can improvements in water supply reduce childhood diarrhoea? Health Policy and Planning. 1992;7:260–268. [Google Scholar]
- UNICEF. Multiple Indicator Cluster Survey (MICS) New York: United Nations Children's Fund; 2014. http://www.unicef.org/statistics/index_24302.html. [Google Scholar]
- USAID. DHS Program. US Agency for International Development; 2014. http://dhsprogram.com/ [Google Scholar]
- Waddington H, Snilstveit B, White H. Fewtrell L. Water, Sanitation and Hygiene Interventions to Combat Childhood Diarrhoea in Developing Countries. New Delhi, India: The International Initiative for Impact Evaluation (3ie); 2009. [Google Scholar]
- WHO. The World Health Report 2002 – Reducing Risks, Promoting Healthy Life. Geneva, Switzerland: World Health Organization; 2002. [DOI] [PubMed] [Google Scholar]
- WHO. Comparative Quantification of Health Risks. Geneva: World Health Organization; 2004. [Google Scholar]
- WHO. The Global Burden of Disease: 2004 Update. Geneva: World Health Organization; 2009. [Google Scholar]
- WHO. Global health observatory – data repository. 2013a. Online] http://apps.who.int/ghodata/files/84/ghodata.html. [DOI] [PubMed]
- WHO. WHO Regional Offices. Geneva: World Health Organization; 2013b. Online]. http://www.who.int/about/regions/en/ [Google Scholar]
- WHO. World Health Survey (WHS) Geneva: 2014. Online]. http://www.who.int/healthinfo/survey/en/ [Google Scholar]
- WHO & UNICEF. Progress on Sanitation and Drinking-Water. 2013 Update. Geneva: World Health Organization; 2013a. [Google Scholar]
- WHO & UNICEF. WHO/UNICEF Joint Monitoring Programme (JMP) for water supply and sanitation. 2013b. Online]. http://www.wssinfo.org/data-estimates/introduction/
- Wolf J, Bonjour S. Prüss-Ustün A. An exploration of multilevel modeling for estimating access to drinking-water and sanitation. Journal of Water and Health. 2013;11:64–77. doi: 10.2166/wh.2012.107. [DOI] [PubMed] [Google Scholar]
- Wolf J, Prüss-Ustün A, Cumming O, et al. Review of the evidence relating drinking-water and sanitation to diarrhoea: a meta-regression. Tropical Medicine and International Health. 2014 doi: 10.1111/tmi.12331. [DOI] [PubMed] [Google Scholar]
- World Bank. Country and Lending Groups, July 2012. Washington, DC: World Bank; 2012. [Google Scholar]
- Ziegelbauer K, Speich B, Mäusezahl D, Bos R, Keiser J. Utzinger J. Effect of sanitation on soil-transmitted helminth infection: systematic review and meta-analysis. PLoS Medicine. 2012;9:e1001162. doi: 10.1371/journal.pmed.1001162. [DOI] [PMC free article] [PubMed] [Google Scholar]
- Zmirou D, Rey S. Courtois X. Residual microbiological risk after simple chlorine treatment of drinking ground water in small community systems. European Journal of Public Health. 1995;5:75–81. [Google Scholar]
Associated Data
This section collects any data citations, data availability statements, or supplementary materials included in this article.
Supplementary Materials
Deaths attributable to inadequate water, sanitation, and hygiene by low- and middle-income countriesa for the year 2012.
Table S2. Deaths attributable to the combined inadequate water and sanitation, and to the combined inadequate water, sanitation and hygiene by low- and middle-income countrya, for the year 2012.