

Abstract
Anopheles gambiae is a major mosquito vector of malaria in Africa. Although increased use of insecticide-based vector control tools has decreased malaria transmission, elimination is likely to require novel genetic control strategies. It can be argued that the absence of an A. gambiae inbred line has slowed progress toward genetic vector control. In order to empower genetic studies and enable precise and reproducible experimentation, we set out to create an inbred line of this species. We found that amenability to inbreeding varied between populations of A. gambiae. After full-sib inbreeding for ten generations, we genotyped 112 individuals—56 saved prior to inbreeding and 56 collected after inbreeding—at a genome-wide panel of single nucleotide polymorphisms (SNPs). Although inbreeding dramatically reduced diversity across much of the genome, we discovered numerous, discrete genomic blocks that maintained high heterozygosity. For one large genomic region, we were able to definitively show that high diversity is due to the persistent polymorphism of a chromosomal inversion. Inbred lines in other eukaryotes often exhibit a qualitatively similar retention of polymorphism when typed at a small number of markers. Our whole-genome SNP data provide the first strong, empirical evidence supporting associative overdominance as the mechanism maintaining higher than expected diversity in inbred lines. Although creation of A. gambiae lines devoid of nearly all polymorphism may not be feasible, our results provide critical insights into how more fully isogenic lines can be created.
Keywords: inbreeding, vector biology, associative overdominance
Introduction
Model species are a powerful tool for investigating novel biological processes as they are easily maintained in a laboratory environment, allowing for precise genetic and experimental manipulation (Miklos and Rubin 1996; Rubin et al. 2000). However, to be of practical benefit, insights obtained from model species need to be confirmed in nonmodel systems, an often difficult, time-consuming, and expensive task (Hunter 2008).
The African malaria mosquito Anopheles gambiae is a good example of an important nonmodel system with limited genetic resources (White et al. 2011). Endemic to Sub-Saharan Africa, A. gambiae is a highly synanthropic species and one of the most efficient malaria vectors in the world (Collins and Paskewitz 1995; Coluzzi et al. 2002). Since the publication of its genome in 2002 (Holt et al. 2002), much effort has been devoted to understanding A. gambiae molecular biology with the end goal of devising novel genetic control strategies to disrupt disease transmission (Beaty et al. 2009; Blandin et al. 2009; Windbichler et al. 2011). However, both genetic work within A. gambiae and the translation of discoveries from other invertebrates are impeded by the absence of an inbred line.
Due to the relative difficulty of rearing and maintaining A. gambiae, researchers use eggs from multiple females to establish colonies (Mpofu et al. 1993; Benedict 1997, 2009; della Torre et al. 1997). Although some genetic variation is lost through bottlenecks associated with colonization (Norris et al. 2001), even long-established A. gambiae colonies retain high diversity (Morlais et al. 2004; Lawniczak et al. 2010; Neafsey et al. 2013). Variation within colonies of A. gambiae hinders progress of genomic studies in two key ways. First, despite being the second arthropod to have its genome sequenced, the A. gambiae reference genomes remain poorly assembled (Holt et al. 2002; Sharakhova et al. 2007; Lawniczak et al. 2010) due to high heterozygosity in the source DNA. Incomplete and improper reference genome assembly can cause spurious, deficient, or erroneous results for virtually any genomics-based study due to reliance on the reference genome for read mapping (Li and Durbin 2009), primer design (Rozen and Skaletsky 2000), gene ontology analysis (Gene Ontology Consortium 2013), etc. In an attempt to minimize heterozygosity, more recent Anopheles genome projects obtained source DNA from the progeny of a single female (more extensive inbreeding was deemed infeasible). Unfortunately, genetic variation was still too high to produce assemblies that rival those of Drosophila despite similar genome sizes (Neafsey et al. 2013). Second, inbred lines would improve the performance of quantitative genetic studies, which have the potential to identify genetic polymorphisms that control key phenotypes of medical or ecological importance (e.g., Riehle et al. 2006; Blandin et al. 2009). Such studies are empowered by high variation between, but not within, experimental lines (Mackay et al. 2009).
Inbred lines in other Dipteran insects such as Aedes mosquitoes and Drosophila flies are common, relatively easy to produce, and highly useful in genetics and genomics studies (Nene et al. 2007; Mackay et al. 2012). However, no inbred lines for A. gambiae have ever been reported presumably due to the actual/perceived difficulty in creating such lines. To fill this gap, we set out to create an inbred line of A. gambiae that would enable genetic studies and, ultimately, improved vector control. Here, we report the first inbred line of A. gambiae and quantify the extent to which polymorphism was reduced through ten generations of full-sib inbreeding. Interestingly, genome-wide analyses identify multiple, large genomic regions that maintained unexpectedly high levels of heterozygosity. Similar qualitative results have been reported after extensive inbreeding in diverse eukaryotes including insects (Munstermann 1994; Rumball et al. 1994), mammals (Eriksson et al. 1976; Connor and Belucci 1979; Mina et al. 1991), mollusks (McGoldrick and Hedgecock 1997), and plants (Strauss 1986). In light of our data, we discuss the likely mechanism underlying the retention of diversity in inbred lines and plausible strategies for creating more highly inbred lines in A. gambiae.
Results
Inbreeding of Different Colonies
We attempted to inbreed five different colonies of A. gambiae through full-sib mating (see Materials and Methods) with variable results (table 1). Anopheles gambiae is composed of two ecologically and genetically divergent forms termed M and S (Lehmann and Diabate 2008; Costantini et al. 2009; Simard et al. 2009; Lawniczak et al. 2010). It has been proposed that these two forms should be elevated to species status (Coetzee et al. 2013), although gene flow between them still occurs at nonnegligible rates (Reidenbach et al. 2012; Weetman et al. 2012; Lee et al. 2013). Interestingly, we found that the S Form of A. gambiae was unamenable to inbreeding. We were unable to get even a single female from PIMPERENA, a Malian S Form colony, to lay eggs when isolated, despite the fact that females from this colony lay hundreds to thousands of eggs when kept en masse in a single cage. Although we did succeed in obtaining eggs from a single female of the S Form NDKO colony, none of her female progeny laid eggs resulting in the death of the line after just one generation.
Table 1.
Results of Attempted Inbreeding for Five Anopheles gambiae Colonies
| Colony | Form | Origin | Established | Generation | Issue |
|---|---|---|---|---|---|
| NDKO | S | Ndkayo, Cameroon | 2007 | 1 | Stopped laying eggs |
| PIMPERENA | S | Pimperena, Mali | 2005 | 0 | Would not lay eggs |
| YAOUNDE | M | Yaounde, Cameroon | 1991 | 10 | Stopped bloodfeeding |
| NGS | M | N’Gousso, Cameroon | 2007 | 20 | N/A |
| MALI-NIH | M | Niono, Mali | 2005 | 5 | Stopped laying eggs |
In contrast, we found that the M Form of A. gambiae was relatively amenable to inbreeding. Of the three colonies tested, all were successfully inbred for at least five generations and two of the three were inbred for ten generations or more. We had the greatest success with the NGS colony, which is still alive and currently on its 20th generation of full-sib mating. Our variable success with inbreeding is consistent with previous ecological analyses of niche partitioning between the two forms. Studies in Cameroon and Burkina Faso suggest that the M Form exploits marginal habitats (irrigated rice fields, polluted urban environments, and coastal areas) whereas the S Form dominates in canonical A. gambiae habitats (ephemeral puddles and pools) (Costantini et al. 2009; Simard et al. 2009; Gimonneau et al. 2012; Kamdem et al. 2012). Indeed, in our experiment the M Form was more robust and thrived in the relatively unsuitable (i.e., marginal) laboratory environment. Alternatively, the differential inbreeding success between M and S may not be related to ecology; instead, it could be due to fewer recessive deleterious alleles segregating in populations of M Form relative to S Form. While intriguing, the differential inbreeding success of M and S should not be overinterpreted as the number of colonies tested was relatively low and variance could potentially be due to chance alone. Larger sample sizes of both forms are needed to confirm the hypothesis.
The Overall Impact of Inbreeding on Polymorphism
To assess the decrease in polymorphism achieved by inbreeding the NGS colony, we genotyped 112 individual female mosquitoes—56 saved prior to the start of inbreeding and 56 collected after ten generations of inbreeding—at a genome-wide panel of single nucleotide polymorphisms (SNPs). To genotype individual mosquitoes in parallel, we employed a double-digest restriction-associated DNA (ddRAD) sequencing methodology (Peterson et al. 2012). Briefly, DNA from individual mosquitoes was extracted, digested with two restriction enzymes, barcoded, size selected, and polymerase chain reaction (PCR) amplified. The goal was to simultaneously sequence a representative and reproducible fraction of the genome from individual mosquitoes on the Illumina platform.
For the following analyses we only used SNPs genotyped in at least 16 individual mosquitoes from both the NGS and NGS INBRED groups leaving us with a total of 159,314 SNPs on the autosomes and 11,099 SNPs on the X. We observed a relatively even distribution of SNPs across the euchromatin of the autosomes, with a dip in SNP density at the heterochromatic centromeres (Sharakhova et al. 2010). Overall, the X chromosome exhibited a lower SNP frequency than the autosomes. The observed distribution of polymorphic sites is consistent with studies of nucleotide variation in natural populations (Lawniczak et al. 2010; White et al. 2010; Clarkson et al. 2014) suggesting that the ddRAD approach worked well in generating an unbiased, genome-wide panel of markers (fig. 1).
Fig. 1.—

The ddRADseq approach successfully generated a genome-wide panel of SNPs. The number of SNPs genotyped in at least 16 individuals from both NGS and NGS INBRED are plotted in 1-Mb bins across the genome.
Overall, 90,049 or 57% of the total autosomal SNPs went from polymorphic in NGS to monomorphic in NGS INBRED. Polymorphism was reduced to a greater extent on the autosomes than the X, where only 4,394 or 40% of the total SNPs went from polymorphic in NGS to monomorphic in NGS INBRED (figs. 2 and 3). Specifically, average values of π per SNP on the autosomes declined from 0.30 in NGS to 0.12 in NGS INBRED. On the X chromosome, π per SNP only declined from 0.25 in NGS to 0.16 in NGS INBRED. Figure 3 plots π for individual SNPs in NGS versus NGS INBRED. As expected and detailed above, most SNPs went from polymorphic in NGS to monomorphic in NGS INBRED. However, a cluster of SNPs in the upper right-hand corner remained persistently polymorphic in both the NGS and NGS INBRED lines. SNPs in this category may exhibit strong heterosis, recessive lethality, or be linked with such sites, explaining their persistence at a frequency of approximately 50%. Alternatively, a small fraction of apparently heterozygous SNPs may actually be due to mapping errors where reads from two different genomic regions map to a single locus due to incomplete or improper reference genome assembly. Surprisingly, 7,155 SNPs appear monomorphic in NGS, but polymorphic in NGS INBRED. These SNPs were likely at a low frequency in NGS, were not present in our sample of 56 individuals, and increased in frequency during the inbreeding process.
Fig. 2.—

Dramatic reductions in polymorphism are observed in the NGS INBRED line. The distribution of π for individual SNPs is plotted for the (A) NGS autosomes, (B) NGS X chromosome, (C) NGS INBRED autosomes, and (D) NGS INBRED X chromosome. Red lines denote the mean value of π.
Fig. 3.—
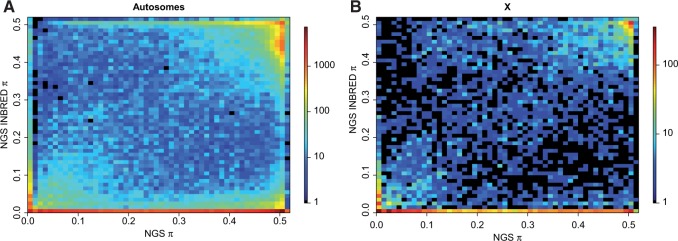
Most individual SNPs exhibit reduced polymorphism in NGS INBRED although both persistently polymorphic SNPs and SNPs with increased polymorphism exist. π values for individual SNPs in the NGS and NGS INBRED are plotted against each other for (A) the autosomes and (B) the X chromosome. The number of SNPs falling into each bin is denoted by the logarithmic color scale shown on the right.
Spatial Heterogeneity in Diversity Reduction
To compare polymorphism levels across the genome between NGS and NGS INBRED, we performed window-based analyses of π (fig. 4). Although diversity is markedly reduced in NGS INBRED relative to NGS in many regions, polymorphism levels nearly equal to those observed prior to inbreeding exist over discrete, large genomic intervals. For example, a region on 2L extending from 16 Mb proximal of the centromere all the way to the telomere shows only slightly reduced diversity in NGS INBRED. Another approximately 25-Mb region around the centromere of chromosome 3 shows little, if any, reduction in polymorphism. Inbreeding did not reduce π substantially in other smaller regions, such as near the telomere of 2R. The X chromosome shows a more spatially homogenous, albeit less dramatic, drop in diversity than the autosomes.
Fig. 4.—

Reductions in polymorphism are spatially heterogeneous across the genome. Black and red lines denote mean π for all SNPs in 1-Mb nonoverlapping windows across the genome for NGS and NGS INBRED, respectively. Boundaries of the 2La inversion are marked with a shaded box. Large, discrete blocks of both low and high nucleotide diversity in NGS INBRED are evident.
With an initial frequency of 50%, only 1/1,024 SNPs should remain polymorphic after ten generations of inbreeding. However, nearly half of all SNPs remained polymorphic in NGS INBRED. The persistently polymorphic sites are mostly found in large linkage blocks. Although linkage disequilibrium decays rapidly in natural populations of A. gambiae (Harris et al. 2010; Cheng et al. 2012; Marsden et al. 2014), within colonies longer haplotypes may exist which could plausibly explain the observed tracts of heterozygosity.
2La Inversion Analysis
The large block of nonreduced polymorphism on 2L overlaps with the position of a known polymorphic chromosomal inversion in A. gambiae. The 2La inversion extends from genomic position approximately 20000000 to 42000000 on 2L and the alternative arrangements are referred to as 2La (ancestral) and 2L+a (derived) (Sharakhov et al. 2006). The inversion segregates at a low frequency (∼5% 2La) in the Cameroonian region where the founder mosquitoes of the NGS colony were collected (Wondji et al. 2005; Simard et al. 2009). In natural populations, the inversion is always found at Hardy–Weinberg equilibrium (Toure et al. 1998; Powell et al. 1999; Costantini et al. 2009; Simard et al. 2009). To determine whether polymorphism of the 2La inversion was the cause of the large diversity block on 2L, we molecularly determined inversion status for the 56 NGS and 56 NGS INB that we sequenced. Prior to inbreeding the 2La arrangement was segregating at a frequency of 45% (13 2L+a/+a; 36 2La/+a; 7 2La/a) in the colony. After inbreeding the 2La arrangement had increased in frequency to 68% (3 2L+a/+a; 30 2La/+a; 23 2La/a), but not to fixation. We have previously shown high divergence between alternative arrangements of 2La with Fst values routinely exceeding 0.5 (White, Hahn, et al. 2007; Cheng et al. 2012). Thus, if persistently polymorphic in a population, the regions captured by the inversion should display high levels of polymorphism.
To determine the effect of the segregating inversion on diversity, we performed window-based analyses of π for the three different karyotypes present in NGS and NGS INBRED (fig. 5). As expected diversity within homokaryotypes (2L+a or 2La) is near zero in NGS INBRED, but heterokaryotypes have high diversity. Thus, we conclude that persistence of the 2La inversion explains the large block of high diversity on the left arm of chromosome 2. Interestingly, when we perform window-based analyses of π on NGS individuals 2L+a homokaryotypes show markedly higher diversity than 2La homokaryotypes in the rearranged region (fig. 6). This pattern likely results from the colony being founded from eggs laid by multiple female mosquitoes from a population with a high frequency of the 2L+a arrangement. In contrast, the other blocks of extended heterozygosity do not overlap with known inversions. However, the second largest diversity block straddles the centromere of chromosome 3, a region of presumed low recombination that may functionally segregate as a single locus. Similar to the case for the 2La inversion, two divergent “centromere haplotypes” may be segregating in NGS and neither was lost through inbreeding.
Fig. 5.—

Polymorphism of the 2La inversion is responsible for the large block of polymorphism on NGS INBRED chromosome 2L. Different colored lines denote mean π for all SNPs in 1-Mb stepping windows across the genome for the three different karyotypes present in NGS INBRED. Boundaries of the 2La inversion are marked with a shaded box. Note the dramatic difference in polymorphism between heterokaryotypes and homokaryotypes.
Fig. 6.—

The NSG colony was founded from mosquitoes mostly carrying the 2L+a arrangement. Different color lines denote mean π for all SNPs in 1-Mb stepping windows across the genome for the three different karyotypes present in NGS. Boundaries of the 2La inversion are marked with a shaded box. Note the clear difference in polymorphism between alternative homokaryotypes.
Discussion
We successfully subjected a colony of A. gambiae to full-sib mating for ten generations, dramatically reducing diversity across the genome. However, discrete blocks of the genome retained high diversity. Under neutrality, the vast majority of polymorphisms should have been eliminated during inbreeding: in the absence of linkage and selection, an SNP with an initial frequency of 50% should become monomorphic greater than 99.9% of the time after ten generations of full-sib mating.
Associative Overdominance
Previous studies of allozyme markers in inbred lines of a variety of organisms including Aedes mosquitoes (Matthews and Craig 1987; Munstermann 1994), Culex mosquitoes (Knop et al. 1987), Drosophila (Sing et al. 1973; Frankham et al. 1993; Rumball et al. 1994), chicken (Mina et al. 1991), mouse (Connor and Belucci 1979), oyster (McGoldrick and Hedgecock 1997), pine tree (Strauss 1986), rat (Eriksson et al. 1976), and Tribolium beetles (Yeh 1972) reported patterns similar to ours. In these studies, heterozygosity at a portion of protein markers persisted at much higher rates than expected during inbreeding. Associative overdominance has often been invoked to explain the discrepancy between the expected and actual efficiency of inbreeding (Rumball et al. 1994; Wang and Hill 1999). During inbreeding, individuals will necessarily differ in their degree of homozygosity across the genome (Weir and Cockerham 1973). At some loci, natural selection will strongly favor heterozygotes due the presence of either recessive deleterious mutations or overdominant polymorphisms (Ohta 1971; Ohta and Cockerham 1974; Strobeck 1979; Charlesworth 1991; Wang and Hill 1999). Loci where natural selection favors heterozygotes will thus remain polymorphic even in the face of inbreeding. Additionally, neutral loci linked to the polymorphism(s) under balancing selection will also exhibit elevated polymorphism (Santiago and Caballero 1995; Nordborg et al. 1996). Tighter linkage will cause longer persistence of polymorphism due to the rarity of recombination between the neutral loci and overdominant polymorphism. Computational simulations of full-sib inbreeding show that observed diversity at allozyme loci in Drosophila melanogaster inbred lines is consistent with the expected effects of associative overdominance (Rumball et al. 1994; Wang and Hill 1999). However, because these previous studies only employed a handful of markers definitive evidence for associative overdominance was lacking.
A dense set of genome-wide markers allows us to clearly implicate associative overdominance as the mechanism underlying the retention of diversity in the NGS INBRED line of A. gambiae. Associative overdominance theory makes two clear predictions regarding the spatial patterns of diversity across the genome of an inbred line. First, heterozygous sites should be clustered in linked, genomic intervals. Second, the size of the high-diversity blocks should negatively correlate with recombination rate (Ohta 1971; Ohta and Cockerham 1974; Wang and Hill 1999). Our analysis strongly supports both predictions. Genome-wide analyses revealed heterogeneity in diversity levels across the genome with discrete chromosomal intervals of high polymorphism. The two largest blocks of high diversity are located in regions of low recombination. One is an approximately 25-Mb region roughly centered on the centromere of chromosome 3—pericentromeric regions in A. gambiae have highly reduced recombination rates (Pombi et al. 2006; Slotman et al. 2006; Stump et al. 2007). The second large region overlaps the 2La inversion. Although recombination in inversion homokaryotypes is not reduced, gene flux between alterative arrangements is highly suppressed (Stump et al. 2007). Consistent with associative overdominance, our analysis demonstrated that the presence of alternative karyotypes is responsible for elevated polymorphism in NGS INBRED on chromosome 2L (Strobeck 1983).
However, our results do not meet all theoretical expectations of associative overdominance. Simulations also predict that heterogametic sex chromosomes should homogenize faster than the autosomes. Our results displayed the opposite pattern; the autosomes showed larger declines in diversity than the X chromosome. However, it should be noted that the predicted differences in homogenization rates are small and stochastic forces can cause results from a single study to deviate massively from the prediction (Wang and Hill 1999).
Creating More Homozygous Lines
Overall, our results suggest that producing isogenic or nearly isogenic lines of A. gambiae will be difficult, but certain steps can be taken to maximize the effectiveness of inbreeding. First, inbreeding for many generations will reduce the size of heterozygous linkage blocks by providing more opportunity for recombination to break the association between neutral and overdominant loci (Latter et al. 1995). Identifying inversion polymorphisms and selecting for homokayrotypic lines prior to inbreeding will also aid recombination in breaking up linkage blocks. Finally, our results from the S Form colonies PIMPERENA and NDKO suggest the possibility of social cues playing a role in oviposition. When caged en masse, females from these colonies will readily lay eggs. However, when isolated we were generally unable to induce females from either colony to oviposit. Although the literature does not provide any evidence of social cues in oviposition, it would be worthwhile to place lone gravid females into cages with males and sterilized (irradiated) females and determine whether the oviposition rate increased. Overall, there does not appear to be any intrinsic barriers to successfully inbreeding A. gambiae. Although we lost four of the five inbred lines we started, this rate is not qualitatively different from that observed in large-scale D. melanogaster inbreeding experiments (Garcia et al. 1994; Rumball et al. 1994). Although an 80% loss rate is quite tolerable in Drosophila due to the ease of maintenance, the large amount of labor involved in rearing A. gambiae makes this loss rate more burdensome. In summary, although NGS INBRED contains more polymorphism than would be ideal, its lowered diversity makes it an important tool for vector biologists. Further improvement to the line can be achieved through continued inbreeding and, if possible, direct selection for a homokayrotypic arrangement of the 2La inversion.
Sequencing Strategies for Evolutionary Genetics
In our experiment, reduced-representation sequencing was a cost-effective alternative to whole-genome sequencing (WGS); indeed, it is very unlikely that WGS data would have provided any additional insights. Furthermore, it is worth highlighting the benefit of using barcodes to sequence individual mosquitoes rather than pooled DNA (“pool-seq,” e.g., Zhu et al. 2012). To this point, we could have sequenced two pools of individual mosquitoes: NGS and NGS INBRED. Although we would have obtained similar insights into the levels and spatial heterogeneity of polymorphism with pooled data, we would have been unable to retroactively determine the 2La karyotype of each individual. Evolutionary genomicists should weigh the costs and benefits of sequencing individuals versus performing pooled sequencing in the future as individual sequencing provides flexibility when addressing unexpected results.
Materials and Methods
Mosquito Inbreeding
Mosquitoes were maintained in the University of California Riverside insectaries under standard conditions (White et al. 2013). Prior to inbreeding the colony was maintained in our insectaries for 6 months with an approximate size of 600 individuals per generation with roughly equal number of males and females. Inbreeding of the NGS colony was accomplished through a full-sib mating scheme. To initiate the inbred line, NGS mosquitoes were allowed to emerge en masse and mate for 7 days after which female mosquitoes were offered a blood meal. Polyandry is very rare in natural populations of A. gambiae (Tripet et al. 2003), but can be marginally higher in laboratory colonies (Gomulski 1990). On the next day, five blood fed females were removed from the colony and placed into individual 250-ml cups. To induce oviposition, each cup had approximately 50 ml of ddH2O and was lined with a strip of wet-strength filter paper. After two nights, the cups were checked and eggs were synchronously hatched. Larvae from each female were reared in 1 l of ddH2O under standard conditions (White et al. 2013). Only the isofemale line that produced the most pupae was retained. The same inbreeding process was reiterated each subsequent generation on the adult progeny of one female. Inbreeding of other colonies followed the same protocol, except for PIMPERENA where additional females (15 total) were isolated in an attempt to start the inbreeding process.
Library Preparation
Our genotyping-by-sequencing (GBS) protocol is a slightly modified version of the ddRAD protocol designed by Peterson et al. (2012). The goal is to simultaneously sequence a reduced, yet highly reproducible, portion of the genome from individual mosquitoes. First, mosquito DNA is extracted in 96-well plate format using the ZR-96 Quick-gDNA kit (Zymo Corporation, San Diego, CA). DNA is eluted in 35 µl ddH2O, 5 µl (∼50 ng) of which is subsequently used for GBS library preparation. DNA from individual mosquitoes is then digested at 37 °C for 3 h with two restriction enzymes, MluC1 and NlaIII (New England Biolabs, Ipswich, MA). The digested DNA is purified using Ampure magnetic beads (Beckman Coulter, Brea, CA). For each individual, a barcoded adapter (1 of 48) is ligated to the sticky end produced by NlaIII, whereas a universal adapter is ligated to the sticky end produced by MluC1. Adapters are ligated to DNA fragments with T4 DNA ligase (NEB) for 2 h at 22 °C, heat killed at 65 °C, and allowed to cool to room temperature at a rate of 1 °/min. Adapter sequences are given in supplementary table S1, Supplementary Material online. Ligation reactions from up to 48 individuals with unique barcodes are then pooled together. To concentrate and clean the pooled DNA for size selection, it is subjected to two rounds of Ampure magnetic bead purification resulting in a final volume of 30 µl. Next, the pooled DNA is loaded onto a Blue Pippin (Sage Science, Beverly, MA) and narrow size selection is performed with a target of 400 bp. Size-selected DNA is then directly used as a template for PCR amplification. Each library contains up to 48 individuals and can be amplified with a unique, indexed primer allowing for multiple libraries to be pooled in a single lane. PCR reactions consisted of 1× NEB Q5 PCR Buffer, 10 mM each DNTP, 20 pmol of both the universal and indexed primer, 0.25 U NEB Q5 polymerase, and 4 µl of size-selected template. Reaction conditions were 98 °C for 1 min, ten cycles of 98 °C for 8 s, 68 °C for 20 s, and 72 °C for 20 s, followed by a final extension at 72 °C for 2 min. Eight separate PCR reactions were run for each library and pooled to avoid bias in the final library. Primer sequences are given in supplementary table S2, Supplementary Material online. A detailed protocol for library preparation can be found at mosquitogenomics.org/protocols.
For this experiment, single-end, 100-bp sequencing was performed on 48 individuals from each group (NGS and NGS INB) using the Illumina HiSeq2500 at the UCR Genomics Core (a total of 288 individuals were multiplexed in this lane). The remaining eight individuals from each group were subjected to paired-end, 100-bp sequencing on a HiSeq2500 (a total of 96 individuals were multiplexed in this lane). As our pipeline filters out any SNPs found in less than 16 individuals from both lines (see below), none of the second-pair reads were retained for analysis. The additional mosquitoes sequenced in the aforementioned lanes were part of a different project.
Data Processing and Analysis
Each barcode/adapter is a minimum of three mutational steps away from any other barcode/adapter. Thus, sequencing reads were assigned to individuals based on adapter and barcode sequence, allowing up to one mismatch in each sequence. After assigning reads to individuals, reads were mapped against the A. gambiae PEST reference genome using Burrow-Wheelers Alignment (Li and Durbin 2009) with n = 8 and otherwise default parameters. After mapping, BAM files for all NGS and NGS INBRED mosquitoes were merged and genotypes were called in parallel for individuals using the GATK program with default parameters (McKenna et al. 2010). A custom perl script extracted individual genotype information from the resulting vcf file and calculated per site π. Indels (insertions and deletions) and multiallelic (>2) SNPs were excluded from polymorphism analysis due to difficulties in reliably calling genotypes from short-read sequencing data. After filtering, mean coverage per individual was 5.10× for NGS INB and 4.21× for NGS with an average of 2.86 SNPs per ddRAD fragment. Spatial patterns of diversity were investigated by averaging π for each SNP in nonoverlapping 1-Mb windows across the genome. Results were robust to varying window sizes (data not shown).
2La Inversion Typing
The 2La inversion karyotype for individual mosquitoes was determined in two different ways. First, each individual was karyotyped using a molecular PCR diagnostic that spans the inversion breakpoints (White, Santolamazza, et al. 2007). Second, STRUCTURE (Hubisz et al. 2009; Pritchard et al. 2000) was run with k = 2 using genotype information from each individual for all SNPs between the 2La breakpoints. STRUCTURE uses a Bayesian approach to assign a probability that each individual belongs to certain populations (k) defined by the user. Groups correlating with 2La homokaryotypes (∼100% likelihood of assignment to population 1), 2L+a homokaryotypes (∼100% likelihood of assignment to population 2), and heterokaryotypes (∼50% likelihood of assignment to both populations) were readily identified. The PCR karyotype and the STRUCTURE karyotype agreed for all individual mosquitoes except two. For these two individuals, the STRUCTURE karyotype was used for downstream analysis as the PCR reaction has previously produced occasional false-calls (White, Santolamazza, et al. 2007; Obbard et al. 2009).
Supplementary Material
Supplementary tables S1 and S2 are available at Genome Biology and Evolution online (http://www.gbe.oxfordjournals.org/).
Acknowledgments
This project was funded by the University of California Riverside, Mosquito Research Foundation Grant #2013-19, and NIH 1R01AI113248 all to B.J.W. We acknowledge Nora Besansky, Carlo Costantini, Paul Howell, Marcy Kern, Tovi Lehmann, and Isabelle Morlais for establishing colonies and providing mosquito eggs. We thank James Ricci and Raissa Green for assistance with mosquito rearing. We appreciate the work of John Weger and Glenn Hicks in optimizing on-machine conditions for running ddRAD libraries on the HiSeq2500. Insightful comments from four anonymous reviewers substantially improved the manuscript. The following reagents were obtained through the MR4 as part of the BEI Resources Repository, NIAID, NIH: Anopheles gambiae Mali-NIH M Form, MRA-860, deposited by Tovi Lehmann >> Nora Besansky and Anopheles gambiae Pimperena S Form, MRA-861, deposited by Nora Besansky.
Literature Cited
- Beaty BJ, et al. From Tucson to genomics and transgenics: The Vector Biology Network and the emergence of modern vector biology. PLoS Negl Trop Dis. 2009;3:e343. doi: 10.1371/journal.pntd.0000343. [DOI] [PMC free article] [PubMed] [Google Scholar]
- Benedict MQ. Care and maintenance of anopheline mosquito colonies. In: Crampton JM, Beard BC, Louis C, editors. The molecular biology of insect disease vectors. the Netherlands: Springer; 1997. pp. 3–12. [Google Scholar]
- Benedict MQ, et al. Colonisation and mass rearing: learning from others. Malar J. 2009;8:S4. doi: 10.1186/1475-2875-8-S2-S4. [DOI] [PMC free article] [PubMed] [Google Scholar]
- Blandin SA, et al. Dissecting the genetic basis of resistance to malaria parasites in Anopheles gambiae. Science. 2009;326:147–150. doi: 10.1126/science.1175241. [DOI] [PMC free article] [PubMed] [Google Scholar]
- Charlesworth D. The apparent selection on neutral marker loci in partially inbreeding populations. Genet Res. 1991;57:159–175. [Google Scholar]
- Cheng C, et al. Ecological genomics of Anopheles gambiae along a latitudinal cline: a population-resequencing approach. Genetics. 2012;190:1417–1432. doi: 10.1534/genetics.111.137794. [DOI] [PMC free article] [PubMed] [Google Scholar]
- Clarkson CS, et al. Adaptive introgression between Anopheles sibling species eliminates a major genomic island but not reproductive isolation. Nat Commun. 2014;5:5248. doi: 10.1038/ncomms5248. [DOI] [PMC free article] [PubMed] [Google Scholar]
- Coetzee M, et al. Anopheles coluzzii and Anopheles amharicus, new members of the Anopheles gambiae complex. Zootaxa. 2013;3619:246–274. [PubMed] [Google Scholar]
- Collins FH, Paskewitz SM. Malaria: current and future prospects for control. Annu Rev Entomol. 1995;40:195–219. doi: 10.1146/annurev.en.40.010195.001211. [DOI] [PubMed] [Google Scholar]
- Coluzzi M, Sabatini A, Della Torre A, Di Deco MA, Petrarca V. A polytene chromosome analysis of the Anopheles gambiae species complex. Science. 2002;298:1415–1418. doi: 10.1126/science.1077769. [DOI] [PubMed] [Google Scholar]
- Connor JL, Belucci MJ. Natural selection resisting inbreeding depression in captive wild housemice (Mus musculus) Evolution. 1979;33(3):929–940. doi: 10.1111/j.1558-5646.1979.tb04747.x. [DOI] [PubMed] [Google Scholar]
- Costantini C, et al. Living at the edge: biogeographic patterns of habitat segregation conform to speciation by niche expansion in Anopheles gambiae. BMC Ecol. 2009;9:16. doi: 10.1186/1472-6785-9-16. [DOI] [PMC free article] [PubMed] [Google Scholar]
- della Torre A, Merzagora L, Powell JR, Coluzzi M. Selective introgression of paracentric inversions between two sibling species of the Anopheles gambiae complex. Genetics. 1997;146:239–244. doi: 10.1093/genetics/146.1.239. [DOI] [PMC free article] [PubMed] [Google Scholar]
- Eriksson K, Halkka O, Lokki J, Saura A. Enzyme polymorphism in feral, outbred and inbred rats (Rattus norvegicus) Heredity. 1976;37:341–349. doi: 10.1038/hdy.1976.98. [DOI] [PubMed] [Google Scholar]
- Frankham R, Smith G, Briscoe D. Effects on heterozygosity and reproductive fitness of inbreeding with and without selection on fitness in Drosophila melanogaster. Theor Appl Genet. 1993;86:1023–1027. doi: 10.1007/BF00211056. [DOI] [PubMed] [Google Scholar]
- Garcia N, Lopez-Fanjul C, Garcia-Dorado A. The genetics of viability in Drosophila melanogaster: effects of inbreeding and artificial selection. Evolution. 1994;48(4):1277–1285. doi: 10.1111/j.1558-5646.1994.tb05312.x. [DOI] [PubMed] [Google Scholar]
- Gene Ontology Consortium. Gene Ontology annotations and resources. Nucleic Acids Res. 2013;41:D530–D535. doi: 10.1093/nar/gks1050. [DOI] [PMC free article] [PubMed] [Google Scholar]
- Gimonneau G, et al. Larval habitat segregation between the molecular forms of the mosquito Anopheles gambiae in a rice field area of Burkina Faso, West Africa. Med Vet Entomol. 2012;26:9–17. doi: 10.1111/j.1365-2915.2011.00957.x. [DOI] [PMC free article] [PubMed] [Google Scholar]
- Gomulski L. Polyandry in nulliparous Anopheles gambiae mosquitoes (Diptera: Culicidae) Bull Entomol Res. 1990;80:393–396. [Google Scholar]
- Harris C, Rousset F, Morlais I, Fontenille D, Cohuet A. Low linkage disequilibrium in wild Anopheles gambiae s.l. populations. BMC Genet. 2010;11:81. doi: 10.1186/1471-2156-11-81. [DOI] [PMC free article] [PubMed] [Google Scholar]
- Holt RA, et al. The genome sequence of the malaria mosquito Anopheles gambiae. Science. 2002;298:129–149. doi: 10.1126/science.1076181. [DOI] [PubMed] [Google Scholar]
- Hubisz MJ, Falush D, Stephens M, Pritchard JK. Inferring weak population structure with the assistance of sample group information. Mol Ecol Resour. 2009;9:1322–1332. doi: 10.1111/j.1755-0998.2009.02591.x. [DOI] [PMC free article] [PubMed] [Google Scholar]
- Hunter P. The paradox of model organisms. EMBO Rep. 2008;9:717–720. doi: 10.1038/embor.2008.142. [DOI] [PMC free article] [PubMed] [Google Scholar]
- Kamdem C, et al. Anthropogenic habitat disturbance and ecological divergence between incipient species of the malaria mosquito Anopheles gambiae. PLoS One. 2012;7:e39453. doi: 10.1371/journal.pone.0039453. [DOI] [PMC free article] [PubMed] [Google Scholar]
- Knop NF, Asman SM, Reisen WK, Milby MM. Changes in the biology of Culex tarsalis (Diptera: Culicidae) associated with colonization under contrasting regimes. Environ Entomol. 1987;16:405–414. [Google Scholar]
- Latter B, Mulley J, Reid D, Pascoe L. Reduced genetic load revealed by slow inbreeding in Drosophila melanogaster. Genetics. 1995;139:287–297. doi: 10.1093/genetics/139.1.287. [DOI] [PMC free article] [PubMed] [Google Scholar]
- Lawniczak MK, et al. Widespread divergence between incipient Anopheles gambiae species revealed by whole genome sequences. Science. 2010;330:512–514. doi: 10.1126/science.1195755. [DOI] [PMC free article] [PubMed] [Google Scholar]
- Lee Y, et al. Spatiotemporal dynamics of gene flow and hybrid fitness between the M and S forms of the malaria mosquito, Anopheles gambiae. Proc Natl Acad Sci U S A. 2013;110:19854–19859. doi: 10.1073/pnas.1316851110. [DOI] [PMC free article] [PubMed] [Google Scholar]
- Lehmann T, Diabate A. The molecular forms of Anopheles gambiae: a phenotypic perspective. Infect Genet Evol. 2008;8:737–746. doi: 10.1016/j.meegid.2008.06.003. [DOI] [PMC free article] [PubMed] [Google Scholar]
- Li H, Durbin R. Fast and accurate short read alignment with Burrows–Wheeler transform. Bioinformatics. 2009;25:1754–1760. doi: 10.1093/bioinformatics/btp324. [DOI] [PMC free article] [PubMed] [Google Scholar]
- Mackay TF, et al. The Drosophila melanogaster genetic reference panel. Nature. 2012;482:173–178. doi: 10.1038/nature10811. [DOI] [PMC free article] [PubMed] [Google Scholar]
- Mackay TF, Stone EA, Ayroles JF. The genetics of quantitative traits: challenges and prospects. Nat Rev Genet. 2009;10:565–577. doi: 10.1038/nrg2612. [DOI] [PubMed] [Google Scholar]
- Marsden CD, et al. Diversity, differentiation, and linkage disequilibrium: prospects for association mapping in the malaria vector Anopheles arabiensis. G3. 2014;4:121–131. doi: 10.1534/g3.113.008326. [DOI] [PMC free article] [PubMed] [Google Scholar]
- Matthews T, Craig G., Jr Heterozygosity in inbred strains of the tree-hole mosquito Aedes triseriatus. Biochem Genet. 1987;25:647–655. doi: 10.1007/BF00556209. [DOI] [PubMed] [Google Scholar]
- McGoldrick DJ, Hedgecock D. Fixation, segregation and linkage of allozyme loci in inbred families of the Pacific oyster Crassostrea gigas (Thunberg): implications for the causes of inbreeding depression. Genetics. 1997;146:321–334. doi: 10.1093/genetics/146.1.321. [DOI] [PMC free article] [PubMed] [Google Scholar]
- McKenna A, et al. The Genome Analysis Toolkit: a MapReduce framework for analyzing next-generation DNA sequencing data. Genome Res. 2010;20:1297–1303. doi: 10.1101/gr.107524.110. [DOI] [PMC free article] [PubMed] [Google Scholar]
- Miklos GLG, Rubin GM. The role of the genome project in determining gene function: insights from model organisms. Cell. 1996;86:521–529. doi: 10.1016/s0092-8674(00)80126-9. [DOI] [PubMed] [Google Scholar]
- Mina N, Sheldon B, Yoo B, Frankham R. Heterozygosity at protein loci in inbred and outbred lines of chickens. Poult Sci. 1991;70:1864–1872. doi: 10.3382/ps.0701864. [DOI] [PubMed] [Google Scholar]
- Morlais I, Ponçon N, Simard F, Cohuet A, Fontenille D. Intraspecific nucleotide variation in Anopheles gambiae: new insights into the biology of malaria vectors. Am J Trop Med Hyg. 2004;71:795–802. [PubMed] [Google Scholar]
- Mpofu S, Masendu H, Kanyimo K, Mtetwa C. Laboratory colonization of Anopheles quadriannulatus from sympatry with other sibling species of the Anopheles gambiae complex in Zimbabwe. Med Vet Entomol. 1993;7:122–126. doi: 10.1111/j.1365-2915.1993.tb00664.x. [DOI] [PubMed] [Google Scholar]
- Munstermann LE. Unexpected genetic consequences of colonization and inbreeding: allozyme tracking in Culicidae (Diptera) Ann Entomol Soc Am. 1994;87:157–164. [Google Scholar]
- Neafsey DE, et al. The evolution of the Anopheles 16 genomes project. G3. 2013;3:1191–1194. doi: 10.1534/g3.113.006247. [DOI] [PMC free article] [PubMed] [Google Scholar]
- Nene V, et al. Genome sequence of Aedes aegypti, a major arbovirus vector. Science. 2007;316:1718–1723. doi: 10.1126/science.1138878. [DOI] [PMC free article] [PubMed] [Google Scholar]
- Nordborg M, Charlesworth B, Charlesworth D. The effect of recombination on background selection. Genet Res. 1996;67:159–174. doi: 10.1017/s0016672300033619. [DOI] [PubMed] [Google Scholar]
- Norris DE, Shurtleff AC, Toure YT, Lanzaro GC. Microsatellite DNA polymorphism and heterozygosity among field and laboratory populations of Anopheles gambiae ss (Diptera: Culicidae) J Med Entomol. 2001;38:336–340. doi: 10.1603/0022-2585-38.2.336. [DOI] [PubMed] [Google Scholar]
- Obbard DJ, Welch JJ, Little TJ. Inferring selection in the Anopheles gambiae species complex: an example from immune-related serine protease inhibitors. Malar J. 2009;8:117. doi: 10.1186/1475-2875-8-117. [DOI] [PMC free article] [PubMed] [Google Scholar]
- Ohta T. Associative overdominance caused by linked detrimental mutations. Genet Res. 1971;18:277–286. [PubMed] [Google Scholar]
- Ohta T, Cockerham CC. Detrimental genes with partial selfing and effects on a neutral locus. Genet Res. 1974;23:191–200. doi: 10.1017/s0016672300014816. [DOI] [PubMed] [Google Scholar]
- Peterson BK, Weber JN, Kay EH, Fisher HS, Hoekstra HE. Double digest RADseq: an inexpensive method for de novo SNP discovery and genotyping in model and non-model species. PLoS One. 2012;7:e37135. doi: 10.1371/journal.pone.0037135. [DOI] [PMC free article] [PubMed] [Google Scholar]
- Pombi M, Stump AD, Della Torre A, Besansky NJ. Variation in recombination rate across the X chromosome of Anopheles gambiae. Am J Trop Med Hyg. 2006;75:901–903. [PubMed] [Google Scholar]
- Powell JR, Petrarca V, della Torre A, Caccone A, Coluzzi M. Population structure, speciation, and introgression in the Anopheles gambiae complex. Parassitologia. 1999;41:101–113. [PubMed] [Google Scholar]
- Pritchard JK, Stephens M, Donnelly P. Inference of population structure using multilocus genotype data. Genetics. 2000;155:945–959. doi: 10.1093/genetics/155.2.945. [DOI] [PMC free article] [PubMed] [Google Scholar]
- Reidenbach KR, et al. Patterns of genomic differentiation between ecologically differentiated M and S forms of Anopheles gambiae in West and Central Africa. Genome Biol Evol. 2012;4:1202–1212. doi: 10.1093/gbe/evs095. [DOI] [PMC free article] [PubMed] [Google Scholar]
- Riehle MM, et al. Natural malaria infection in Anopheles gambiae is regulated by a single genomic control region. Science. 2006;312:577–579. doi: 10.1126/science.1124153. [DOI] [PubMed] [Google Scholar]
- Rozen S, Skaletsky HJ. Primer3 on the WWW for general users and for biologist programmers. In: Krawetz S, Misener S, editors. Bioinformatics methods and protocols: methods in molecular biology. Totowa (NJ): Humana Press; 2000. pp. 365–386. [DOI] [PubMed] [Google Scholar]
- Rubin GM, et al. Comparative genomics of the eukaryotes. Science. 2000;287:2204–2215. doi: 10.1126/science.287.5461.2204. [DOI] [PMC free article] [PubMed] [Google Scholar]
- Rumball W, Franklin I, Frankham R, Sheldon B. Decline in heterozygosity under full-sib and double first-cousin inbreeding in Drosophila melanogaster. Genetics. 1994;136:1039–1049. doi: 10.1093/genetics/136.3.1039. [DOI] [PMC free article] [PubMed] [Google Scholar]
- Santiago E, Caballero A. Effective size of populations under selection. Genetics. 1995;139:1013–1030. doi: 10.1093/genetics/139.2.1013. [DOI] [PMC free article] [PubMed] [Google Scholar]
- Sharakhov IV, et al. Breakpoint structure reveals the unique origin of an interspecific chromosomal inversion (2La) in the Anopheles gambiae complex. Proc Natl Acad Sci U S A. 2006;103:6258–6262. doi: 10.1073/pnas.0509683103. [DOI] [PMC free article] [PubMed] [Google Scholar]
- Sharakhova MV, et al. Update of the Anopheles gambiae PEST genome assembly. Genome Biol. 2007;8:R5. doi: 10.1186/gb-2007-8-1-r5. [DOI] [PMC free article] [PubMed] [Google Scholar]
- Sharakhova MV, et al. Genome mapping and characterization of the Anopheles gambiae heterochromatin. BMC Genomics. 2010;11:459. doi: 10.1186/1471-2164-11-459. [DOI] [PMC free article] [PubMed] [Google Scholar]
- Simard F, et al. Ecological niche partitioning between the M and S molecular forms of Anopheles gambiae in Cameroon: the ecological side of speciation. BMC Ecol. 2009;9:17. doi: 10.1186/1472-6785-9-17. [DOI] [PMC free article] [PubMed] [Google Scholar]
- Sing CF, Brewer GJ, Thirtle B. Inherited biochemical variation in Drosophila melanogaster: noise or signal? I. Single-locus analyses. Genetics. 1973;75:381–404. doi: 10.1093/genetics/75.2.381. [DOI] [PMC free article] [PubMed] [Google Scholar]
- Slotman MA, et al. Reduced recombination rate and genetic differentiation between the M and S forms of Anopheles gambiae s.s. Genetics. 2006;174:2081–2093. doi: 10.1534/genetics.106.059949. [DOI] [PMC free article] [PubMed] [Google Scholar]
- Strauss SH. Heterosis at allozyme loci under inbreeding and crossbreeding in Pinus attenuata. Genetics. 1986;113:115–134. doi: 10.1093/genetics/113.1.115. [DOI] [PMC free article] [PubMed] [Google Scholar]
- Strobeck C. Partial selfing and linkage: the effect of a heterotic locus on a neutral locus. Genetics. 1979;92:305–315. doi: 10.1093/genetics/92.1.305. [DOI] [PMC free article] [PubMed] [Google Scholar]
- Strobeck C. Expected linkage disequilibrium for a neutral locus linked to a chromosomal arrangement. Genetics. 1983;103:545–555. doi: 10.1093/genetics/103.3.545. [DOI] [PMC free article] [PubMed] [Google Scholar]
- Stump AD, et al. Genetic exchange in 2La inversion heterokaryotypes of Anopheles gambiae. Insect Mol Biol. 2007;16:703–709. doi: 10.1111/j.1365-2583.2007.00764.x. [DOI] [PubMed] [Google Scholar]
- Toure YT, et al. The distribution and inversion polymorphism of chromosomally recognized taxa of the Anopheles gambiae complex in Mali, West Africa. Parassitologia. 1998;40:477–511. [PubMed] [Google Scholar]
- Tripet F, Toure YT, Dolo G, Lanzaro GC. Frequency of multiple inseminations in field-collected Anopheles gambiae females revealed by DNA analysis of transferred sperm. Am J Trop Med Hyg. 2003;68:1–5. [PubMed] [Google Scholar]
- Wang J, Hill WG. Effect of selection against deleterious mutations on the decline in heterozygosity at neutral loci in closely inbreeding populations. Genetics. 1999;153:1475–1489. doi: 10.1093/genetics/153.3.1475. [DOI] [PMC free article] [PubMed] [Google Scholar]
- Weetman D, Wilding CS, Steen K, Pinto J, Donnelly MJ. Gene flow-dependent genomic divergence between anopheles gambiae M and S forms. Mol Biol Evol. 2012;29:279–291. doi: 10.1093/molbev/msr199. [DOI] [PMC free article] [PubMed] [Google Scholar]
- Weir B, Cockerham CC. Mixed self and random mating at two loci. Genet Res. 1973;21:247–262. doi: 10.1017/s0016672300013446. [DOI] [PubMed] [Google Scholar]
- White BJ, Cheng C, Simard F, Costantini C, Besansky NJ. Genetic association of physically unlinked islands of genomic divergence in incipient species of Anopheles gambiae. Mol Ecol. 2010;19:925–939. doi: 10.1111/j.1365-294X.2010.04531.x. [DOI] [PMC free article] [PubMed] [Google Scholar]
- White BJ, Collins FH, Besansky NJ. Evolution of Anopheles gambiae in relation to humans and malaria. Annu Rev Ecol Evol Syst. 2011;42:111–132. [Google Scholar]
- White BJ, et al. Dose and developmental responses of Anopheles merus larvae to salinity. J Exp Biol. 2013;216:3433–3441. doi: 10.1242/jeb.087189. [DOI] [PMC free article] [PubMed] [Google Scholar]
- White BJ, Hahn MW, et al. Localization of candidate regions maintaining a common polymorphic inversion (2La) in Anopheles gambiae. PLoS Genet. 2007;3:e217. doi: 10.1371/journal.pgen.0030217. [DOI] [PMC free article] [PubMed] [Google Scholar]
- White BJ, Santolamazza F, et al. Molecular karyotyping of the 2La inversion in Anopheles gambiae. Am J Trop Med Hyg. 2007;76:334–339. [PubMed] [Google Scholar]
- Windbichler et al. A synthetic homing endonuclease-based gene drive system in the human malaria mosquito. Nature. 2011;473:212–215. doi: 10.1038/nature09937. [DOI] [PMC free article] [PubMed] [Google Scholar]
- Wondji C, et al. Species and populations of the Anopheles gambiae complex in Cameroon with special emphasis on chromosomal and molecular forms of Anopheles gambiae s.s. J Med Entomol. 2005;42:998–1005. doi: 10.1093/jmedent/42.6.998. [DOI] [PubMed] [Google Scholar]
- Yeh F. Inbreeding as a control of biochemical polymorphism in populations of Tribolium castaneum. Can J Genet Cytol. 1972;14(3):741. [Google Scholar]
- Zhu Y, Bergland AO, González J, Petrov DA. Empirical validation of pooled whole genome population re-sequencing in Drosophila melanogaster. PLoS One. 2012;7:e41901. doi: 10.1371/journal.pone.0041901. [DOI] [PMC free article] [PubMed] [Google Scholar]
Associated Data
This section collects any data citations, data availability statements, or supplementary materials included in this article.