Summary
Cys-loop receptors are neurotransmitter-gated ion channels that are essential mediators of fast chemical neurotransmission and are associated with a large number of neurological diseases and disorders, as well as parasitic infections1–4. Members of this ion channel superfamily mediate excitatory or inhibitory neurotransmission depending on their ligand and ion selectivity. Structural information for Cys-loop receptors comes from several sources including electron microscopic studies of the nicotinic acetylcholine receptor 5, high resolution x-ray structures of extracellular domains6 and x-ray structures of bacterial orthologs 7–10. In 2011 our group published structures of the Caenorhabditis elegans glutamate-gated chloride channel (GluCl) in complex with the allosteric partial agonist, ivermectin, which provided insights into the structure of a possibly open state of a eukaryotic Cys-loop receptor, the basis for anion selectivity and channel block, and the mechanism by which ivermectin and related molecules stabilize the open state and potentiate neurotransmitter binding11. However, there remain unanswered questions about the mechanism of channel opening and closing, the location and nature of the shut ion channel gate, the transitions between the closed/resting, open/activated and closed/desensitized states, and the mechanism by which conformational changes are coupled between the extracellular, orthosteric agonist binding domain and the transmembrane, ion channel domain. Here we present two conformationally distinct structures of GluCl in the absence of ivermectin. Structural comparisons reveal a quaternary activation mechanism arising from rigid body movements between the extracellular and transmembrane domains and a mechanism for modulation of the receptor by phospholipids.
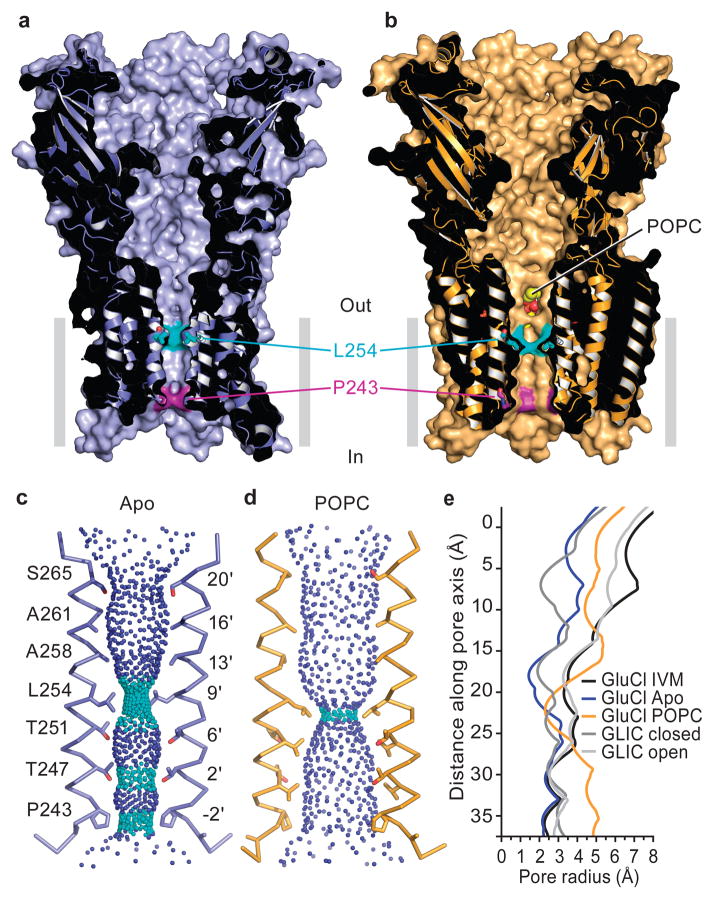
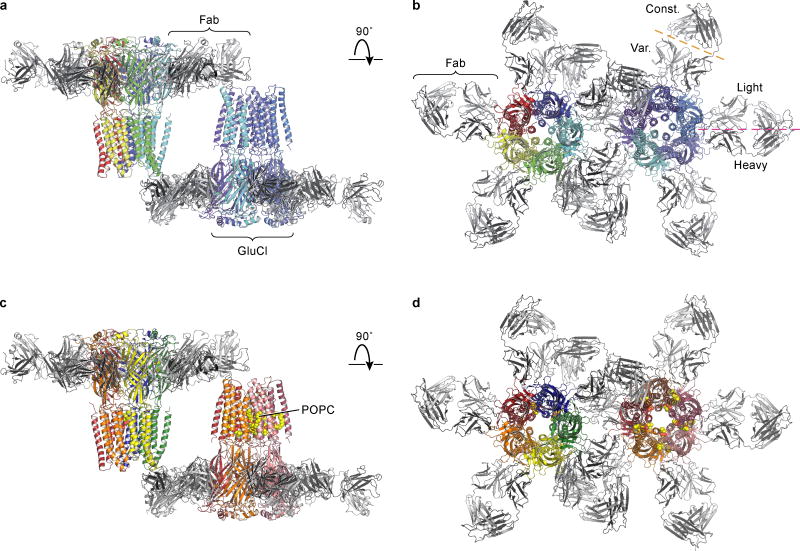
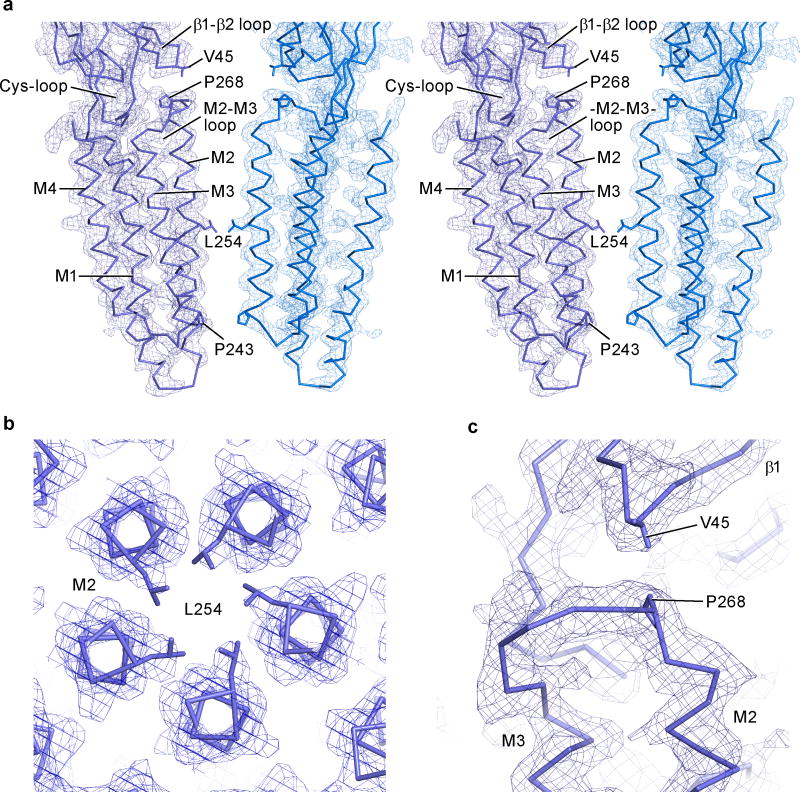
We obtained three-dimensional crystals of GluCl in the absence of ivermectin by supplementing the previously characterized receptor-Fab complex11 with 1-palmitoyl-2-oleoyl-sn-glycero-3-phosphocholine (POPC) and either setting up crystallizations immediately or after a four week incubation, which yielded an apo state or a POPC-bound conformation, respectively. The structures of GluCl in an apo state or in complex with POPC show a solvent-accessible pathway from the outermost region of the extracellular domain, through the vase-shaped extracellular vestibule, to the transmembrane ion channel pore (Fig. 1a,b; Extended Data Figure 1; Extended Data Table 1). The ion channel pore is lined by the M2 transmembrane helices, with Pro 243 and Leu 254 occupying key sites at the cytoplasmic and middle portion of the ion channel. In the POPC complex, we visualized lipid molecules bound between subunits, near the extracellular side of the transmembrane domain, with their head groups wedged between the M1 and M3 helices of adjacent subunits (Fig. 1b, Extended Data Figure 1c,d).
Figure 1. Apo and POPC-bound GluCl.
a, Sagittal slice along the pore axis of the apo GluCl structure showing the solvent accessible surface and underlying secondary structure. b, Sagittal slice through the pore of GluCl in complex with POPC, similar to panel (a). Atoms of the POPC head group are visible through a fenestration between adjacent subunits. c, Solvent contours of the transmembrane pore of the apo GluCl pore showing the M2 helices of subunits P and R and the side chains of pore-lining residues, numbered according to protein sequence and position in the M2 helix. Small blue spheres define a radius > 2.8 Å and cyan spheres represent a radius of 1.4 – 2.8 Å. d, Contours of the POPC-bound pore, similar to panel (c). e, Illustration of the pore radii as a function of distance along the pore axis for apo, POPC- and ivermectin-bound GluCl, along with the open and closed states of GLIC (PDB codes 3EAM and 4NPQ). Pore radii in panels c–e were calculated using the computer program “HOLE”. IVM, ivermectin.
In the apo state the M2 helices are nearly parallel to the pore axis with three narrow regions at Pro 243, Thr 247 and Leu 254 (Fig. 1c). The pore is most constricted at Leu 254 (Leu 9′ on the M2, pore-lining helix), with the hydrophobic side chain of the leucine residue restricting the pore radius to ~1.4 Å, too small for the conduction of chloride ions, suggesting that Leu 254 forms the shut gate of the ion channel pore (Extended Data Figure 2)12, 13. Previous observations that mutation of Leu 9′ perturbs ion channel gating are in harmony with the hypothesis that Leu 9′ plays an important role in channel function14–16. We suggest that this apo structure of GluCl defines the closed/resting state of this eukaryotic Cys-loop receptor.
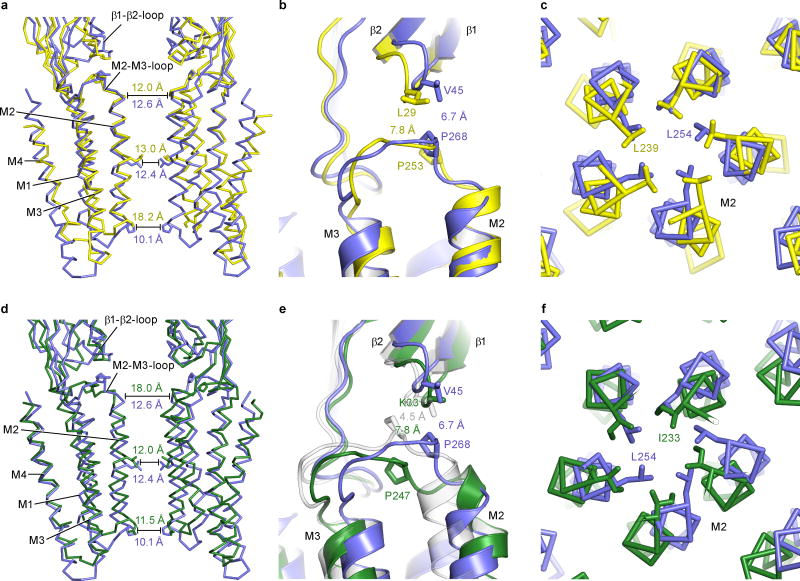
In the POPC-bound structure, the ion channel pore is also straight, yet wider than in the apo state, with a constriction at Leu 254 yielding a pore radius of ~2.4 Å (Fig. 1d), similar in size to the narrow region of the pore in the ivermectin-bound state. Comparisons of the pore radii of the apo and ivermectin bound states of GluCl with ELIC (Erwinia chrysanthemi ligand-gated ion channel) and GLIC (Gloeobacter violaceuos ligand-gated ion channel)7–10 show how the dimensions are remarkably similar near the cytoplasmic region of the pore, yet diverge substantially at the extracellular entrance (Fig. 1e; Extended Data Figure 3). While the position of the shut gate in the ‘closed’ GLIC structure is similar to that of apo GluCl, the pore of GLIC is narrower in comparison to the pore of GluCl in the area extracellular to the gate. Additional studies are required to define the ion conducting properties of both the ivermectin and POPC-bound states of GluCl.
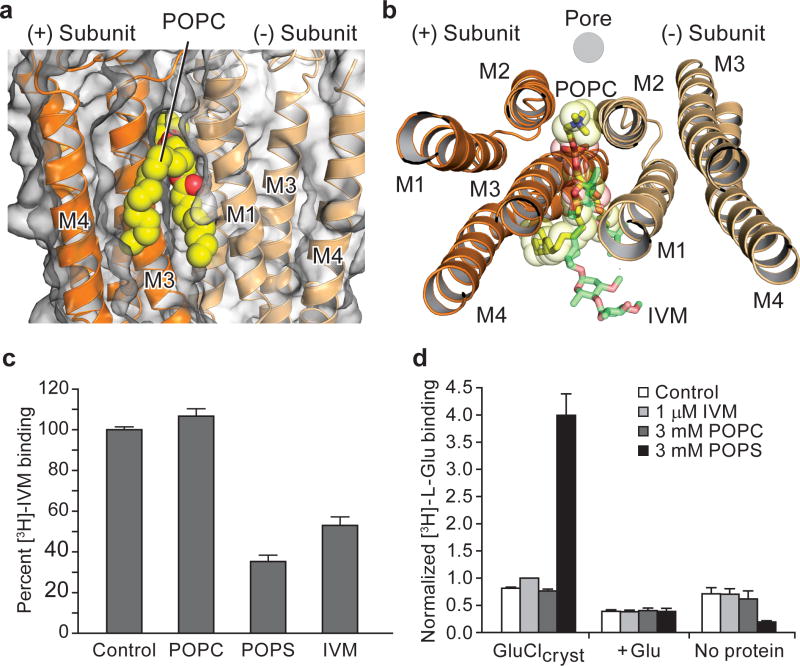
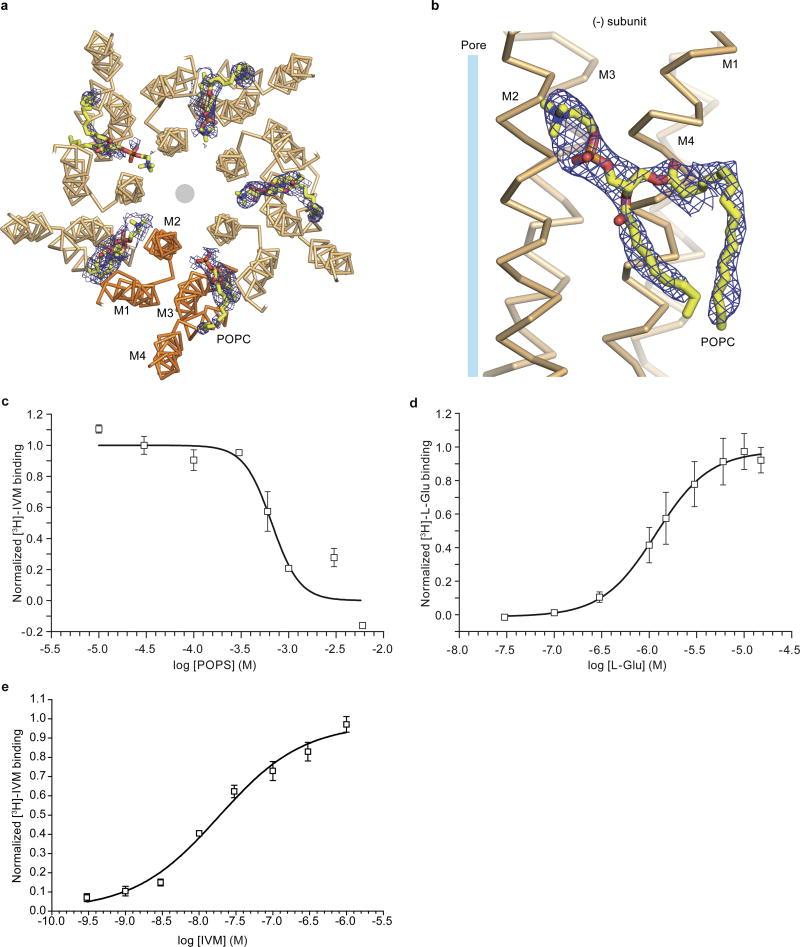
Inspection of electron density maps derived from GluCl crystals grown in the presence of POPC following a ~4 week incubation with lipid revealed prominent densities located between transmembrane segments M1 and M3 of adjacent subunits in 8 of the 10 subunit interfaces in the asymmetric unit (Extended Data Figure 4a,b). We modeled these densities as POPC molecules with the phosphocholine head group pointing towards the center of the pore and the two alkyl tails located on the periphery of the transmembrane domain (Fig. 2a,b and Extended Data Figure 4a,b). The region occupied by POPC molecules overlaps with the ivermectin site derived from the GluCl-ivermectin complex (Fig. 2b) 11, a binding pocket that recent molecular dynamics simulations also identified as an intersubunit crevice transiently occupied by, on average, four lipid molecules per pentamer 17.
Figure 2. Phospholipids occupy intersubunit site, compete with ivermectin and potentiate glutamate binding.
a, POPC binding site, lodged between M1 and M3 helices of adjacent subunits viewed parallel (a) and perpendicular (b) to the membrane. In (b) we show the location of the pore by a gray circle and the overlap between POPC and ivermectin (shown in ‘sticks’ representation). c, Radioligand competition experiment using GluCl and [3H]-ivermectin (control) and cold POPC, POPS or ivermectin (IVM). d, POPS potentiates glutamate binding as demonstrated by a [3H]-L-glutamate binding experiment in the presence of POPC, POPS or ivermectin. Bars are normalized to the extent of binding in the presence of ivermectin. For panels c–d, experiments were carried out 3 separate times, with experiments done in triplicate. Points are mean values and error bars represent s.e.m.
We screened several lipids in binding assays, finding that 1-palmitoyl-2-oleoyl-sn-glycero-3-phosphoserine (POPS) competes for ivermectin binding with an inhibition constant (Ki) of ~167 μM (Fig. 2c; Extended Data Figure 4c,e). Unfortunately POPS, while binding strongly, does not yield well-diffracting crystals whereas POPC binds weakly and does not measurably compete for ivermectin binding. We therefore used POPS in binding experiments and POPC in the structural studies. POPS potentiates glutamate binding (Fig. 2d), like ivermectin (dissociation constant (Kd) for L-glutamate in presence of ivermectin is ~0.66 μM)11, yielding a Kd for glutamate binding of ~1.1 μM (Extended Data Figure 4d). Thus, ivermectin or lipids can occupy the intersubunit crevice within the membrane-spanning region of the receptor and potentiate neurotransmitter binding, providing insight into the long-standing observation of small molecule and lipid modulation of agonist binding in Cys-loop receptors18, 19.
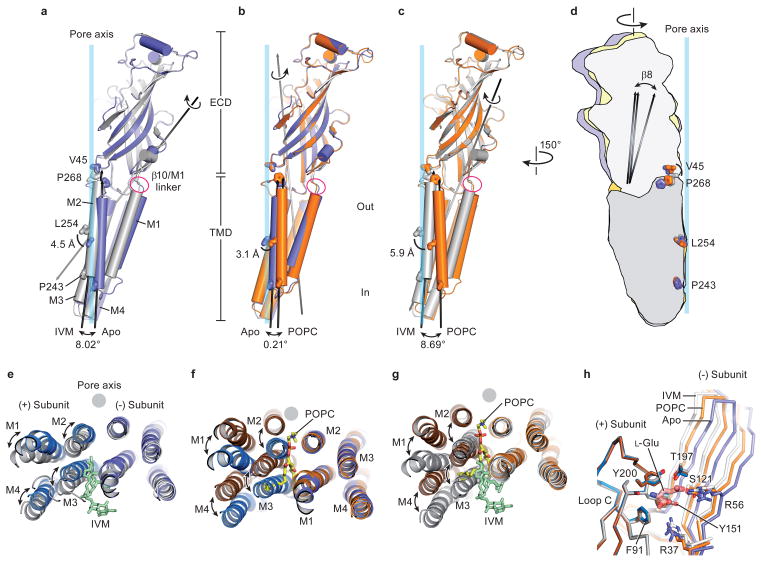
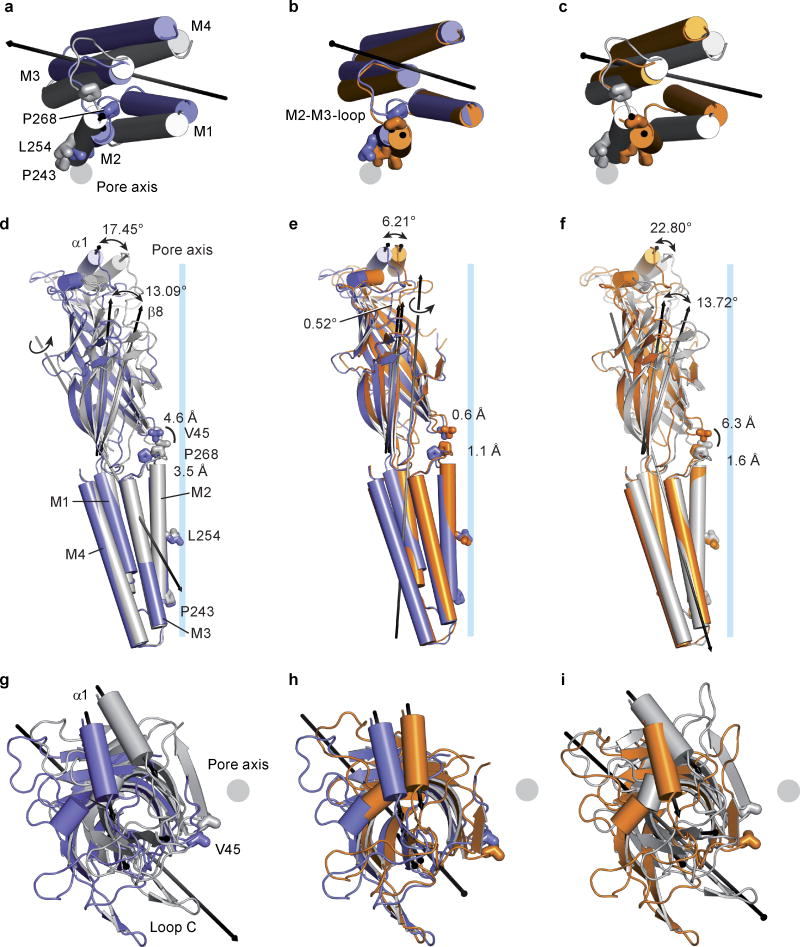
Superpositions of individual subunits from the apo, POPC- and ivermectin-bound states demonstrate that the extracellular and transmembrane domains move largely as rigid bodies, undergoing movements relative to one another (Extended Data Fig. 5). Thus, superposition of the extracellular domain from a single subunit of the apo and ivermectin-bound structures shows that, during activation by ivermectin, the transmembrane domain undergoes a screw-axis like movement, rotating around an axis tipped about 40° off the pore axis and shifting towards the extracellular side of the membrane by ~4.5 Å. Transition from the apo to the ivermectin-bound state thereby involves tilting of the pore-lining M2 helix by ~8° ‘away’ from the ion channel, which relieves the occlusion of the pore by Leu 254 (Fig. 3a and Extended Data Figure 6).
Figure 3. Conformational changes of extracellular and transmembrane domains.
a–c Superpositions of residues 1–211 of the extracellular domains illustrate a screw-axis like conformational change within GluCl subunits. a, Superposition of apo (blue) and IVM (gray) subunits, (b) apo and POPC (orange) subunits and (c) POPC and IVM subunits. Panel (d) illustrates relative conformational changes within subunits when the transmembrane domains are superposed, using residues 212–342, and the same color coding as in panels a–c. e, Superposition of transmembrane domains of the (−) subunits for the apo and ivermectin structures, illustrating relative movements of (+) transmembrane domain. View is from the extracellular side. f, Similar superposition as in panel (e) for the apo and POPC structures and (g) for the POPC and ivermectin structures. h, Neurotransmitter binding site is more open in the apo state in comparison to the POPC and ivermectin states. Superposition of residues in the extracellular domain of the (+) subunit illustrates the relative displacement of residues contributing to the neurotransmitter binding site on the (−) subunit, including Arg 37 and Arg56, in the apo (blue), POPC (orange) and ivermectin (gray) states. The POPC-bound state represents an intermediate position between the apo and ivermectin-bound states.
The conformations stabilized by ivermectin and by POPC are strikingly different. In comparing the apo and POPC-bound states, the transmembrane domain undergoes a rotation about an axis approximately parallel to the pore, which in turn gives rise to a displacement by ~3 Å ‘away’ from the pore axis in the plane of the membrane. Together these movements lead to an expansion of the ion channel pore while the M2 helices remain oriented parallel to the pore axis (Fig. 3b). A comparison of the ivermectin- and POPC-bound states shows a large relative movement of the extracellular and transmembrane domains, with the M2 helix undergoing a tilt by ~8.7° and a translational movement of ~6 Å (Fig. 3c). Participating in these relative movements of the extracellular and transmembrane domains is the name-sake Cys-loop, which is cradled in a concave depression on ‘top’ of the transmembrane helices, stabilized by interactions that include the β10/M1 covalent connection and the interface between the β1/β2 and M2/M3 loops (Fig. 3a–c)5, 20.
Superpositions of the transmembrane domains of the apo, POPC- and ivermectin-bound structures further illustrate the relative conformational changes between the extracellular and transmembrane domains (Fig. 3d and Extended Data Figure 6). Here we observe mainly two movements: the upper part of the extracellular domain, as marked by the α1 helix twists around the pore axis, and the lower part, as exemplified by the β8 strand, tilts towards the center of the pore. For both movements, displacements are largest for the transition to the ivermectin-bound state. Loop C does not close the neurotransmitter binding site by an independent motion but closure is rather a consequence of the rigid body twist of the extracellular domain of each subunit. While the observed closure of loop C is mechanistically distinct from that observed in AChBP21, 22, it is consistent with classic biochemical studies of nicotinic receptors wherein agonist binding results in protection of the tip of loop C from reducing reagents23.
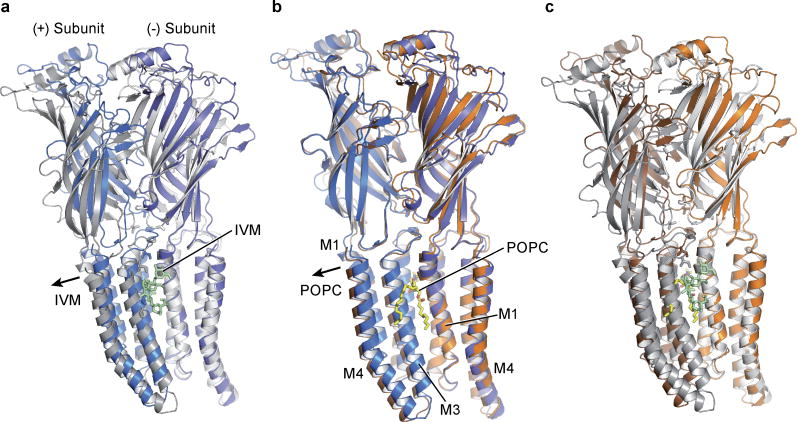
To visualize the conformational changes associated with ivermectin binding, we superimposed the transmembrane domains of the (−) subunits for the apo and ivermectin states (Extended Data Figure 7). Inspection of the transmembrane helices in the (+) subunit shows that in the apo state the space between the M3 and M1 helices of the (+) and the (−) subunits is ‘collapsed’ (Fig. 3e). When ivermectin inserts into this site, helices M1-M4 undergo a counterclockwise rotation of ~10° relative to the pore axis, ‘splaying open’ the intersubunit interface. This movement increases the α-carbon distance between Leu 218 (M1) and Gly 281 (M3), the latter of which is crucial for ivermectin sensitivity24, from ~6.9 Å in the apo state to ~9.3 Å in the ivermectin complex. The M2/M3 loop not only participates in direct contacts with ivermectin via Ile 27311, but it also connects helix M3 of the ivermectin site with helix M2 of the ion channel pore, thus providing a direct coupling for the binding of ivermectin with the tilting of the M2 helix ~4 Å away from the 5-fold axis and opening of the pore.
In comparison to ivermectin, the longer POPC head group inserts deeply into the intersubunit crevice. Thus, analysis of the POPC complex relative to the apo state shows that transmembrane segments of the (+) subunit undergo a greater displacement in comparison to the ivermectin complex, with the (+) transmembrane bundle moving ~5.7 Å toward the ion channel pore (Fig. 3f; Extended Data Figure 7). Nevertheless, the separation between subunits is similar to the ivermectin complex, as measured by the 9.4 Å distance between the α-carbons of residues Leu 218 (M1; (−) subunit) and Gly 281 (M3; (+) subunit).
A remarkable plasticity of the transmembrane domains is demonstrated by comparison of the ivermectin and POPC complexes (Extended Data Figure 7). Here, superposition of the transmembrane regions of the (−) subunit shows that the transmembrane bundle of the (+) subunit from the POPC complex moves ~8.8 Å ‘away’ from the ion channel pore. This shift of nearly the diameter of an α-helix results in the (+) M3 helix occupying the position of the (+) M2 helix in the ivermectin complex, thus showing how, in these two complexes, M2 replaces M3 at the interface with M2 of the (−) subunit (Fig. 3g).
To analyze the changes at the orthosteric glutamate binding site we superimposed the extracellular domains of the (+) subunit, a facet of the pocket that harbors multiple elements of the agonist binding site, including an aromatic box closed by loop C6, 11, 21. Following this superposition, we see that the β-strands on the (−) subunit shift closer to the (+) subunit in the POPC and ivermectin complexes, with the largest shift seen in the ivermectin-bound state (Fig. 3h). These shifts close the binding pocket, moving key residues towards the (+) subunit and thereby, we speculate, strengthening neurotransmitter binding. Consistent with this notion is our earlier observation that, like ivermectin, POPC binding potentiates binding of glutamate. Indeed, in the ivermectin-bound conformation the α-carbon atoms of Ser 121 and Arg 56 move by 2.2 Å and 2.5 Å, respectively, from their positions in the apo state (Fig. 3h). The positions of neurotransmitter-binding residues in the POPC complex are intermediate between their respective positions in the apo and ivermectin complex, thus providing an explanation of how lipids, such as POPS, might potentiate neurotransmitter binding.
The extracellular and transmembrane domains are covalently connected by the β10/M1 linker yet they also interact via contacts between the β1/β2 loop and the M2/M3 loop as well as contacts between the Cys-loop and the extracellular ends of the transmembrane helices. Indeed, the M2/M3 linker, the β1/β2 loop and the Cys-loop are “hot spots” of non-covalent bonds and steric interactions that have been extensively studied20, 25, 26. During channel opening, as defined by the transition from the apo to the ivermectin-bound state, the M2/M3 loop shifts by more than 5 Å away from the ion channel pore, as visualized by the movement of Pro 268 of the M2/M3 loop passing beneath Val 45 on the β1/β2 loop (Fig. 4a,b). In the ivermectin-bound conformation, Val 45 is lodged against Pro 268, thus providing a steric block on the M2/M3 loop and, in turn, stabilizing the M2 and M3 helices and the entire transmembrane domain in an open pore conformation27. Furthermore, Pro 268 is strictly conserved throughout the family of Cys-loop receptors and mutations of this residue, as well as others nearby, have profound effects on the channel gating and desensitization behavior1, 28.
Figure 4. The M2/M3 loop couples conformational changes between the transmembrane and extracellular domains.
a, Superposition of the transmembrane region of the (−) subunits for the apo (blue) and ivermectin (gray) states illustrates the relative movement of the transmembrane domains and the M2/M3 loop of the neighboring (+) subunit. b, Same superposition as in panel (a), viewed approximately parallel to the membrane, showing the coupled movement of the β1/β2 loop and the M2/M3 loop, emphasizing key residues Val 45, Pro 268 and Ile 273. c, d, Illustration of key residues forming hydrogen bonds and a salt bridge that connects the transmembrane and extracellular domains in the apo structure seen from two directions approximately parallel to the membrane. No salt bridge is formed between the pre-M1 linker and the β1/β2 loop (d).
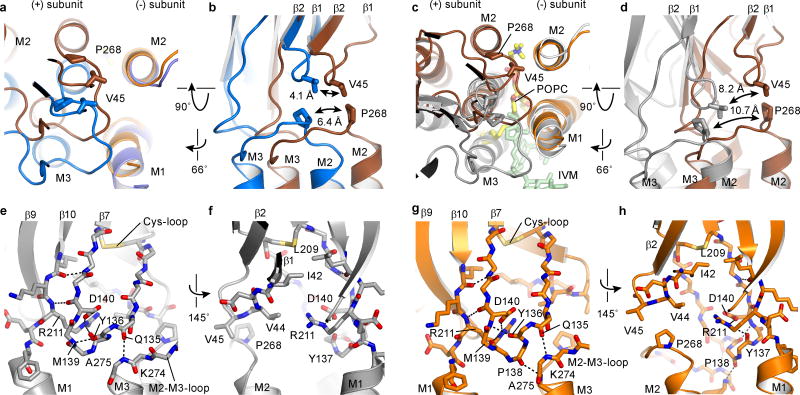
The extracellular end of the M3 helix interacts with the Cys-loop via a hydrogen bond between the carbonyl oxygens of Gln 135 and Pro 138 and the amide nitrogens of Lys 274 and Ala 275, respectively (Fig. 4c). The Cys-loop itself is also stabilized by a backbone hydrogen bond between Tyr 136 and Met 139 and is coupled to the extracellular end of the M1 helix by a hydrogen bond between backbone atoms of Asp 140 and Arg 211, a salt bridge between the side chains of Arg 211 and Asp 140 and the carbonyl oxygen of Tyr 137, as well as interactions between strands β7 and β10 (Fig. 4c,d)29. All these interactions remain intact in the three GluCl conformations (Extended Data Fig. 8). Through this route movements of the M1 helix can be directly transmitted to the M3 helix in the same subunit. Additionally, changes in the transmembrane domain can be transmitted to the (+) side of the ligand binding site via the β7 and β10 strands. Nevertheless, we do not find evidence for a direct coupling between the β10/M1 linker and β1/β2 loop as in the bacterial orthologs7 and in the acetylcholine receptor 30. Because the charged amino acids in the β1/β2 loop are replaced by Val 44 in GluCl, no salt bridge with Arg 211 can be formed (Fig. 4d).
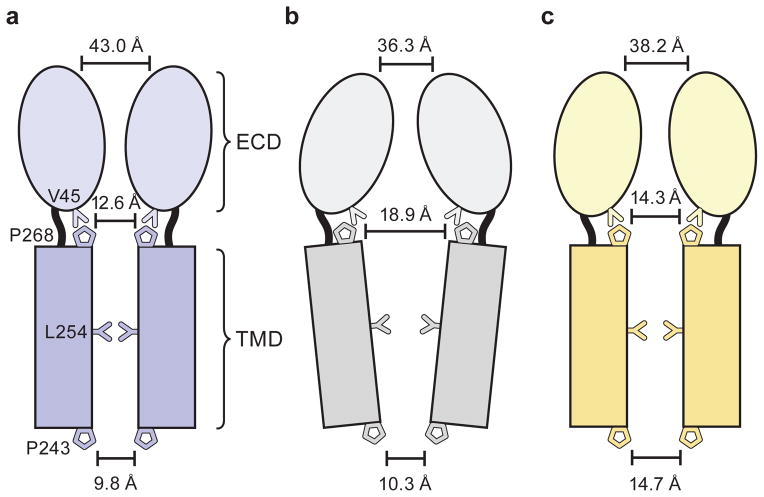
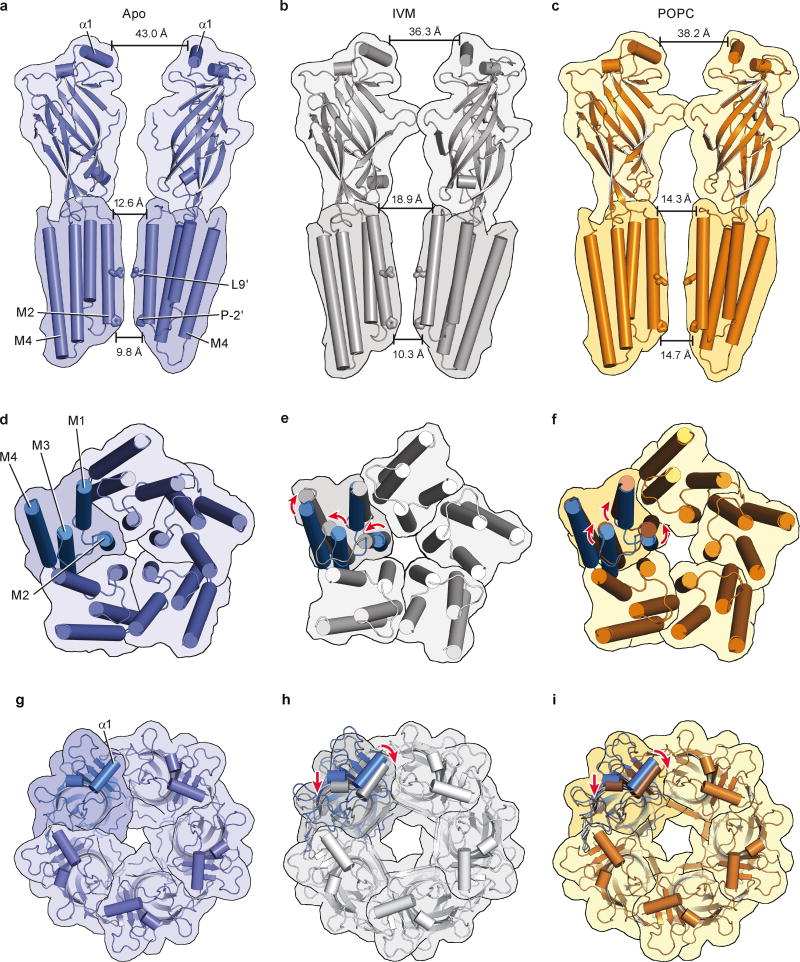
Global superpositions of pentamers from the apo, ivermectin and POPC-bound states illustrate quaternary conformational differences (Fig. 5; Extended Data Figure 9; Extended Data Movies 1 and 2). In the apo state the extracellular domains are separated by ~43 Å as measured at Thr 11 in helix 1 in two opposing subunits. The M2 helices are straight and oriented perpendicular to the plane of the membrane with distances of 12.6 Å at Ser 265 (pore apex) and 9.8 Å at Pro 243 (pore base) and the pore is occluded by the side chains of Leu 254. In the ivermectin- and POPC-bound states the upper parts of the extracellular domains tilt towards the pore in a motion resembling the closure of a blossom. The distances at helix 1 shrink to 36.3 Å in the ivermectin-bound state and to 38.2 Å in the POPC-bound conformation (Extended Data Figure 9a–c). The changes in the transmembrane domain are markedly different between the ivermectin- and the lipid-bound conformations. In the former case the M2 helices tilt away from the 5-fold axis and the distance at the pore apex increases to 18.9 Å while it remains nearly constant at the intracellular side. Helices M3 and M4 rotate clockwise around the center of the helix bundle resulting in an apparent overall clockwise rotation of the whole TM domain of the receptor. In contrast, during the transition from the apo to the POPC-bound state the M2 helices undergo a clockwise twist around the pore axis increasing the distance to 14.3 Å and 14.7 Å (pore apex and base), thus remaining straight. This quaternary structural change leads to an iris-like opening of the pore and causes M1 and M3 to be displaced in a counterclockwise rotation with little displacement of M4 (Extended Data Figure 9d–f).
Figure 5. Conformational changes in the pentamer.
a–c, Schematic illustration of the conformations of the apo-closed (a), ivermectin (b) and POPC-bound (c) states as seen in the plane of the membrane.
We hypothesize that the structures of GluCl in the apo and ivermectin-bound forms represent the closed/resting state and a potentially open/activated state of a eukaryotic Cys-loop receptor, respectively, showing how the shut ion channel gate is defined by a hydrophobic belt of 5 leucine residues and how the possible opening of the ion channel pore involves the outward tilting of approximately straight M2 transmembrane helices and the inward contraction of the extracellular domain (Figure 5a–c). Accompanying these quaternary changes is a ‘bend/twist’ of each subunit at the junction of the extracellular/transmembrane domain boundary, where the name-sake Cys-loop acts like a ball in the socket of the extracellular end of the transmembrane domain, interactions further stabilized by the β10/M1 connection and by interactions between the M2/M3 and β1/β2 loops. The GluCl-POPC complex demonstrates how lipids can allosterically modulate Cys-loop receptor function, inducing an expanded, open-like conformation of the transmembrane domain and potentiating agonist binding. Taken together, these studies provide motivation for future experiments and insight into the gating, modulation and structural plasticity of eukaryotic Cys-loop receptors.
Methods
GluCl construct, expression, purification and complex with Fab
The GluClcryst protein construct, a version of the C. elegans GluClα ion channel (Genbank accession code AAA50785.1) with truncated termini and the M3/M4 loop replaced by a three-amino acid linker, the method of its expression in baculovirus-infected Sf 9 insect cells and the preparation of the anti-GluCl Fab were performed as previously described 11. The GluCl pentamer was extracted from membranes with n-dodecyl-β-D-maltopyranoside (C12M), purified by Co2+ metal ion affinity chromatography, combined with the Fab and further purified by size exclusion chromatography in a buffer composed of 20 mM Tris (pH 7.4), 150 mM NaCl and 1 mM C12M. Fractions containing the receptor-Fab complex were pooled and concentrated to 1–2 mg/ml.
Crystallization and cryoprotection
Prior to crystallization the GluCl-Fab complex was slowly stirred in the presence of 1-palmitoyl-2-oleoyl-sn-glycero-3-phosphocholine (POPC) lipid (2.6 mg/ml) and additional C12M detergent (13 mg/ml) at 4 °C for 14 hr31. Following incubation of the protein with lipid, the mixture was clarified by centrifugation prior to crystallization. Crystals of the of GluClcryst-Fab complex were grown by hanging drop vapor diffusion at 4 °C using a reservoir solution composed of 50 mM sodium citrate pH 5.5, 35–36% pentaerythritol propoxylate (5/4 PO/OH), and 100 mM potassium chloride. The crystals were directly flash frozen in liquid nitrogen. Crystals of the apo GluCl-Fab complex were produced by immediately setting up crystallization drops after treatment of the complex with lipid and detergent whereas crystals of the POPC complex were grown after the GluCl-Fab-lipid complex had been stored at 4°C for 4 weeks.
Data collection
Diffraction data sets were collected at beam line 24-ID-C at the Advanced Photon Source synchrotron, Argonne National Laboratory, using crystal pins mounted on a mini-Kappa goniometer. Diffraction data were measured from different regions on single crystals using the in-house data collection strategy software. The best-ordered crystals for the apo dataset have a diffraction limit of 3.6 Å and the crystals for the apo-POPC complex diffracted to 3.2 Å resolution (Extended Data Table 1). Diffraction data sets were indexed, integrated and scaled using HKL200032 or XDS 33 software together with the microdiffraction assembly method 34.
Structure determination
The structures were initially solved by molecular replacement using Phaser35 with the pentameric GluClcryst–Fab complex (PDB code 3RHW) 11 as a search probe, yielding a robust solution with 2 pentameric complexes in the asymmetric unit of a C2 unit cell. Electron density maps were improved by density modification that included solvent flattening and averaging that exploited the 10-fold non-crystallographic symmetry (NCS). Phases were extended from 6 Å to the resolution of the data sets without phase combination using the computer program DM36. The model was refined by a rigid body fit of the transmembrane domain in PHENIX37 and Coot 38 applying 10-fold NCS operations to the receptor chains. As with the original structure of the GluCl-Fab complex11, the constant domains of the Fabs did not obey the 10-fold symmetry and were not constrained to the 10-fold NCS. Models were improved by iterative rounds of restrained reciprocal space refinement using PHENIX and manual adjustment in Coot guided by simulated annealing composite omit electron density maps. In the final stages of refinement, we defined four separate regions of the apo complex that were each allowed independent 10-fold NCS axes: GluClcryst, (residues 1–300), GluClcryst (residues 314–340 or 342), heavy chain Fab variable domains (residues 1–120), and light chain Fab variable domains (residues 1–108). The POPC complex was refined with three NCS groups: GluClcryst, (residues 1–342), heavy chain Fab variable domains (residues 1–120), and light chain Fab variable domains (residues 1–108). Isotropic B factors with one group per residue and translation/libration/screw (TLS) parameters39 were also refined; the 30 TLS groups comprised 10 receptor subunits, 10 Fab variable domains, and 10 Fab constant domains. Model quality was assessed using Molprobity40.
After the initial structure determination and refinement the original diffraction data sets were reprocessed by applying the microdiffraction assembly method together with XDS which increased the useful resolution of the diffraction data by 0.2–0.3 Å. Five percent of randomly-selected reflections were set aside before refinement for calculation of Rfree. Structure refinement was carried out by restrained reciprocal refinement in PHENIX and manual building into the resulting Fobs-Fcalc difference maps in Coot. The final model of the apo structure contains two GluClcryst pentamers that include residues 1–102 and 106–340, a single N-linked carbohydrate attached to Asn 185, 10 Fab molecules (residues 1–221 or 224 for the heavy chains; residues 1–211 or 215 for the light chains), five detergent molecules, two chloride ions in one pentamer and a citrate molecule in one of the pentamers. Residues 103–105 lacked clear electron density in Fobs-Fcalc maps and hence were omitted from the final model. The final model of the POPC complex also contains two GluClcryst pentamers that include residues 1–340 or 342, an N-linked carbohydrate at Asn 185 at 9 of the 10 subunits, 10 Fab molecules (residues 1–222 or 224 for the heavy chains; residues 1–210 or 215 for the light chains), seven POPC lipid molecules, one glycerol molecule lodged between receptor subunits, four detergent molecules and a chloride ion in each pentamer. In both structures, Proline 138 in the Cys-loop was modeled in the cis conformation, consistent with findings from the higher resolution structures of a Cys-loop receptor bacterial ortholog41. The electron density for the conformation of this proline is, somewhat ambiguous, and thus one should not draw a mechanistic conclusion comparing the cis conformation in this study with the trans conformation in the earlier GluCl structures. Molecular graphics images were made using PyMOL42. Pore dimensions were analyzed using HOLE software43. Domain movements within a single GluCl subunit were investigated with DynDom1D (http://fizz.cmp.uea.ac.uk/dyndom/)44. Morphs between structures were calculated in UCSF Chimera45.
Radioligand binding experiments
The dissociation constant for ivermectin was measured by saturation ligand binding assays using His-tagged GluClcryst, [24, 25-3H]-ivermectin-B1a and the scintillation proximity assay (SPA)46 together with YSi copper beads. Binding reactions were performed in 20 mM Tris pH 7.4, 150 mM NaCl (TBS), 10 mM C12M and contained 10 nM binding sites and 1 mg ml−1 SPA beads. Background binding was determined in the presence of 100 μM cold ivermectin. Counts were stable after 24 h.
Competition binding experiments with lipids were carried out using 100 nM [3H]-ivermectin (50 Ci mmol−1) diluted 1:20 with [1H]-ivermectin. Lipids dissolved in chloroform were dried under a stream of argon, solubilized at 6 mM in 10 mM C12M. This turbid and likely saturated suspension of lipid was mixed with an equal volume of binding reaction buffer containing 20 nM GluClcryst binding sites, 2 mg ml −1 SPA beads and 200 nM ivermectin in 2x TBS, 10 mM C12M. Buffer or 10 μM ivermectin served as controls for total and non-specific binding, respectively. Counts were monitored every 12 hrs and the final values were measured 96 hrs after initiation of the binding reaction.
The binding constant for POPS was determined in competition with 50 nM [3H]-ivermectin diluted 1:20 with [1H]-ivermectin in reactions containing 25 nM binding sites and non-specific background binding was determined in the presence of 1 mM [1H]-ivermectin. Glutamate binding was measured using a total concentration of 5 μM L-glutamate (1:30 dilution of [3H]-L-glutamate (48.1 Ci mmol−1):[1H]-L-glutamate) in the presence of 3 mM lipid or 1 μM ivermectin in reactions containing 100 nM binding sites of GluClcryst. In these experiments we used N-terminal Nano15-tagged receptor11 and 1 mg ml −1 YSi Streptavidin SPA beads because glutamate binds with high affinity to the YSi copper beads. The reactions were carried out in TBS supplemented with 10 mM C12M. For determination of non-specific or background binding we employed either 10 mM [1H]-L-glutamate or protein was omitted from the binding reaction. As previously observed11, there was substantial non-specific binding of glutamate to the SPA beads in the absence of protein and thus we subtracted these counts from the total counts when determining the dissociation constant. Counts were measured after 36–48 hr after the initiation of the binding reaction. The glutamate dissociation constant in the presence of 3 mM POPS was measured by way of a saturation binding experiment. Binding data were read on a MicroBeta TriLux 1450 LSC & Luminescence Counter (Perkin Elmer) and fitted with GraphPad Prism software. Each sample was assayed in duplicate or triplicate in a single experiment and experiments were done in triplicate. Data from individual experiments were normalized and pooled.
Extended Data
Extended Data Figure 1. Packing of two pentameric GluCl-Fab complexes in the asymmetric unit of the C2 unit cell.
a, Asymmetric unit of apo GluClcryst-Fab complex seen in the plane of the membrane. The receptor is colored by subunit and the Fab is displayed in gray. b, Complex from (a) rotated by 90°. c, d, The two GluClcryst-Fab complexes with POPC (shown as yellow spheres ) seen parallel (c) and perpendicular (d) to the putative membrane plane.
Extended Data Figure 2. Electron density maps for the apo GluCl structure.
Shown are electron density maps calculated using 2Fobs - Fcalc coefficients and contoured at 1.5 σ with the α-carbon trace for approximately opposing subunits P and R seen in the plane of the membrane (a), the pore with the gating Leu 254 seen from the extracellular side (b), and the interface between the β1/β2 loop from the extracellular domain and the M2/M3 loop from the transmembrane domain with Val 45 and Pro 268 shown as sticks (c).
Extended Data Figure 3. Comparison of apo structures for GluCl, ELIC and GLIC.
a, Two approximately opposing subunits (P and R or A and D) are shown for the apo state of GluCl (blue) and ELIC (PDB 2VL0; yellow) and in (d) for the apo state of GluCl (blue) and apo state of GLIC (PDB 4NPQ; green) after superimposing all α-carbon atoms of one subunit. Indicated are distances between α-carbon atoms of Ser 265, Leu 254 and Pro 243 for GluCl, Asn 250, Leu 239 and Pro 228 for ELIC and Thr 244, Ile 233 and Glu 222 for GLIC (from top). b, e, Interactions of the β1/β2 loop and the M2/M3 loop in apo GluCl (blue) and ELIC (yellow) and GLIC (green), respectively. Key residues are shown as sticks with the distances between them indicated. For comparison the ivermectin-bound structure is shown in gray. Panels c and f show the ion channel pore with the proposed gate as seen from the extracellular side with the same color coding for the proteins as before.
Extended Data Figure 4. Lipid binding to GluCl.
a, View of one GluCl pentamer from the extracellular side together with contours from an ‘omit’ style electron density map computed using Fobs - Fcalc coefficients and phases from coordinates where atoms associated with POPC molecules were omitted from the structure factor computation. The electron density map is shown as blue mesh and is contoured at 1.5 σ. Prominent electron density features are visible between transmembrane domains of adjacent subunits although the strength and continuity of the density varies from subunit to subunit. b, Close up view of one putative electron density feature with POPC drawn as sticks and viewed in the plane of the membrane. c, Radioligand competition binding experiment using GluClcryst, [3H]-ivermectin and cold POPS yields a Ki for POPS of 167 μM (95% confidence interval: 129-216 μM). Shown is a representative binding curve. d, Saturation binding experiment with [3H]-L-glutamate GluClcryst-Nano15 yields a Kd of ~1.12 μM (95% confidence interval: 0.75-1.67 μM) in the presence of 3 mM POPS. e. Radioligand saturation binding using [3H]-ivermectin and the GluClcryst construct. Fitting the data to the Hill equation yields an EC50 of 18.5 nM (95% confidence interval of 11.1-30.7 nM) and an n=0.76 +/- 0.16. For panels c-f, experiments were carried out 3 separate times, with experiments done in triplicate.
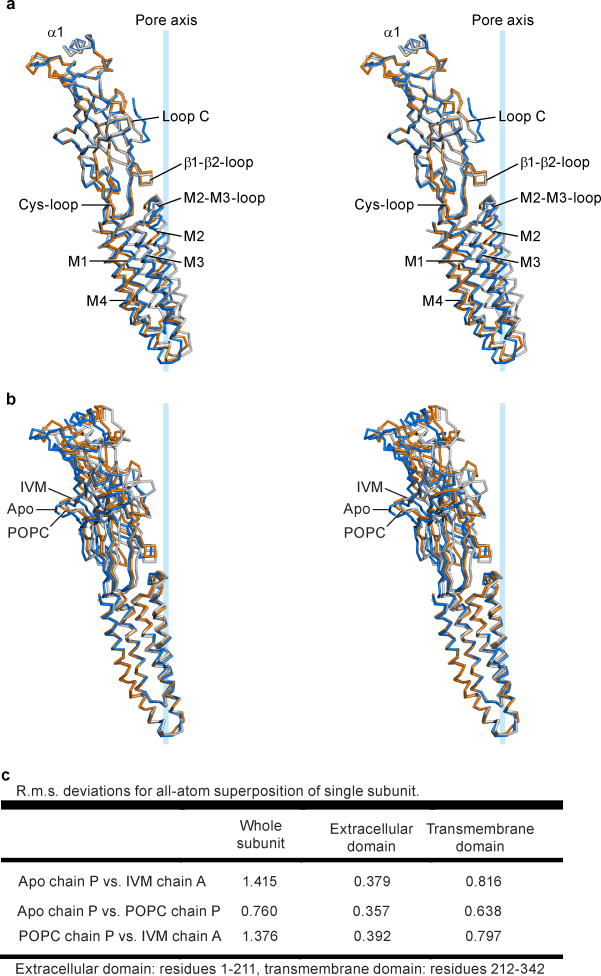
Extended Data Figure 5. Superpositions of a single subunit.
a, Stereo image of the α-carbon trace of the superpositions of the extracellular domain (residues 1-211) of a single subunit for apo (blue), ivermectin- (gray) and POPC-bound (orange) conformations. View parallel to the plane of the membrane with key features indicated. b, Same view of a GluCl subunit in the three different conformations colored as in (a) after superposition of the transmembrane domain (residues 212-342) to display differences in the extracellular domain. c, R.m.s. deviations for the superpositions shown in panels a and b and whole subunits.
Extended Data Figure 6. Conformational changes within a subunit.
a-c, Views of the transmembrane domain seen from the extracellular side after superposition of the extracellular domain (residues 1-211) (a) for the apo (blue) and the ivermectin-bound (gray) complex, (b) for the apo (blue) and POPC-bound (orange) complexes and (c) for the POPC- (orange) and ivermectin-bound (grey) structures. Panels d-f illustrate relative conformational changes within a subunit when the transmembrane domains are superimposed, using residues 212-342 and the same color coding as in panels a-c. g-i, Views from the extracellular side onto the extracellular domain after superimposing the transmembrane domain (g) of the apo and ivermectin-bound conformation, (h) the apo and POPC-bound structures and (i) the POPC- and ivermectin-bound complexes. The tilt and twist axes between transmembrane domain and extracellular domain are indicated by arrows as marked in the figure panels.
Extended Data Figure 7. Ivermectin and POPC alter subunit-subunit contacts in the transmembrane and extracellular domains.
Views of two neighboring subunits of GluCl seen parallel to the plane of the membrane after superposition of the transmembrane domain of the (-) subunit. a, Superposition of apo (blue) and ivermectin-bound (gray/white) structures. Ivermectin is shown in pale green as sticks. b, Superposition of the apo (blue) and POPC-bound (brown/orange) complexes with POPC shown as yellow sticks. c, Superposition of POPC- (brown/orange) and ivermectin-bound (gray/white) conformations with POPC and ivermectin as yellow and pale green sticks, respectively.
Extended Data Figure 8. Coupling between extracellular and transmembrane domain.
a, Superposition of the transmembrane domain of the (-) subunits for the apo (blue) and POPC-bound (brown) states shows the relative movement of the transmembrane domains and the M2/M3 loop of the (+) subunit. b, Same superposition as panel (a), viewed approximately parallel to the membrane, showing the coupled movement of the β1/β2 loop and the M2/M3 loop, with displacement of key residues Val 45, Pro 268 and Ile 273 indicated. Panels c and d show the same views for superposition of the POPC- (brown) and ivermectin-bound (gray) states. e-h, Illustration of key residues forming hydrogen bonds and a salt bridge that connects the transmembrane domains M3 and M1 with the Cys-loop in the extracellular domain in the ivermectin-bound state (gray) (e+f) and POPC-bound state (orange) (g+h). Shown are two views approximately in the plane of the membrane.
Extended Data Figure 9. Conformational changes in the GluCl pentamer.
a-c, Views of two opposing subunits as seen in the plane of the membrane for apo-closed (a), ivermectin-open (b) and apo-POPC (c) states. Leu 254 and Pro 243 are highlighted as sticks. Indicated are distances between α-carbon atoms of Thr 11, Ser 265 and Pro 243 (from top). d-f, Views of the transmembrane domains of the pentamer seen from the extracellular side along the pore axis for apo-closed (d), ivermectin- (e) and POPC-bound (f) conformations. For comparison the apo-closed state is shown for one subunit with the ivermectin (e) and POPC-bound (f) states. g-i, Top views of the extracellular domains of the GluCl pentamer of the (g) apo, (h) ivermectin- and (i) POPC-bound states. In panels h+i, the apo pentamer was superimposed on the ivermectin- and POPC-bound states using all atoms of the pentamer and one subunit of the apo state (blue) is shown for comparison. We note that despite the α1-helices moving towards the pore axis, the pore diameter in the extracellular domain increases in the ivermectin- and POPC-bound conformations as the lower parts of the extracellular domain move away from the pore center.
Extended Data Table 1.
Crystallographic and structure refinement statistics.
| Apo | POPC complex | |
|---|---|---|
| Data collection | APS 24-ID-C | APS 24-ID-C |
| Space group | C2 | C2 |
| Cell dimensions a, b, c (Å) | 455.8, 195.7, 196.2 | 453.8, 192.9, 196.1 |
| Cell angles α, β, γ (°) | 90.0, 93.2, 90.0 | 92.3, 92.3, 90.0 |
| Wavelength (Å) | 0.9795 | 0.9793 |
| Resolution (Å)* | 58.4–3.6 (3.64–3.60) | 58.7–3.2 (3.24–3.20) |
| Completeness* | 88.4 (78.9) | 92.2 (83.5) |
| Multiplicity* | 1.85 (1.54) | 1.92 (1.60) |
| I/σI* | 5.82 (1.37) | 7.26 (1.43) |
| Rmeas %* | 15.5 (56.3) | 12.1 (54.39) |
| CC1/2 (%)* | 99.4 (11.3) | 99.3 (17.1) |
| Refinement | ||
| Resolution (Å) | 58.44–3.6 | 58.73–3.2 |
| No. of reflections | 175651 | 256166 |
| Rwork/Rfree (%) | 26.11/28.29 | 22.69/25.06 |
| No. of atoms total | 60410 | 60822 |
| Protein (GluCl/Fab) | 60010 (26950/33060) | 60278 (27270/33008) |
| GlcNac | 140 | 126 |
| Lipid | 0 | 249 |
| Glycerol | 0 | 6 |
| Detergent | 232 | 161 |
| Citrate | 26 | 0 |
| Chloride | 2 | 2 |
| Average B-factor (A2) | 143.1 | 120.6 |
| GluCl | 134.1 | 103.6 |
| Fab | 150.1 | 120.4 |
| GlcNac | 187.4 | 186.8 |
| Lipid | n/a | 149.5 |
| Glycerol | n/a | 145.2 |
| Detergent | 165.1 | 214.8 |
| Citrate | 172.9 | n/a |
| Chloride | 115.7 | 105.5 |
| R.m.s. deviations | ||
| Bond lengths (Å) | 0.004 | 0.003 |
| Bond angles (°) | 0.783 | 0.739 |
| Ramachandran plot | ||
| Favoured (%) | 93.25 | 94.41 |
| Allowed (%) | 6.57 | 5.46 |
| Disallowed (%) | 0.18 | 0.13 |
| Rotamer outliers (%) | 0.15 | 0.31 |
Highest resolution shell in parentheses. 5% of reflections were used for calculation of Rfree.
Supplementary Material
The movie illustrates the transition of GluCl from the apo to the ivermectin-bound state from different perspectives. Key residues as pointed out in the text are shown as sticks.
Shown is the transition of the GluCl pentamer from the apo to the POPC-bound structure from different perspectives. Key residues are shown as sticks.
Acknowledgments
We thank all staff of beam line 24-ID-C at the Advanced Photon Source. We thank L. Vaskalis and H. Owen for help in figure and manuscript preparation, respectively. Dr. Dan Cawley at the Vaccine and Gene Therapy Institute, OHSU, provided the monoclonal antibody. We appreciate discussions with Gouaux laboratory members. This work was supported by a postdoctoral fellowship (Forschungsstipendium AL 1725-1/1) from the Deutsche Forschungsgemeinschaft to T.A. and an individual NIH National Research Service Award (F32NS061404) to R.E.H; E.G. is supported by the NIH and is an investigator with the Howard Hughes Medical Institute.
Footnotes
Author contributions
T.A., R.E.H and S.B. performed the experiments and T.A., R.E.H. and E.G. wrote the manuscript.
The coordinates and structure factors for the GluCl apo and POPC-bound structures have been deposited in the Protein Data Bank under accession codes 4TNV and 4TNW, respectively.
Reprints and permissions information are available at www.nature.com/reprints.
The authors declare no competing financial interests.
References
- 1.Thompson AJ, Lester HA, Lummis SC. The structural basis of function in Cys-loop receptors. Q Rev Biophys. 2010;43:449–499. doi: 10.1017/S0033583510000168. [DOI] [PubMed] [Google Scholar]
- 2.Sine SM. End-plate acetylcholine receptor: structure, mechanism, pharmacology, and disease. Physiol Rev. 2012;92:1189–1234. doi: 10.1152/physrev.00015.2011. [DOI] [PMC free article] [PubMed] [Google Scholar]
- 3.Corringer PJ, et al. Structure and pharmacology of pentameric receptor channels: from bacteria to brain. Structure. 2012;20:941–956. doi: 10.1016/j.str.2012.05.003. [DOI] [PubMed] [Google Scholar]
- 4.Boatin BA, Richards FOJ. Control of onchocerciasis. Adv Parasitol. 2006;61:349–394. doi: 10.1016/S0065-308X(05)61009-3. [DOI] [PubMed] [Google Scholar]
- 5.Unwin N. Refined structure of the nicotinic acetylcholine receptor. J Mol Biol. 2005;346:967–989. doi: 10.1016/j.jmb.2004.12.031. [DOI] [PubMed] [Google Scholar]
- 6.Brejc K, et al. Crystal structure of an ACh-binding protein reveals the ligand-binding domain of nicotinic receptors. Nature. 2001;411:269–276. doi: 10.1038/35077011. [DOI] [PubMed] [Google Scholar]
- 7.Hilf R, Dutzler R. Structure of a potentially open state of a proton-activated pentameric ligand-gated ion channel. Nature. 2009;457:115–118. doi: 10.1038/nature07461. [DOI] [PubMed] [Google Scholar]
- 8.Hilf R, Dutzler R. X-ray structure of a prokaryotic pentameric ligand-gated ion channel. Nature. 2008;452:375–379. doi: 10.1038/nature06717. [DOI] [PubMed] [Google Scholar]
- 9.Bocquet N, et al. X-ray structure of a pentameric ligand-gated ion channel in an apparently open conformation. Nature. 2009;457:111–114. doi: 10.1038/nature07462. [DOI] [PubMed] [Google Scholar]
- 10.Saugeut L, et al. Crystal structures of a pentameric ligand-gated ion channel provide a mechanism for activation. Proc Natl Acad Sci USA. 2014;111:966–971. doi: 10.1073/pnas.1314997111. [DOI] [PMC free article] [PubMed] [Google Scholar]
- 11.Hibbs RE, Gouaux E. Principles of activation and permeation in an anion-selective Cys-loop receptor. Nature. 2011;474:54–60. doi: 10.1038/nature10139. [DOI] [PMC free article] [PubMed] [Google Scholar]
- 12.Miyazawa A, Fujiyoshi Y, Unwin N. Structure and gating mechanism of the acetylcholine receptor pore. Nature. 2003;423:949–55. doi: 10.1038/nature01748. [DOI] [PubMed] [Google Scholar]
- 13.Bali M, Akabas MH. The location of a closed channel gate in the GABBA receptor channel. J Gen Physiol. 2007;129:145–159. doi: 10.1085/jgp.200609639. [DOI] [PMC free article] [PubMed] [Google Scholar]
- 14.Revah F, et al. Mutations in the channel domain alter desensization of a neuronal nicotinic receptor. Nature. 1991;353:846–849. doi: 10.1038/353846a0. [DOI] [PubMed] [Google Scholar]
- 15.Labarca C, et al. Channel gating governed symmetrically by conserved leucine residues in the M2 domain of nicotinic receptors. Nature. 1995;376:514–516. doi: 10.1038/376514a0. [DOI] [PubMed] [Google Scholar]
- 16.Filatov GN, White MM. The role of conserved leucines in the M2 domain of the acetylcholine receptor in channel gating. Mol Pharmacol. 1995;48:379–384. [PubMed] [Google Scholar]
- 17.Yoluk O, Brömstrup T, Bertaccini EJ, Trudell JR, Lindahl E. Stabilization of the GluCl ligand-gated ion channel in the presence and absence of ivermectin. Biophys J. 2013;105:640–647. doi: 10.1016/j.bpj.2013.06.037. [DOI] [PMC free article] [PubMed] [Google Scholar]
- 18.Barrantes FJ. Structural basis for lipid modulation of nicotinic acetylcholine receptor function. Brain Res Brain Res Rev. 2004;47:71–95. doi: 10.1016/j.brainresrev.2004.06.008. [DOI] [PubMed] [Google Scholar]
- 19.daCosta CJ, Dey L, Therien JP, Baenziger JE. A distinct mechanism for activating uncoupled nicotinic acetylcholine receptors. Nat Chem Biol. 2013;9:701–707. doi: 10.1038/nchembio.1338. [DOI] [PubMed] [Google Scholar]
- 20.Lee WY, Free CR, Sine SM. Nicotinic receptor interloop proline anchors beta1-beta2 and Cys loops in coupling agonist binding to channel gating. J Gen Physiol. 2008;132:265–278. doi: 10.1085/jgp.200810014. [DOI] [PMC free article] [PubMed] [Google Scholar]
- 21.Celie PH, et al. Nicotine and carbamylcholine binding to nicotinic acetylcholine receptors as studied in AChBP crystal structures. Neuron. 2004;41:907–914. doi: 10.1016/s0896-6273(04)00115-1. [DOI] [PubMed] [Google Scholar]
- 22.Hansen SB, et al. Structures of Aplysia AChBP complexes with nicotinic agonists and antagonists reveal distinctive binding interfaces and conformations. EMBO J. 2005;24:3635–3646. doi: 10.1038/sj.emboj.7600828. [DOI] [PMC free article] [PubMed] [Google Scholar]
- 23.Damle VN, Karlin A. Effects of agonists and antagonists on the reactivity of the binding site disulfide in acetylcholine receptor from Torpedo californica. Biochemistry. 1980;19:3924–3932. doi: 10.1021/bi00558a006. [DOI] [PubMed] [Google Scholar]
- 24.Lynagh T, Lynch JW. A glycine residue essential for high ivermectin sensitivity in Cys-loop ion channel receptors. Int J Parasit. 2010;40:1477–1481. doi: 10.1016/j.ijpara.2010.07.010. [DOI] [PubMed] [Google Scholar]
- 25.Velisetty P, Chalamalasetti SV, Chakrapani S. Structural basis for allosteric coupling at the membrane-protein interface in Gloeobacter violaceus ligand-gated ion channel (GLIC) J Biol Chem. 2014;289:3013–3025. doi: 10.1074/jbc.M113.523050. [DOI] [PMC free article] [PubMed] [Google Scholar]
- 26.Reeves DC, Jansen M, Bali M, Lemster T, Akabas MH. A role for the beta 1-beta 2 loop in the gating of 5HT3 receptors. J Neurosci. 2005;25:9358–9366. doi: 10.1523/JNEUROSCI.1045-05.2005. [DOI] [PMC free article] [PubMed] [Google Scholar]
- 27.Calimet N, et al. A gating mechanism of pentameric ligand-gated ion channels. Proc Natl Acad Sci USA. 2013;110:E3987–96. doi: 10.1073/pnas.1313785110. [DOI] [PMC free article] [PubMed] [Google Scholar]
- 28.Purohit P, Gupta S, Jadey S, Auerbach A. Functional anatomy of an allosteric protein. Nat Commun. 2013;4:2984. doi: 10.1038/ncomms3984. [DOI] [PMC free article] [PubMed] [Google Scholar]
- 29.Gleitsman KR, Lester HA, Dougherty DA. Probing the role of backbone hydrogen bonding in a critical beta sheet of the extracellular domain of a cys-loop receptor. Chembiochem. 2009;10:1385–1391. doi: 10.1002/cbic.200900092. [DOI] [PMC free article] [PubMed] [Google Scholar]
- 30.Lee WY, Sine SM. Principle pathway coupling agonist binding to channel gating in nicotinic receptors. Nature. 2005;438:243–247. doi: 10.1038/nature04156. [DOI] [PubMed] [Google Scholar]
- 31.Gourdon P, et al. HiLiDe--Systematic approach to membrane protein crystallization in lipid and detergent. Cryst Growth Des. 2011;11:2098–2106. [Google Scholar]
- 32.Otwinowski Z, Minor W. Processing of X-ray diffraction data collected in oscillation mode. Meth Enzymol. 1997;276:307–326. doi: 10.1016/S0076-6879(97)76066-X. [DOI] [PubMed] [Google Scholar]
- 33.Kabsch W. XDS. Acta Crystallogr D Biol Crystallogr. 2010;66:125–132. doi: 10.1107/S0907444909047337. [DOI] [PMC free article] [PubMed] [Google Scholar]
- 34.Hanson MA, et al. Crystal structure of a lipid-G protein-coupled receptor. Science. 2012;335:851–855. doi: 10.1126/science.1215904. [DOI] [PMC free article] [PubMed] [Google Scholar]
- 35.McCoy AJ. Solving structures of protein complexes by molecular replacement with Phaser. Acta Crystallogr D Biol Crystallogr. 2007;63:32–41. doi: 10.1107/S0907444906045975. [DOI] [PMC free article] [PubMed] [Google Scholar]
- 36.Cowtan KD, Zhang KY. Density modification for macromolecular phase improvement. Prog Biophys Mol Biol. 1999;72:245–270. doi: 10.1016/s0079-6107(99)00008-5. [DOI] [PubMed] [Google Scholar]
- 37.Adams PD, et al. PHENIX: building new software for automated crystallographic structure determination. Acta Crystallogr D Biol Crystallogr. 2002;58:1948–1954. doi: 10.1107/s0907444902016657. [DOI] [PubMed] [Google Scholar]
- 38.Emsley P, Cowtan K. Coot: model-building tools for molecular graphics. Acta Crystallogr D Biol Crystallogr. 2004;60:2126–2132. doi: 10.1107/S0907444904019158. [DOI] [PubMed] [Google Scholar]
- 39.Painter J, Merritt EA. Optimal description of a protein structure in terms of multiple groups undergoing TLS motion. Acta Crystallogr D. 2006;62:439–450. doi: 10.1107/S0907444906005270. [DOI] [PubMed] [Google Scholar]
- 40.Davis IW, et al. Mol Probity: all-atom contacts and structure validation for proteins and nucleic acids. Nucleic Acids Res. 2007;35:W375–83. doi: 10.1093/nar/gkm216. [DOI] [PMC free article] [PubMed] [Google Scholar]
- 41.Sauguet L, et al. Structural basis for ion permeation mechanism in pentameric ligand-gated ion channels. EMBO J. 2013;32:728–741. doi: 10.1038/emboj.2013.17. [DOI] [PMC free article] [PubMed] [Google Scholar]
- 42.DeLano WL. DeLano Scientific; San Carlos, CA, USA: 2002. [Google Scholar]
- 43.Smart OS, Neduvelil JG, Wang X, Wallace BA, Samsom MS. HOLE: a program for the analysis of the pore dimensions of ion channel structural models. J Mol Graph. 1996;14:354–360. doi: 10.1016/s0263-7855(97)00009-x. [DOI] [PubMed] [Google Scholar]
- 44.Poornam GP, Matsumoto A, Ishida H, Hayward S. A method for the analysis of domain movements in large biomolecular complexes. Proteins. 2009;76:201–212. doi: 10.1002/prot.22339. [DOI] [PubMed] [Google Scholar]
- 45.Pettersen EF, et al. UCSF Chimera--a visualization system for exploratory research and analysis. J Comput Chem. 2004;25:1605–1612. doi: 10.1002/jcc.20084. [DOI] [PubMed] [Google Scholar]
- 46.Hart HE, Greenwald EB. Scintillation proximity assay (SPA) - a new method of immunoassay. Direct and inhibition mode detection with human albumin and rabbit antihuman albumin. Mol Immunol. 1979;16:265–267. doi: 10.1016/0161-5890(79)90065-8. [DOI] [PubMed] [Google Scholar]
Associated Data
This section collects any data citations, data availability statements, or supplementary materials included in this article.
Supplementary Materials
The movie illustrates the transition of GluCl from the apo to the ivermectin-bound state from different perspectives. Key residues as pointed out in the text are shown as sticks.
Shown is the transition of the GluCl pentamer from the apo to the POPC-bound structure from different perspectives. Key residues are shown as sticks.


