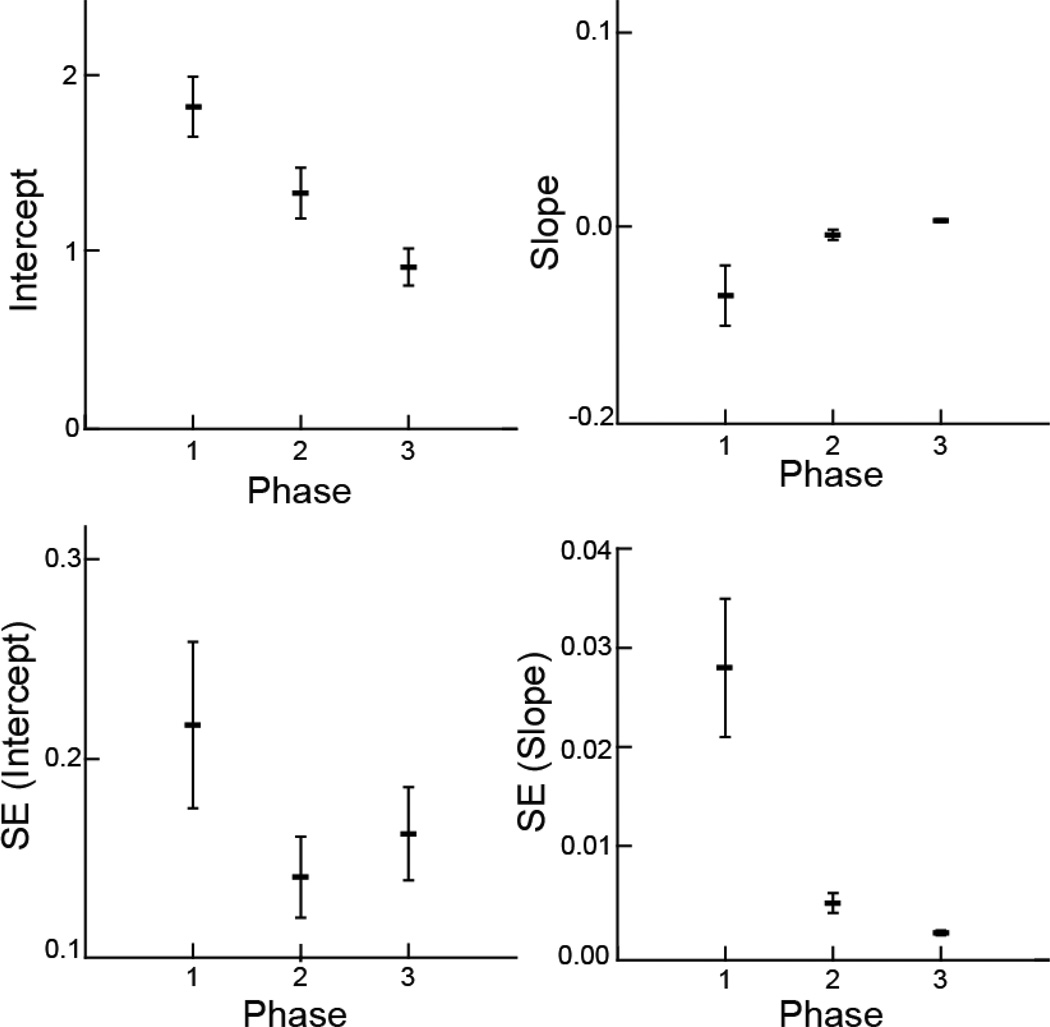
Fig. 4.
Swallow variables vs. phase. Mean and variation of the coefficients and standard errors from linear models of swallow frequency vs. time. The unit of analysis was sequence, with a sample size of 19. The horizontal bars are the average for each response variable, and the vertical lines are the standard error around that average, a measure of variation among the 19 sequences. The intercept and slope are from the linear models fit to the frequency of sucks in each sequence. The SE (intercept) and SE (slope) are the within-sequence standard errors from each of the 19 linear models

