Abstract
Background
The observation of multiple genetic markers in situ by optical microscopy and their relevance to the study of three-dimensional (3D) chromosomal organization in the nucleus have been greatly developed in the last decade. These methods are important in cancer research because cancer is characterized by multiple alterations that affect the modulation of gene expression and the stability of the genome. It is, therefore, essential to analyze the 3D genome organization of the interphase nucleus in both normal and cancer cells.
Results
We describe a novel approach to study the distribution of all telomeres inside the nucleus of mammalian cells throughout the cell cycle. It is based on 3D telomere fluorescence in situ hybridization followed by quantitative analysis that determines the telomeres' distribution in the nucleus throughout the cell cycle. This method enables us to determine, for the first time, that telomere organization is cell-cycle dependent, with assembly of telomeres into a telomeric disk in the G2 phase. In tumor cells, the 3D telomere organization is distorted and aggregates are formed.
Conclusions
The results emphasize a non-random and dynamic 3D nuclear telomeric organization and its importance to genomic stability. Based on our findings, it appears possible to examine telomeric aggregates suggestive of genomic instability in individual interphase nuclei and tissues without the need to examine metaphases. Such new avenues of monitoring genomic instability could potentially impact on cancer biology, genetics, diagnostic innovations and surveillance of treatment response in medicine.
Background
Cancer is characterized by multiple alterations that affect the modulation of gene expression and the stability of the genome. These interconnected changes occur within the nuclei of cells that alter their three dimensional (3D) organization during tumor initiation and progression [1,2]. It seems reasonable to assume that the highly organized mammalian interphase nucleus is the structure that ascertains genomic stability. In line with these concepts, oncogenic activation remodels this nuclear order and sets the stage for genomic instability as we have recently measured for conditional c-Myc deregulation. The deregulated expression of c-Myc alters the 3D nuclear space of chromosomes and telomeres, and makes genomic rearrangements topologically feasible (Chuang et al., in preparation).
Defining the structural organization of the interphase nucleus is, therefore, essential to our understanding of the 3D genome organization in the interphase nucleus. Such a study can be performed by fluorescence in situ hybridization (FISH). Two of the most attractive features of FISH measurements of the 3D nucleus organization are the ability to simultaneously visualize multiple targets and the structural organization of nucleus and cells, something that cannot be achieved by array-based methods.
The organization of the interphase nucleus has been studied since the late nineteenth century [3]. It is now well accepted that the position of chromosomes in the nucleus plays an important role in gene regulation [4]. Nevertheless, some controversy exists. Most laboratories have observed a non-random organization of chromosome territories [2,5,6] that has been conserved during evolution [7]. This has been further supported by studies that demonstrate an architectural stability of the chromosomal positions in the nucleus [8,9]. There are, however, different observations on chromosomal positions [10-15] as well as on positional changes of chromosomes during the cell cycle [16,17].
Recently, interest has also focused on telomeres, whose importance to genomic stability was recognized as early as the 1930s [18]. Capping the chromosomes, telomeres are responsible for chromosomal integrity [19] to prevent genomic instability [20]. Some reports have been published on the 3D organization of telomeres in the nucleus, mainly with regard to the distances of telomeres from the nuclear shell. Telomeres have been previously found at the nuclear edge [21], at the nuclear periphery [22], throughout the entire nucleus [13,23], in non-Rabl association [11], in association with the nucleolus [24] or in the nuclear matrix [25].
Telomere dynamics also have been studied in living human U2OS osteosarcoma cells [26]. Individual telomeres showed significant directional movements and telomeres were shown to associate with promyelocytic leukemia bodies in a dynamic manner. This means that telomere structure is dynamic, and may be important for both transcriptional processes and for stabilizing chromosome positions in the nucleus.
We have developed a method of studying the organization of the genome by analysis of the 3D organization of telomeres in the nucleus and their positional changes along the cell cycle, using flow-sorted living cells. This method enables us to determine, for the first time, that telomere organization is cell-cycle dependent, with assembly of telomeres into a telomeric disk in the G2 phase. Moreover, we show for tumor cells that the 3D telomere organization is distorted and that telomeric aggregates are formed. These results emphasize a non-random and dynamic 3D nuclear telomeric organization and its importance to genomic stability.
Results and discussion
To study the organization and structure of the genome in the nucleus, we took the approach of labelling only the telomeres and measuring their 3D organization as indicators for chromosomal distribution. After the 3D fluorescent measurements, the data were analyzed with a programme that was developed for this study. The programme finds all the telomeres in the nucleus; their size, intensity and shape; and determines the telomeric organization inside the volume of the nucleus. One crucial property that we analyzed was the distribution of the telomeres inside the nuclear volume. We first segmented the nucleus and found the centre of each telomere. We then found the smallest convex set of polygons that contains all the telomeres (Fig. 1). This was done by using the Quickhull algorithm [27]. In most cases, we found that the volume contained by the telomeres resembles either a sphere or a flattened sphere (disk). It can be described as an ellipsoid with two similar radii (a≈b) and a different third one (c; Fig. 2). Such a shape is called a spheroid. The level of flatness of the volume occupied by the telomeres can, therefore, be described by the ratio of the two radii that are different, a (or b) and c – a/c. The larger the ratio, the more oblate (or disk-like) is the shape of the volume occupied by the telomeres, while a/c≈1 means that the volume is spherical.
Figure 1.
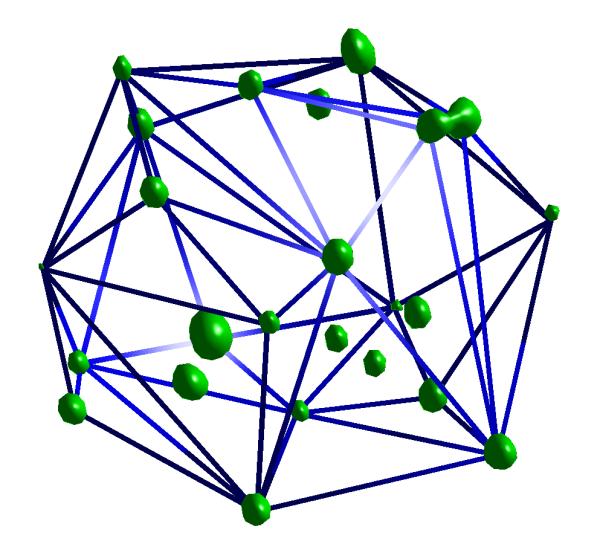
The distribution of the telomeres in the nucleus volume is found by fitting a convex set of polygons that contains all the telomeres. This volume usually looks like either a sphere or a disk and can be described as an ellipsoid.
Figure 2.
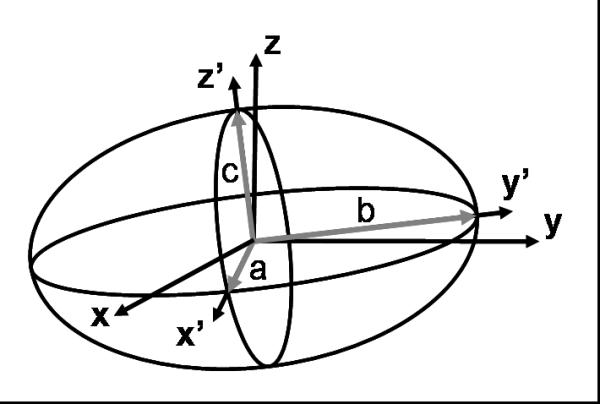
In general, the ellipsoid's main axes along x'y'z' do not coincide with the microscope-slide plane and optical axes xyz. Our programme finds an ellipsoid that contains all the telomeres and the size of its main axes a,b,c. In most of the cases the x'y' axes of the ellipsoid are similar, i.e. a≈b. Therefore, the ratio a/c is a good measure of the flatness level of the ellipsoid and of the telomere organization inside the nucleus.
The optical resolution and signal-to-noise ratio are presented in Fig. 3. The images of two neighbouring telomeres that are 1200 nm and 400 nm apart, and the corresponding intensity along the line connecting the pair, indicates the smallest telomere distance that can still be unambiguously distinguished (approximately 200 nm).
Figure 3.
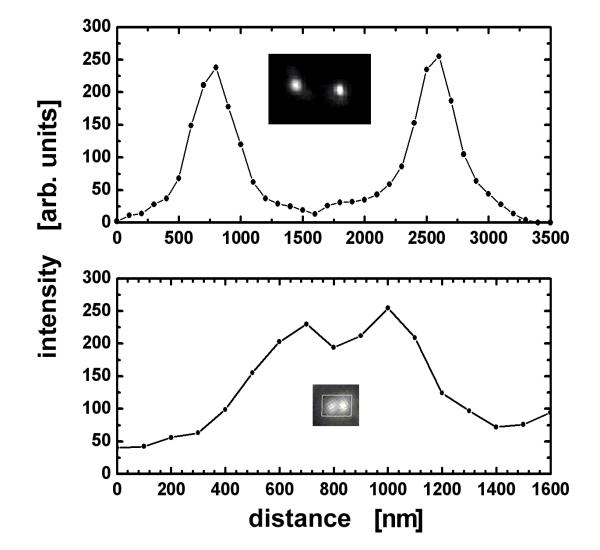
Demonstration of the signal-to-noise and spatial resolution of our measurements. The fluorescence intensity is bright (typical signal-to-noise ratio of 10:1). Two pairs of telomeres are shown, 1200 nm apart (top), which can be easily separated, and 400 nm apart (bottom). The inserts show the actual images.
It is expected that 80 telomeres will be observed in the interphase nucleus for normal mouse cells (92 for a normal somatic human cell), however, in our measurements we were usually able to identify approximately 40 separated telomere regions in each mouse cell (50 in human cells). Similar results have been described before [23,28]. This is probably due to neighbouring telomeres that are closer than the optical resolution (see Fig. 3), but it does not affect the analysis of the telomere distribution in the nucleus as long as the hybridization efficiency is high. This was verified by two-dimensional measurements of all the telomeres in a metaphase spread (using the same probe), where at least 90% of the telomeres are unambiguously observed (Fig. 4).
Figure 4.
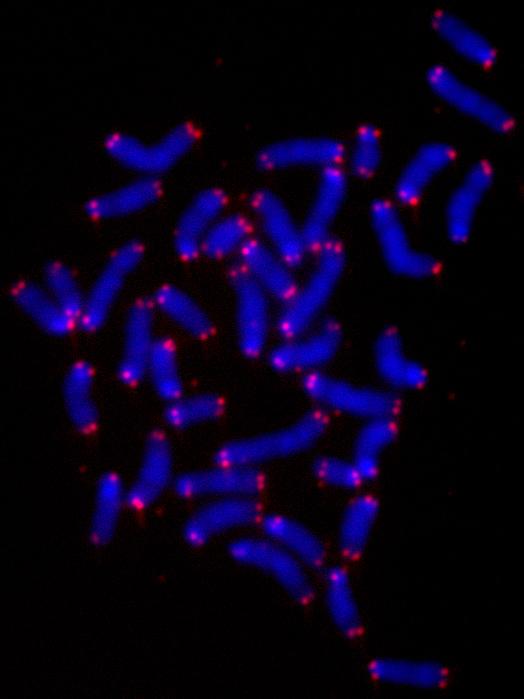
Metaphase plate prepared from fetal liver cells directly isolated from day 10 old mouse embryos. Metaphase chromosomes and spreads were prepared as described [30] and hybridized with a PNA-telomeric probe that was Cy3 labelled. More than 90% of the telomeres are clearly observed.
We first described the major observation of primary BALB/c mouse B lymphocytes that were studied along the cell cycle. These studies were followed by the analysis of immortalized cells. The lymphocytes were sorted according to their DNA content for the determination of the G0/G1, S or G2/M phases (see Methods).
By analyzing cell-cycle sorted primary mouse lymphocytes we found that the 3D telomere organization changes during the cell cycle. Telomeres are widely distributed throughout the nucleus in the G0/G1 and S phases with a calculated a/c ratio of 0.9 ± 0.4, which means a spherical-like volume of distribution. However, during G2, telomeres are not observed throughout the whole nucleus. Their 3D organization changes, with all the telomeres assuming a central structure that we call the telomeric disk, which has never been reported before. In this ordered structure, all the telomeres align in the centre of the nucleus as cells progress into the late G2 phase. The a/c ratio they assume is 6.0 ± 2.0, which means a very flat disk (almost a coin shape).
Typical lymphocytes from different phases are shown in Fig. 5. The a/c ratio of these cells in the G0/G1, S and G2/M phases is 0.8, 0.8 and 6, respectively, and clearly shows the correlation of the a/c ratio with the telomere distribution and the organization of the telomeric disk that we found in the G2 phase. The elongation of the telomeres along the Z axis (the optical axis) relative to the XY plane has the same ratio as the point spread function of our system and results from the poorer optical resolution along the optical axis. However, this has a very small effect on the shape of the whole nucleus.
Figure 5.
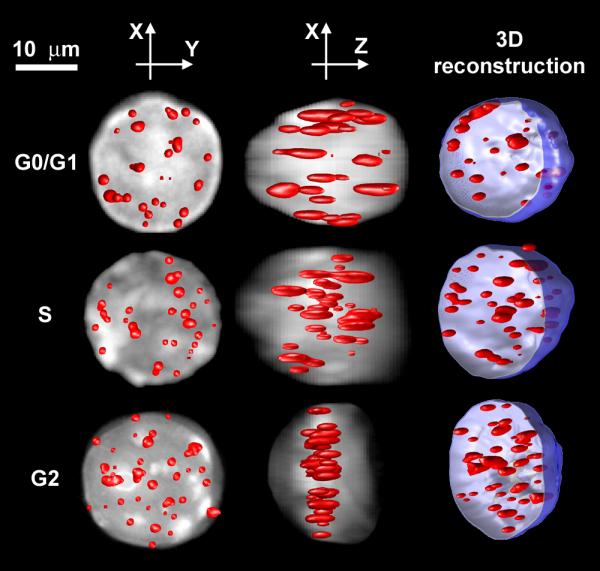
The distribution of telomeres in the nucleus of three typical cells selected from the G0/G1 phase (upper row), S phase (middle row) and G2/M phase (lower row). Each telomere distribution is shown from a top view (the XY plane), along the optical axis Z (left column), from a side view (XZ plane) as observed along the Y axis (centre column) and as a 3D image of the telomeres in an open nucleus (right column). When shown from the top and side views, the telomeres are displayed on top of the projected image of the nucleus. This projection demonstrates the extent of the chromatin (and therefore chromosomes) and defines the volume and borderline of the nucleus.
Similar results have been observed in primary human lymphocytes, primary human fibroblasts and in normal human epithelial tissue (see additional file for more data). This suggests that chromosomes assume a very precise order that pre-aligns them prior to the onset of mitosis. In order to ascertain that the telomeric disk was not the result of a distorted nucleus, our analysis programme compared the telomere distribution volume and shape with that of the 4'-6-Diamidino-2-phenylindole (DAPI) – stained nucleus, and verified that the nucleus itself still had a spherical-like volume. We rarely found distorted nuclei and excluded these cells from the analysis. The nucleus shown in G2 is not fully spherical. Such a shape is expected, because when the telomeres forms a disk, it pools the chromosomes and forces them to be closer to the disk, which results in an oblate shape as well.
To further study the phase transition timing along the cell cycle we used the synchronous bromodeoxyuridine (BrdU) sorting method. The cell population was pulse-labelled with BrdU in the S phase and flow sorted. Cells were placed back into culture and sub-populations harvested at 3.5, 4, 5, 6, 7, 8, 8.5, 9 and 10 hours after labelling and sorting. The cells were then fixed for 3D analysis. A minimum of 20 cells from each of these sub-populations were measured, analyzed and divided into the following three categories: 1) nuclei with a telomeric disk; 2) cells in mitosis; 3) cells in interphase without telomeric disk and mitotic figures (evaluated as G1 cells). The cell fractions as a function of time are shown in Fig. 6. Most cells (90%) form a telomeric disk 3.5 hours after BrdU incorporation. These cells are, therefore, interpreted as cells in the G2 phase. The fraction of metaphase cells peaks at 7.5 hours (65%) and the cell fraction of interphase cells that does not have a telomeric disk (and is interpreted as being in the G1 phase) peaks at 8.5 hours (57%).
Figure 6.
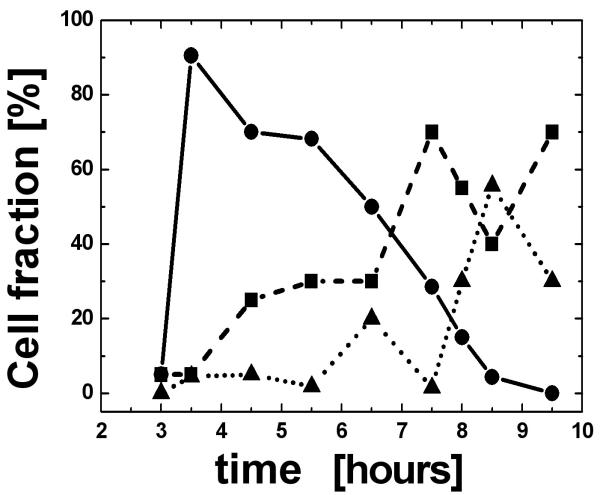
BrdU-positive cells were live sorted and synchronized in the S phase. They were harvested from a culture at time intervals of 3.5–9 hours. The cells were then fixed for 3D analysis. For each time point we have measured: 1. the fraction of nuclei with a telomeric disk; 2. the fraction of cells in mitosis; and 3. the fraction of cells with interphase nuclei but without a telomeric disk. Ninety percent of the cells formed a telomeric disk 3.5 hours after BrdU incorporation and were therefore interpreted as cells in the late G2 phase (black line and circles). Cells entering mitosis (dashed line and squares) peaked at 7.5 hours (65%) and cells in G1 (dotted line and triangles) peaked after 8.5 hours (57%). The increase in the number of metaphases at 9.5 hours cannot be explained and probably lies within the limits of experimental errors.
These results reveal that the telomeric disk is formed in the late G2 phase. As cells progress from G2 to M, chromosomes organize into metaphases and, therefore, the number of cells in interphase with a telomeric disk decreases. Because there is no other state of transition between telomeric disk and mitosis, we conclude that the telomeric disk is the 3D telomeric organization assumed in late G2. Thus, it is also the final stage of the interphase nucleus that permits the organization of the genetic material prior to its entry into the M phase and prior to chromosome segregation. Cells in late G2 with a telomeric disk have additional characteristic features: i) they exhibit a larger overall nuclear volume than their G1 or S phase counterparts (this increase in size was also confirmed by fluorescent activated cell sorter [FACS] analysis); and ii) they begin to show signs of early re-organization of the chromatin into partially condensed areas (as visualized using the DAPI stained image).
At the end of the M phase, we observe cells that enter into the G1 conformation of telomeres, with a wide spatial distribution of telomeres throughout a smaller nucleus.
In conclusion, this data indicates that the telomeric disk is a novel structure within the interphase nucleus in late G2 that has not been previously described. Its existence points to the fundamental importance of ordered nuclear organization at the end of G2. The telomeric disk probably assures the proper organization of chromosomes prior to mitosis and their organized segregation during mitosis. Together with information that has been previously published on telomeric dynamics [26,28], it is tempting to speculate that telomeres take an active part in the process of chromosome organization into a unique structure, the telomeric disk, during G2. This alignment of telomeres and chromosomes would facilitate the proper subsequent organization of the chromosomes into an equatorial plane during cell division. This process may be driven by the telomeres themselves (that are free of the nuclear matrix) or through the nuclear matrix. The telomeric disk may also allow for a late G2 checkpoint.
Further work on the subject can also be performed in vivo, as has been shown by Molenaar et al. [26]. In such a way the full dynamic process can be observed, which is complementary to the single time-points that are shown in our work.
We have continued to observe the distribution of telomeres in cancer cells. Typical 3D images constructed from normal nuclei and from a Burkitt lymphoma cell line (Raji), as well as from primary mouse plasmacytoma (PCT) and primary human head and neck squamous cell carcinoma (HNSCC) stage IV (Fig. 7), show that telomeres form aggregates and thus a partially altered telomeric disk. Such telomeric aggregates are characterized by both a larger volume and larger integrated intensity than their normal non-overlapping and non-aggregated counterparts. They are not observed in normal cells. Similar results for altered telomeric organization have also been found in human neuroblastoma and colon carcinoma tumor cell lines.
Figure 7.
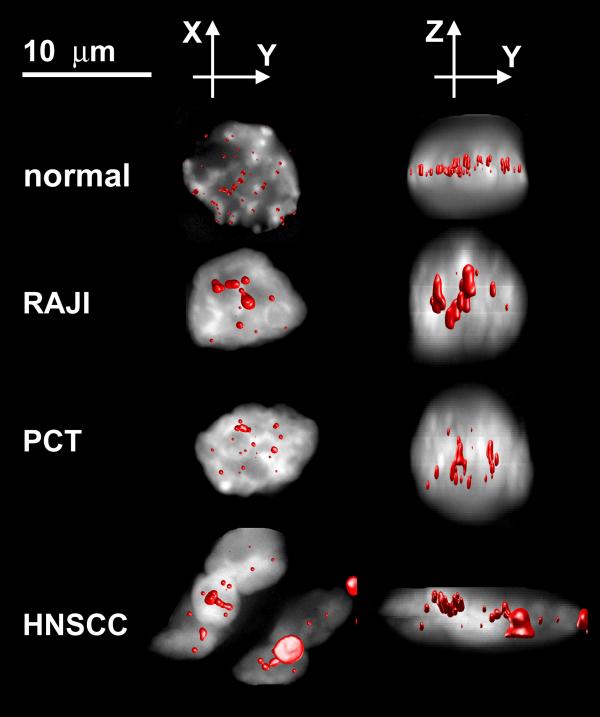
Normal: A normal blood cell; RAJI: A Burkitt lymphoma cell line; PCT: A primary mouse plasmacytoma cell; HNSCC: A primary human head and neck squamous cell carcinoma (stage IV). The distribution of telomeres in cancer cells compared with a normal cell. Images are shown as explained in Fig. 5. Aggregates of telomeres are formed and the telomere disk that appears in the G2 phase is distorted.
In line with these concepts, oncogenic activation remodels this nuclear order and sets the stage for genomic instability as we have recently measured for conditional c-Myc deregulation. We have found that deregulated expression of c-Myc alters the 3D nuclear organization of chromosomes and telomeres, and makes genomic rearrangements topologically feasible (Chuang et al., in preparation).
Conclusions
In summary, we have shown that 3D optical imaging followed by the analysis of telomeres in the interphase is an important tool for basic research and cancer biology. We have found cell-cycle dependence of the telomere organization in the nucleus, where telomeres align into a telomeric disk during the late G2 phase. Such an organization has never before been reported.
Telomeric aggregates are found in tumor cells and, therefore, an alteration of the telomeric disk is seen. Transient telomeric aggregations potentially cause irreversible chromosomal rearrangements.
The above findings indicate that it is now possible to examine the presence of telomeric aggregates suggestive of genomic instability in individual interphase nuclei and tissue, without the need to examine metaphases. Such new directions of monitoring genomic instability could potentially have an impact on cancer biology, genetics, diagnostic innovations and surveillance of treatment response in medicine.
Methods
Cells
Mouse primary cells were directly isolated from BALB/c mice and stimulated with lipopolysaccharide to enter into the cell cycle [29]. Primary mouse fetal liver cells were also directly isolated from BALB/c mice. Mice were studied according to the protocols approved by Canadian Central Animal Care. Immortalized mouse pro B lymphocytes have been described elsewhere [30]. Human primary cells were obtained from healthy donors. Head and neck squamous cell carcinoma and control tissue were obtained from a patient at CancerCare Manitoba upon ethics approval and informed consent.
Fixation techniques
Pro B lymphocytes [30] were fixed in four ways: i) following cytospin preparations, cells were fixed in 3.7% formaldehyde (1×PBS/50 mM MgCl2); ii) cells were allowed to grow on glass slides and were fixed in 1% formaldehyde (3D fixation); iii) cells were fixed in suspension with 3.7% formaldehyde (3D fixation); and iv) cells were fixed in methanol:acetic acid (3:1) according to standard protocols [29]. Tissue was fixed following cryosection (5 μm sections were used) in 1% formaldehyde (1×PBS/50 mM MgCl2). All hybridizations shown in this report were carried out after 3D fixation.
Fluorescent activated cell sorter (FACS) analysis
For FACS analysis, primary lymphocytes were fixed in 70% cold ethanol and stained with propidium iodide (1 μg/mL) following RNAse (20 μg/mL) digestion. The stained cells were analysed for DNA content by flow cytometry in a EPICS Altra cytometer (Beckman-Coulter). Cell cycle fractions were quantified with WinCycle software (Phoenix Flow Systems, San Diego, CA).
Cell sorting
Cells were stained with Hoechst 33342 (Molecular Probes) at a final concentration of 1 μg/mL for 90 minutes at 37°C and 5% of carbon dioxide (CO2). Cells were sorted according to their DNA content (G0/G1, S and G2/M phases) with a EPICS Altra cytometer (Beckman-Coulter) equipped with a UV laser (Coherent, excitation at 350 nm) and a 460 nm band-pass filter.
BrdU labelling
Pro B lymphocytes were labelled in vivo with 10 μM of BrdU (5-Bromo-2'-deoxyuridine, SIGMA-ALDRICHT, Lyon, France) for one hour at 37°C in humidified atmosphere (5% CO2). BrdU was then detected with 5 μL/1×106 cells of anti-BrdU-FITC (fluorescein isothiocyanate) antibody (TEBU, Le Perray-en-Yvelines, France) at identical conditions for 30 minutes. Thereafter, all BrdU (i.e. FITC)-positive cells were live sorted, placed into culture for different times and harvested at 3.5, 4, 5, 6, 7, 8, 8.5, 9 and 10 hours after labeling and sorting. The cells were then fixed for 3D analysis. For each time point we have measured: 1. the fraction of nuclei with a telomeric disk; 2. the fraction of cells in mitosis; and 3. the fraction of cells in interphase nuclei without telomeric disk and mitotic figures that were evaluated as G1 and S phase cells.
Telomere FISH using Cy3-labled PNA probes
Telomere FISH was performed as described [31] using a Cy3-labelled PNA probe (DAKO, Glostrup, Denmark). Telomere hybridizations were specific as shown by metaphase hybridizations and the correct number of the telomeric signals observed at the ends of chromosomes prepared from primary cells (Fig. 4).
3D image acquisition
Unless stated otherwise, 20–30 cells were analyzed by 3D imaging from each cell type and phase type. Part of the measurements were done with a confocal microscope (Leica AOBS-SP) and most of them with a conventional Axioplan 2 (Zeiss) with a cooled AxioCam HR CCD followed by deconvolution [30]. DAPI, FITC and Cy3 filters (Zeiss) were used in combination with Planapo 63×/1.4 oil (Zeiss). Axiovision 3.1 software with a deconvolution module and rendering module were used (Zeiss). Both methods gave similar results.
80–100 sections were acquired for each 3D nucleus, typically with 200 × 200 pixels per section with a ~100 × 100 nm nominal imaging area per pixel (steps of 200 nm along Z). The point-spread function of our system has a full width at half max of approximately 200 nm in the plane and 400 nm along the optical axis.
3D analysis of telomeres
In order to analyze the telomere distribution in the nucleus, we developed a special 3D image analysis programme. The main algorithmic part is described below. The programme (TeloView) is based on the Matlab computer language (The MathWorks, Natick, MA, USA) and some of the image processing algorithms are based on the DipImage library (developed at the Quantitative Imaging Group, Delft University of Technology, Delft, The Netherlands) [32].
The programme segments the nucleus volume by a derivative-based algorithm using a morphological top and bottom-hat algorithm [33]. The volume, intensity and centre of gravity are calculated for each spot. The programme then finds a principle plane in the nucleus (x'y') that is the closest to all the telomeres (Fig. 2). This is especially important when a tissue section is analyzed, because this plane should not necessarily be parallel to the microscope slide plane.
The telomeric distribution inside the nucleus is described by fitting an ellipsoid to the volume occupied by the telomeres (three different main axes; Fig. 2). The distributions were found to be either oblate or spherical (i.e. the two principle axes along the main x'y' plane of the spheroid are similar). It is, therefore, convenient to describe the distribution volume as a spheroid (i.e. an ellipsoid having two axes of equal length). As such, it is simpler to describe the spheroid degree of variation from a perfect sphere by the ratio a/c where a and b are the similar semi-axes and c is the third one. Such a description reflects the degree to which the telomere's volume is oblate.
Authors' contributions
TCYC performed the data analysis, wrote the discussion, performed the hybridizations, took all head and neck cancer samples from tumor collections during surgery to preparation of frozen sections, hybridization, analyses and patient records. SMo performed some of the hybridizations and analyses while visiting SM's lab. YG developed the 3D analysis methods, 3D algorithms and the programme that analyses the nuclei, wrote the paper in its current version and acts as corresponding author. AYCC organized the data, tables, and G2 phase data. ITY, BV and RD took part in the development of the 3D analysis methods and algorithms, and the programme that analyses the nuclei. VM did the BrdU-labelling experiments and G2 study in France and in SM's lab. MP performed the G2 analysis in SM's lab. MB performed the metaphase telomere FISH. PDK directs the programme of head and neck surgery and provided some of the samples that were used for the study. TF supervised VM and MP in France. PB supervised SMo in Heidelberg. SM planned and carried out the project that was performed in SM's lab, and was supervisor for TCYC, SMo (while visiting SM's lab), AYCC, MB, MP and VM, and performed part of the experiments.
Acknowledgments
Acknowledgements
The authors wish to thank our colleagues and lab members for discussions and critical reading of this manuscript. This work was supported by the Canada Foundation for Innovation, the Canadian Institutes of Health Research (NSERC), CancerCare Manitoba, Fondation de France (Paris), the French Minister of Foreign Affairs, Sander-Stiftung and Verein zur Förderung der Krebsforschung e.V.
This work was also supported by the Physics for Technology programme of the Foundation for Fundamental Research in Matter (FOM), the Delft Inter-Faculty Research Center Life Tech and the Delft Research programme Life Science and Technology.
Contributor Information
Tony Chih Yuan Chuang, Email: tcychuang@hotmail.com.
Sharareh Moshir, Email: s.moshir@dkfz.de.
Yuval Garini, Email: Y.Garini@tnw.tudelft.nl.
Alice Ya-Chun Chuang, Email: alicechuang@hotmail.com.
Ian T Young, Email: young@ph.tn.tudelft.nl.
Bart Vermolen, Email: vermolen@ph.tn.tudelft.nl.
Richard van den Doel, Email: richard@ph.tn.tudelft.nl.
Virginie Mougey, Email: virginie.mougey@voila.fr.
Mathilde Perrin, Email: mathilde-perrin@caramail.com.
Martina Braun, Email: tina-braun@gmx.net.
Paul Donald Kerr, Email: pkerr@exchange.hsc.mb.ca.
Thierry Fest, Email: thierry.fest@univ-rennes1.fr.
Petra Boukamp, Email: P.Boukamp@dkfz-heidelberg.de.
Sabine Mai, Email: smai@cc.umanitoba.ca.
References
- Pienta KJ, Partin AW, Coffey DS. Cancer as a disease of DNA organization and dynamic cell structure. Cancer Research. 1989;49:2525–2532. [PubMed] [Google Scholar]
- Cremer C, Cremer Thomas. Chromosome territories, nuclear architecture and gene regulation in mammalian cells. Nature reviews Genetics. 2001;2:292–301. doi: 10.1038/35066075. [DOI] [PubMed] [Google Scholar]
- Rabl C. Über Zellteilung. Morphologisches Jahrbuch Gegenbaur C (ed) 1885;10:214–330. [Google Scholar]
- Marshall WF. Order and Disorder in the Nucleus. Curr Biol. 2003;12:R185–R192. doi: 10.1016/s0960-9822(02)00724-8. [DOI] [PubMed] [Google Scholar]
- Nagele R, Freeman T, McMorrow L, Lee H-y. Precise spatial positioning of chromosomes during prometaphase: evidence for chromosomal order. Science. 1995;270:1831–1835. doi: 10.1126/science.270.5243.1831. [DOI] [PubMed] [Google Scholar]
- Parada LA, Misteli T. Chromosome positioning in the interphase nucleus. Trends in Cell Biology. 2002;12:425–432. doi: 10.1016/S0962-8924(02)02351-6. [DOI] [PubMed] [Google Scholar]
- Tanabe H, Müller S, Neusser M, von Hase J, Calcagno E, Cremer M, Solovei I, Cremer C, Cremer T. Evolutionary conservation of chromosome territory arrangements in cell nuclei from higher primates. Proc Nat Acad Sci USA. 2002;99:4424–4429. doi: 10.1073/pnas.072618599. [DOI] [PMC free article] [PubMed] [Google Scholar]
- Gerlich D, Beaudouin J, Kalbfuss B, Daigle N, Eils R, Ellenberg J. Global chromosome positions are transmitted through mitosis in mammalian cells. Cell. 2003;112:751–764. doi: 10.1016/S0092-8674(03)00189-2. [DOI] [PubMed] [Google Scholar]
- Abney JR, Cutler B, Fillback ML, Axelrod D, Scalettar BA. Chromatin dynamics in interphase nuclei and its implication for nuclear structure. The Journal of Cell Biology. 1997;137:1459–1468. doi: 10.1083/jcb.137.7.1459. [DOI] [PMC free article] [PubMed] [Google Scholar]
- Holley WR, Mian IS, Park SJ, Rydberg B, Chatterjee A. A model for interphase chromosomes and evaluation of radiation-induced aberrations. Radiation Research. 2002;158:568–580. doi: 10.1667/0033-7587(2002)158[0568:amfica]2.0.co;2. [DOI] [PubMed] [Google Scholar]
- Cerda MC, Berrios S, Fernandez-Donoso R, Garagna S, Redi C. Organisation of complex nuclear domains in somatic mouse cells. Biology of the Cell. 1999;91:55–65. doi: 10.1016/S0248-4900(99)80031-8. [DOI] [PubMed] [Google Scholar]
- Cornforth Michael N., Greulich-Bode Karin M., Loucas Bradford D., Arsuaga Javier, Vazquez Mariel, Sachs Rainer K., Bruckner Martina, Molls Michael, Hahnfeldt Philip, Hlatky Lynn, Brenner David J. Chromosomes are predominantly located randomly with respect to each other in interphase human cells. J Cell Biol. 2002;159:237–244. doi: 10.1083/jcb.200206009. [DOI] [PMC free article] [PubMed] [Google Scholar]
- Vourc'h Claire, Taruscio Domenica, Boyle Ann L., Ward David C. Cell cycle-dependent distribution of telomeres, centromeres, and chromosome-specific subsatellite domains in the interphase nucleus of mouse lymphocytes. Experimental Cell Research. 1993;205:142–151. doi: 10.1006/excr.1993.1068. [DOI] [PubMed] [Google Scholar]
- Lopez-Velazquez G, Marquez J, Ubaldo E, Corkidi G, Echeverria O, Vazquez Nin GH. Three-dimensional analysis of the arrangement of compact chromatin in the nucleus of G0 rat lymphocytes. Histochemistry and Cell Biology. 1996;105:153–161. doi: 10.1007/BF01696155. [DOI] [PubMed] [Google Scholar]
- Dong F, Jiang J. Non-Rabl patterns of centromere and telomere distribution in the inteprhase nuclei of plant cells. Chromosome Research. 1998;6:551–558. doi: 10.1023/A:1009280425125. [DOI] [PubMed] [Google Scholar]
- Ferguson M, Ward DC. Cell cycle dependent chromosomal movement in pre-mitotic human T-lymphocyte nuclei. Chromosoma. 1992;101:557–565. doi: 10.1007/BF00660315. [DOI] [PubMed] [Google Scholar]
- Gasser SM. Visualizing chromatin dynamics in interphase nuclei. Science. 2002;296:1412–1416. doi: 10.1126/science.1067703. [DOI] [PubMed] [Google Scholar]
- McClintock Barbara. The stability of broken ends of chromosomes in Zea Mays. Genetics. 1941;26:234–282. doi: 10.1093/genetics/26.2.234. [DOI] [PMC free article] [PubMed] [Google Scholar]
- Blackburn EH. Switching and signaling at the telomere. Cell. 2001;106:661–673. doi: 10.1016/S0092-8674(01)00492-5. [DOI] [PubMed] [Google Scholar]
- Maser RS, DePinho RA. Connecting chromosomes, crisis, and cancer. Science. 2002;297:565–569. doi: 10.1126/science.297.5581.565. [DOI] [PubMed] [Google Scholar]
- Cremer T, Cremer C, Baumann H, Luedtke EK, Sperling K, Teuber V, Zorn C. Rabl's model of the interphase chromosome arrangement tested in Chinese hamster cells by premature chromosome condensation and laser-UV-microbeam experiments. Human Genetics. 1982;60:46–56. doi: 10.1007/BF00281263. [DOI] [PubMed] [Google Scholar]
- Zalensky AO, Allen MJ, Kobayashi A, Zalenskaya IA, Balhorn R, Bradbury EM. Well-defined genome architecture in the human sperm nucleus. Chromosoma. 1995;103:577–590. doi: 10.1007/s004120050068. [DOI] [PubMed] [Google Scholar]
- Weierich Claudia, Brero Alessandro, Stein Stefan, Hase Johann von, Cremer Christoph, Cremer Thomas, Solovei Irina. Three-dimensional arrangements of centromeres and telomeres in nuclei of human and murine lymphocytes. Chromosome Research. 2003;11:485–502. doi: 10.1023/A:1025016828544. [DOI] [PubMed] [Google Scholar]
- Armstrong SJ, Franklin FCH, Jones GH. Nucleolus-associated telomere clustering and pairing precede meiotic chromosome synapsis in Arabidopsis thaliana. Journal of Cell Science. 2001;114:4207–4217. doi: 10.1242/jcs.114.23.4207. [DOI] [PubMed] [Google Scholar]
- de Lange T. Human telomeres are attached to the nuclear matrix. The EMBO Journal. 1992;11:717–724. doi: 10.1002/j.1460-2075.1992.tb05104.x. [DOI] [PMC free article] [PubMed] [Google Scholar]
- Molenaar C, Wiesmeijer K, Verwoerd NP, Khazen S, Eils R, Tanke HJ, Dirks RW. Visualizing telomere dynamics in living mammalian cells using PNA probes. The EMBO Journal. 2003;22:6631–6641. doi: 10.1093/emboj/cdg633. [DOI] [PMC free article] [PubMed] [Google Scholar]
- Barber C. Bradford, Dobkin P. David, Huhdanpaa Hannu. The quickhull algorithm for convex hulls. ACM Transactions on Mathematical Software. 1996;22:469–483. doi: 10.1145/235815.235821. [DOI] [Google Scholar]
- Nagele Robert G., Velasco Antonio Q., Anderson William J., McMahon Donald J., Thomson Zabrina, Fazekas Jessica, Wind Kelly, Lee Hsin-yi. Telomere associations in interphase nuclei: possible role in maintenance of interphase chromosome topology. Journal of Cell Science. 2001;114:377–388. doi: 10.1242/jcs.114.2.377. [DOI] [PubMed] [Google Scholar]
- Beatty B, Mai S, Squire J. FISH: A practical Approach. Oxford University Press, USA.; 2002. p. 274. [Google Scholar]
- Fest T, Mougey V, Dalstein V, Hagerty M, Milette D, Silva S, Mai S. c-MYC overexpression in Ba/F3 cells simultaneously elicits genomic instability and apoptosis. Oncogene. 2002;21:2981–2990. doi: 10.1038/sj.onc.1205274. [DOI] [PubMed] [Google Scholar]
- Figueroa R, Lindenmaier H, Hergenhahn M, Nielsen KV, Boukamp P. Telomere erosion varies during in vitro aging of normal human fibroblasts from young and adult donors. Cancer Research. 2000;60:2770–2774. [PubMed] [Google Scholar]
- DIPimage, a scientific image processing toolbox for MATLAB http://www.ph.tn.tudelft.nl/DIPlib/
- Meyer Frenand. Iterative image transformations for an automatic screening of cervical smears. The Journal of Histochemistry and Cytochemistry. 1979;27:128–135. doi: 10.1177/27.1.438499. [DOI] [PubMed] [Google Scholar]


