

Abstract
Fecal pollution indicators are essential to identify and remediate contamination sources and protect public health. Historically, easily cultured facultative anaerobes such as fecal coliforms, Escherichia coli, or enterococci have been used, but these indicators generally provide no information as to their source. More recently, molecular methods have targeted fecal anaerobes, which are much more abundant in humans and other mammals and some strains appear to be associated with certain host sources. Next-generation sequencing and microbiome studies have created an unprecedented inventory of microbial communities associated with fecal sources, allowing reexamination of which taxonomic groups are best suited as informative indicators. The use of new computational methods, such as oligotyping coupled with well-established machine learning approaches, is providing new insights into patterns of host association. In this review we examine the basis for host-specificity and the rationale for using 16S rRNA gene targets for alternative indicators and highlight two taxonomic groups, Bacteroidales and Lachnospiraceae, which are rich in host-specific bacterial organisms. Finally, we discuss considerations for using alternative indicators for water quality assessments with a particular focus on detecting human sewage sources of contamination.
Keywords: Sewage, fecal indicators, alternative indicators, water quality, next generation sequencing, microbial communities
Sanitation, health, and rationale for alternative indicators
Fecal pollution carries a myriad of pathogens, and contamination of water is a global public health problem [1]. In developing countries, sanitation issues are overt, with 2.4 billion people, approximately 30% of the world’s population, lacking access to sewage disposal [2, 3]. Urban areas can have inadequate sewage treatment infrastructure and in rural areas, residential sewage is routinely handled by piping it directly to rivers and streams that are also impacted by agricultural runoff, resulting in a mixture of human and animal sources [2]. In the United States (US), fecal pollution of waterways is a subtle but persistent problem. More than 44% of the nation’s rivers and 30% of the bays and estuaries are deemed impaired, with pathogens often cited as the number one cause of these impairments [4]. Pathogens are not directly measured because there are numerous possible agents and methods for their detection are time consuming and expensive. Instead pathogen presence is assumed based on detection of fecal indicator bacteria. Many rivers run through a combination of agricultural, suburban, and heavily urbanized areas before discharging to bays and estuaries, therefore, sources of fecal pollution are not easily assigned based on land use. Given the regulatory and public health implications of such assignments, empirical measurements of fecal pollution sources are needed.
The use of fecal indicators to detect fecal contamination has evolved over the past 100 years, but has primarily focused on coliforms, fecal coliforms, Escherichia coli, or enterococci [5]. These traditional indicators are commonly found in mammals and birds and continue to be widely used because detection methods are relatively fast, easy, and inexpensive. The advent of molecular methods allowed for non-cultured organisms to be used as ‘alternative’ fecal indicators (see Glossary). Until recently, only a few taxonomic groups such as Bacteroidales and Bifodobacterium have been explored. Next-generation sequencing technologies have given us an unprecedented inventory of the microbial community in a variety of environments. Prior to this, clone libraries only captured the most abundant community members, unless a large effort was undertaken [6]. Deep sequencing of the microbiome of humans and animals creates a new opportunity to explore a whole range of bacterial taxonomic groups suited for host-specific indicators. Comparison of microbial communities in humans and animal sources not only will validate the robustness of currently employed indicators, but will also allow us to identify new human and animal fecal pollution indictors.
Development of alternative indicators
In an effort to create more informative fecal pollution indicators, several aspects need to be considered. What organisms should be targeted? How are organisms that are uniquely associated with a host source best distinguished and detected? Promising targets for these efforts are organisms that dominate the microbiome but are not easily cultured. While functional genes may be responsible for the specialized activities of host-specific organisms, universal genes such as the 16S rRNA gene could be used to track these populations. In addition, some fecal pollution sources are a high priority for development of indicators. Discerning human sources (i.e., sewage) from other animal sources is important because of the implicit health risk posed by human sewage and the very different types of mitigation strategies needed to remediate sewage contamination compared with animal waste that is carried in surface runoff.
Fecal anaerobes as indicators
The intestinal track of humans and many animals are dominated by fecal anaerobes [6], making these organisms ideal targets for alternative indicators. By far, the most explored taxonomic group are the Bacteroidales [7–10], which are detailed later. Studies have also focused on Firmicutes [11, 12], Bifidobacteria [11, 13–16], and Methanobrevibacter smithii, a common archaeon in the intestine [17, 18]. Fecal anaerobes may be more indicative of the presence of pathogens because it is unlikely they will grow once released from their host into the environment, in contrast to E. coli and enterococci, which have been shown to persist and even grow in beach sand [19–22], algal mats [20, 23], and sediment [24–26].
The 16S rRNA gene as a marker
The 16S rRNA gene has several advantages as a genetic marker for host fecal indicators including high resolution, sensitivity and specificity, particularly when used as a combination of markers (Box 1). The use of multiple indicators and assessment of covariance patterns of host communities could untangle complex fecal pollution signals in watersheds that have multiple sources contributing to poor water quality [27, 28]. Employing the 16S rRNA gene as a genetic marker lends itself to community approaches, where fecal pollution sources without a known marker can be characterized at minimum by their unique signature of 16S rRNA gene sequences [29].
Box 1. Targets for alternative indicators: a case for 16S rRNA.
The 16S rRNA gene has long been recognized as a chromatic clock, distinguishing organisms from different lineages [109]. Recent studies have shown that high-resolution analysis of 16S rRNA gene sequences in closely related organisms reveals host related patterns (see Oligotyping section). Employing the 16S rRNA gene as a genetic marker for alternative fecal indicators has several advantages:
The 16S rRNA gene is the gold standard for defining bacterial community structure in the host and physical environment and is widely used in research studies.
It is universally present in bacterial genomes and contains hyper-variable regions that can distinguish closely related organisms.
The 16S rRNA gene usually occurs in multiple copies and therefore is potentially a more a sensitive target than single copy genes for detecting fecal bacteria in the environment.
Differential abundance and co-variance patterns across hosts can guide accurate classification of host sources based on 16S rRNA gene-based community structure even when there are no host-specific organisms.
Multiple levels of resolution, from phylum-level groupings to single nucleotide variation, can be employed to examine distinguishing patterns among the microbial community in different hosts.
The presence of highly abundant and diverse targets lends itself to innovative detection strategies.
Targets other than the 16S rRNA gene have been identified and have utility to detect specific sources. Subtractive hybridization or genomic enrichment has been used to find microbial sequences uniquely associated with a host source [30–32]. Identifying functional genes that are involved in microbial associations with their host is a promising approach, particularly when microbial populations that might differ between host sources cannot be distinguished by the 16S rRNA gene sequences [33]. While functional gene markers are highly specific, they may occur at lower abundances than 16S rRNA targets, and therefore may not be as sensitive for detection purposes [34]. Nevertheless, they can be employed to detect a specific source of fecal pollution and complement 16S rRNA targets.
Detecting sewage in the environment
Humans and animals each have different pathogens uniquely associated with them; therefore, the relationship between fecal indicators and pathogens is highly dependent on the source of fecal pollution and the disease prevalence in that population [35]. One important division in assessing health risk is distinguishing human vs. non-human sources. Epidemiological studies support a stronger association between fecal indicators and waterborne disease when there is sewage present compared with fecal pollution from non-human sources (i.e., animals contributing to non-point pollution) [36, 37]. Sewage contamination can be a subtle but chronic problem in urban areas [38–40]. High abundance commensal organisms may be sensitive and specific measures of unrecognized sewage contamination in surface waters and were found to be 3–4 orders of magnitude more abundant than pathogens or viral markers in sewage sources [41, 42].
Host microbiomes and specificity of commensal organisms
Research to identify alternative indicators is predicated on the assumption that at least some members of the fecal bacterial community are either specifically adapted to or selected for by the host gut environment. However, deciphering similarities and differences in the microbiome among host groups requires a deeper understanding of the functional basis for community differences, and high resolution approaches to track the key community members that might be most informative as indicators for a particular host source. Some of the issues and approaches for selecting candidates for alternative indicators are discussed below, including issues related to tracking human sources of fecal pollution.
Host microbiome patterns
Whole community analysis based on 16S rRNA gene sequencing of the fecal microbial community provides strong evidence that there are host patterns in bacterial assemblages [43, 44]. Diet has been shown to play a major role in shaping the gut microbiome with clear distinctions between herbivores and carnivores [27, 43, 44]. Diet also modulates the composition of the community in humans [45–48] and studies illustrate differences in community structure with a plant-based versus a westernized diet [49]. Cattle reared on different feeds also showed distinct gut communities [50]. Host genetics is also thought to influence microbiome composition [51, 52]. Although it is difficult to disentangle all contributing factors that account for host microbiome patterns, within some bacterial genera there is evidence of host adapted lineages [53], illustrating host physiology combined with long term dietary preferences can create ecotypes, i.e., strains in a ecological niche, that are associated with a particular host.
Understanding the basis for microbiome patterns found in a particular host would allow us to choose organisms that are host-adapted and therefore inherently stable or specific to a single host. Ideal indicators for a particular host source may be ‘core’ community members, which have been suggested to fulfill a critical role within the host [54–56]. For humans, the microbiome of individuals can be highly variable [57], therefore using untreated sewage as an integrated sample of the human population is a useful approach to identify possible human associated indicators [12]. The ever growing datasets from microbiome studies will be useful for host to host comparisons, however prospective studies are needed that control for confounding factors such as co-habitation or short term dietary influences, which can overprint organisms onto communities that are shaped by selective, adaptive, and evolutionary processes.
Bioinformatic challenges to distinguish closely related organisms
Choosing an appropriate level of resolution is critical when assessing similarities and differences among the microbial communities using the 16S rRNA gene. Defining shared members across different hosts depends on the sensitivity of the taxonomic units employed. The most common approaches to partition 16S rRNA gene reads are (i) taxonomic assignments via classifiers such as Ribosomal Database Project (RDP) classifier [58] or GAST [59], or (ii) de novo cluster analyses without the requirement of a curated taxonomic database (see [60] for a review of taxonomy-independent methods).
In most cases operational taxonomic units (OTUs) created by clustering 16S rRNA genes at a 97% sequence similarity threshold creates a more highly resolved dataset than sequence-based taxonomic assignments alone, and is enough to explain patterns in a given dataset. However, these OTUs often are phylogenetically mixed units [61] and fail to explain the distribution of very closely related organisms across samples. Identifying markers that can distinguish fecal sources requires the use of more sensitive approaches, as even one nucleotide difference at the 16S rRNA gene-level may correspond to remarkable genomic variation [62, 63], and organisms that are more than 99% similar at the 16S rRNA gene level can occupy different ecological niches [64, 65].
Oligotyping: a new method to distinguish closely related organisms
Oligotyping is a recently introduced computational method that allows the identification of closely related but distinct organisms that would fall into one OTU or taxon [65]. The method relies on Shannon entropy [66] for the identification of highly variable nucleotide positions among reads, and defines oligotypes by concatenating nucleotides from positions of interest. Several studies have used oligotyping to explain the distribution patterns of closely related organisms that are lumped together into one taxon [67–69]. Figure 1 exemplifies the power of this approach with high-resolution results for 30 million sequence reads classified as genus Bacteroides from human fecal samples. Some Bacteroides oligotypes identified in this dataset showed differential distribution patterns between geographically distinct human populations where clustering reads into 97% OTUs did not distinguish these sub-populations [65]. Below, we highlight the use of oligotyping to recover host related patterns in the genus Blautia across human and six animal hosts [70].
Figure 1.
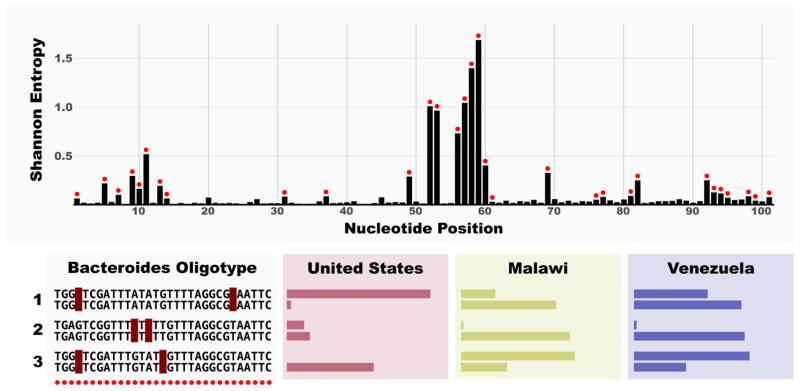
Resolution of three Bacteroides OTUs using oligotyping to discern differences in human populations across a wide geographic distance. The top panel shows the entropy analysis of 30,637,709 101 nt long V4 reads that are identified as Bacteroides in a publicly available dataset by Yatsunenko et al. [49]. Red dots on entropy bars indicate the nucleotide positions used for oligotyping analysis. Lower panel exemplifies three OTUs that could be further resolved with oligotyping. Colored bars represent the prevalence of a given oligotype in gut samples, where a full bar indicates that the oligotype was found in all individuals from the given region. Each group has two oligotypes that show remarkable differential distribution patterns among human populations that is missed by taxonomical analysis and OTU clustering at 97%. These results were originally reported by Eren et al. [65].
Defining presence/absence and differential abundance schemes
The identification of host sources may not be as straightforward as relying on strict presence/absence of a particular organism or defined taxonomic unit, and classification of host sources using community data may need to rely upon differential abundance patterns. The distribution patterns of microbial organisms among hosts vary, and a common terminology for the identification of these classes is a necessary step for communication. For instance, the term ‘host-specific’ is used broadly in the current literature, where, in some cases it describes a taxon that strictly occurs in samples from only one host species; in other cases it describes a taxon that is differentially more abundant or prevalent in samples from one host species. Although both definitions of host-specificity are important to classify the origin of the fecal pollution, they pose different theoretical and practical meanings.
Recently, we suggested four terms to describe patterns of occurrence across different species: cosmopolitan, host-preferred, host-associated, and host-specific [70]. The term cosmopolitan identifies taxonomic units that do not show any discernible preference for a host. A host-preferred distribution describes an organism that is significantly more abundant in samples from one host species while it may occur in other hosts at lower abundances. A host-associated taxonomic unit occurs only in one host species, but not necessarily in every individual of that host species. Finally, the term host-specific (i.e., strictly host-specific) is reserved for taxonomic units present in every sample from one host species, i.e., they are core members, and absent in every other host organism. Figure 2 demonstrates four distribution profiles coinciding with these terms. In this schema, a host-preferred organism can be used to generate an accurate model for host identification using the entire microbial community, however, host-specific and host-associated markers can accommodate more targeted molecular approaches.
Figure 2.
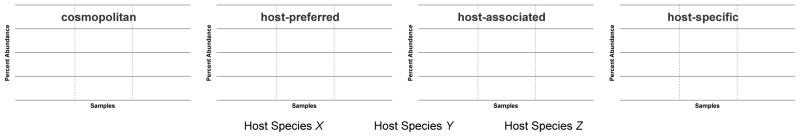
Possible differential abundance patterns of organisms in host species. We propose terminology to describe different abundance patterns of members in the microbial community of host species, as originally reported in [70]. Cosmopolitan refers to organisms prevalent in all host species with no distinguishing patterns of abundance. Organisms that highly abundance in one host species and have low abundance or are absent in other hosts are designated as ‘host-preferred’. Organisms that are in only one host species but not detected in all individuals are designated ‘host-associated’. When describing occurrence patterns, the term host-specific is reserved for organisms that are present in all individuals of a host and absent in other host species. Many other patterns are possible; these terms are working definitions that can be used to assess candidate alternative indicators.
Computational methods for interpreting host microbiome patterns
In some cases, strictly host-specific markers may be rare in a host species. More likely, differential abundance patterns will need to be used to accurately identify hosts. There are numerous machine learning algorithms, including support vector machines [71], artificial neural networks [72], and random forests [73] that can be trained with known microbial community structures to classify environmental samples of unknown origin. Random forest have successfully been used in the context of source tracking using phenotypic data of E. coli [74] and classifying hosts according to Blautia profiles [70], and its applicability to microbiome data is shown in a recent review by Statnikov et al. [75]. The random forest algorithm can handle very large input datasets, tolerate outliers in the input data, and generate an unbiased estimate of the classification error.
Computational tools have also been specifically designed for determining sources of organisms. PyroMiST [76] is a custom online tool using next-generation 16S rDNA sequencing data of total bacterial communities or Bacteroidetes and identifies shared OTUs between sources and contaminated water. SourceTracker [77] utilizes a Bayesian approach to estimate the proportion of contaminating sequences in a given community that come from possible source environments. SourceTracker was originally designed to detect contamination in high throughput sequence datasets, but may have interesting applications for identifying fecal bacteria sources in water samples as contaminant-derived organisms are often a minor component compared to the abundance of the natural community [28].
Identification of host-preferred taxonomic units is another important aspect of studies that seek to identify individual indicators for fecal pollution in complex microbiome datasets. No standard difference in relative abundance has been established to define whether an organism is considered shared between two samples or two hosts, or if it is simply a transient member in one of the communities. In one study, community members were considered shared when they did not vary by more than two orders of magnitude [57], which may be a practical threshold when identifying host preferred taxonomic units for microbial source tracking. Although correlations between the relative abundance of an organism and a host species may be statistically meaningful, findings may not translate to biological relevance [78]. However, host-preferred taxonomic units can still be viable targets for more focused analyses. One software package that can be used to explore host-preferred organisms in a dataset is STAMP [79], which provides a user-friendly graphical environment for comparative metagenomics. Another alternative is LEfSE [80], which also can identify taxonomic units that are highly associated with a previously defined class in a dataset and quantify their effect size.
Promising alternative indicator groups and water quality applications
Below we provide an overview of two groups of fecal anaerobes that contain several members that are good candidates for alternative indicators and discuss using community analysis directly as an approach for assessing water quality. Bacteroidales was one of the first taxonomic groups explored [7, 81] and multiple studies whose aim was to develop alternative indicators have focused on this group. Other groups such as Lachnospiraceae are just beginning to be explored for new indicators [12]. As databases grow from microbiome research and new studies seek host-specific indicators, we may find that no single indicator can provide 100% specificity for a host source. Under this scenario, combinations of alternative indicators from different taxonomic groups or whole community profiling may be needed to resolve pollution sources.
Bacteroidales
Early studies using terminal restriction fragment length polymorphisms to characterize populations of Bacteroidales provided evidence that members of this group had a high degree of host-specificity [8]. Cloning and sequencing of the V1–V3 region of 16S rRNA genes in Bacteroidales has led to development of PCR and quantitative real-time PCR (qPCR) assays where the V2 region is used to differentiate Bacteroidales from different hosts [9, 10, 82–85].
Currently, the most widely used assays for sewage contamination employ the HF183 primer sequence first described by Bernard and Field [86] and are reported to be the most specific and sensitive of the human fecal pollution assays [87–90]. Assays that utilize the HF183 primer and others that target closely related variants [83, 84, 91, 92] detect a recently described species within Bacteroides, B. dorei [84]. Ruminant markers [85, 93] have proven to be both sensitive and specific [94, 95] suggesting a core Bacteroidales population in ruminant hosts [95]. Genetic markers that detect bovine hosts (i.e., cattle or cows) generally have been found to cross-react with other ruminants or horses [94], suggesting the 16S rRNA gene maybe not be a discriminatory target for microbiome members unique to bovine sources [33]. Assays targeting pigs and dogs [82, 83], as well as those targeting wildlife have been described [96, 97].
A recent evaluation study involving 41 laboratories in the US and EU and 13 different Bacteroidales host genetic markers (among 27 different assays assessed) overall demonstrated human-specific markers have minimal cross reactivity with animals, with other non-human markers showing some diminished specificity or sensitivity for their hosts [94]. In a geographically expansive comparison study that spanned 16 countries and six continents, results suggested that ruminant markers were robust worldwide, but human markers seem to be less prevalent and stable in some regions of the world and could be improved for global applications [95] (Box 2).
Box 2. Geographic considerations: a case study.
Differences in the microbiome of humans across geography and cultures have been reported [49, 110], which needs to be taken into account when developing human fecal pollution indicators. One of the most cited differences in humans in worldwide comparisons is the higher relative abundance of Bacteroides in those exposed to a westernized diet [49]. A case study was conducted in Jenipapo, in the state of Bahia, Brazil, which is a small rural village with a population of ~2,500 in the north central region of the country [111]. In this study, next-generation sequencing of sewage from the major city of Salvador and human fecal samples from village residents demonstrated that the microbiome of humans in Brazil were dominated by Prevotella and multiple species within Lachnospiracae and Ruminococcaceae, which collectively accounted for nearly 75% of the fecal microbial community, whereas Bacteroides comprised <1%. The microbiome composition of human fecal samples was reflected in deep sequencing profiles of the microbial community in polluted river water. A transect of the river from a sparsely populated area upstream to sites downstream of the village demonstrated increasing relative abundance of Prevotella and Lachnospiraceae with increasing density of village residences. Oligotypes within Prevotella and Blautia indicative of humans were found to be low or absent in pig, dog, horse and cow feces and could be traced with increased residential density in the river transect (Figure I). Microbiome studies on geographically distinct human and animal populations will provide further insights into new targets for indicators of human fecal pollution that have global applicability.
Figure I.
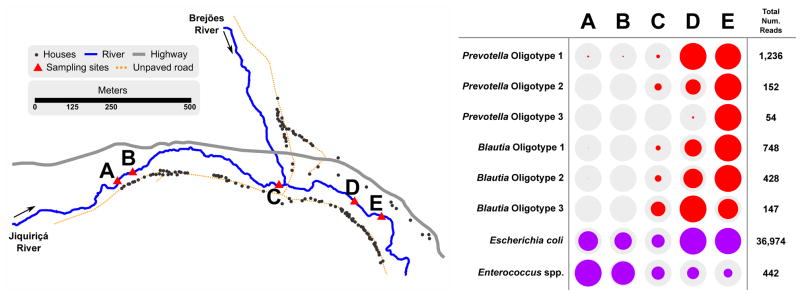
Traditional indicators and Prevotella and Lachnospiraceae oligotypes demonstrating human fecal pollution inputs. River sampling transect in the Jiquiriçá River and increasing human Prevotella and Lachnospiraceae oligotypes with increasing residential density. Map shows residential structures along the river transect. Colored circles in the table are proportional to the relative abundance of human Prevotella or Lachnospiraceae oligotypes (red) or the relative abundance of sequences classified as E. coli or Enterococci sp. as a measure of overall fecal pollution (purple). Data were originally reported in Koskey et al. [111].
Lachnospiraceace
The Fimicutes, and in particular Clostridiales, have only recently been explored for host indicators despite the fact that they are a major constituent of the fecal microbiome of humans and other animals [6, 43, 98]. Lachnospiraceae, analogous to Clostridium cluster XIVa or C. coccoides group [99], is highly abundant in untreated human sewage from major US cities [12, 100, 101]. Examination of Lachnospiraceae population structure in humans and sewage, as well as cattle and chickens for comparison, revealed host-related structure with many oligotypes abundant in humans or sewage, and low or absent in these animals [12]. Further, comparison of sewage samples and a dataset of 48 human samples revealed that sewage can serve as a population level assessment of human sewage contamination [12]. One assay designated Lachno2 was designed to target the second most abundant Lachnospiraceae sequence (affiliated with the genus Blautia) in a sewage dataset, and this sequence unlike the most abundant Lachnospiraceae sequence could differentiate between human and cattle fecal contamination [42]. However, more extensive testing is needed to determine what other host types cross-react with the assay. Lachnospiraceae appears to be rich in human related indicators, more so than other families within Clostridiales, including Ruminococcaceae and Clostridiaceae [12].
A more extensive study focusing on the genus Blautia in seven hosts with greater than 57M sequence reads of the V6 region of the 16S rRNA gene revealed a population structure that could resolve hosts into different groups [70]. Figure 3 shows clustering of host groups, and a heat map of Blautia oligotypes with their differential abundance pattern in the host types. A random forest classifier trained with the Blautia oligotypes resulted in zero generalization error for all sample groups except deer (where one deer sample was confused with cows), and the cat group (where one cat sample was confused with dogs). In that study, 13 host-specific oligotypes were found to identify humans, swine, cow, deer, and chickens, however, most oligotypes (171 of 200 total) showed host-preference rather than host-specificity. Similar to another report of microbiome patterns [102], humans or sewage and pigs were more similar to each other than other host groups, including samples from both the US and Brazil.
Figure 3.
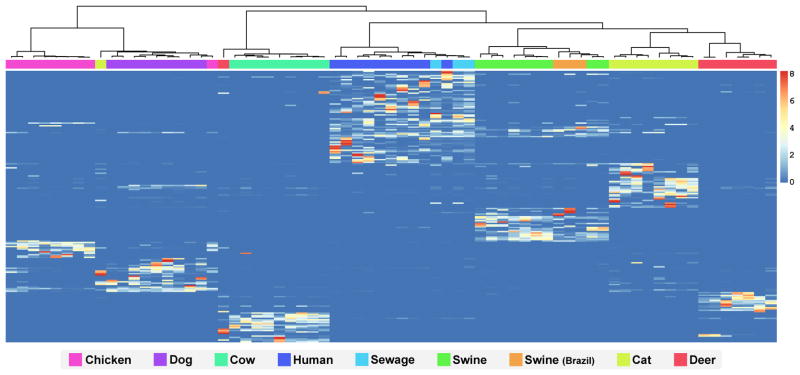
Blautia populations in sewage, humans and animals display host preference and specificity. Heatmap analysis of Blautia oligotypes. The dendrogram (top) shows the hierarchical clustering of samples based on Morisita-Horn dissimilarity index. The samples are ordered based on clustering according to their oligotype profiles, and the oligotypes were ordered based on their occurrence patterns in samples. Blue color identifies oligotypes that are absent or represented by a very small number of reads in a sample. Data are originally presented in McLellan et al. [12].
Microbial source tracking using community analysis
In addition to identifying candidates for genetic markers, community analysis can be used directly to assess fecal pollution sources. Advantages include gaining information about all sources that are present and their relative contribution, even those that do not have genetic markers. Surface water community profiles can also provide information about changes in the natural community in contaminated waters [27]. Community approaches can complement single marker investigations and answer the question of “have we identified all the pollution sources present?”.
Whole community approaches cover a range of methodologies with various levels of resolution and were recently evaluated in a multi-lab comparison study [29, 94]. Terminal restriction fragment length polymorphism (TRFLP) has been used to track sewage signals across a gradient from upstream drain locations to downstream creek sites [103]. With TRFLP, differences in community members are defined by a restriction site within an amplified gene (in this case the 16S rRNA gene), which could equate to a single base pair difference between two community members. A second approach using published sequences in a microarray (i.e., PhyloChip) and identified more than 500 OTUs associated with human fecal pollution [104]. The subsequent study of 42 samples from wastewater treatment plants and septic collection tanks, and cows, horses, elk, various birds, sea lions and seals demonstrated a clustering of samples according to sources [27]. The abundance of Bacilli and Gammaproteobacteria clearly discriminated birds from mammals, which in contrast to birds, were primarily dominated by Clostridia and Bacteroidales [27]. One limitation to this approach is that some sources may be under-characterized in 16S rRNA databases [27], however, with rapidly expanding marker gene surveys, this may be a short-term limitation.
Next-generation sequencing data has been used directly to characterize fecal sources and contaminated water. Unno et al. [105] sequenced the V1 and V3 regions of the 16S rRNA gene and noted marked differences between human and domesticated animals compared with wild geese, which were dominated by Proteobacteria. In this study, human and swine sources were implicated in the Yeongsan river basin (Jeonnam Province, South Korea) by identifying shared OTUs between fecal sources and river sites. These authors noted that targeted sequencing of Bacteroidetes or Firmicutes in environmental samples would reduce the number of reads needed to identify sources and allow for more sites to be analyzed [105]. In another study, Lee et al. [102] sequenced the V2 region to characterize fecal matter from humans, chickens, cows, geese, and pigs and suggested that OTUs within Fimicutes were primarily responsible for the host-associated clustering patterns observed. This study found that while the general composition of host microbiomes was similar, specific organisms from a particular fecal origin were found. Taken together, these studies highlight the power of next-generation sequencing to directly identify sources or to choose indicators specifically tailored for water quality applications.
Concluding remarks and future directions
E. coli or enterococci have applications as fecal indicators when basic information is needed to determine if fecal pollution is present. Simple measurements of these indicators can answer public health questions such as “should I drink this water?” or “should I swim at this beach?”. However, these measurements are not useful when there is evidence of chronic contamination and fecal pollution sources need to be identified to address the problem, such as gull feces on beaches (Box 3). Ultimately, source identification and remediation of contamination rather than simple detection will protect public health and improve recreational opportunities afforded by our natural resources.
Box 3. Addressing chronic contamination of beaches by shorebirds and waterfowl.
Demonstrating the absence of sewage indicators is not particularly useful for monitoring beaches with evidence of chronic fecal pollution. Beachgoers have direct contact with water so the causes of elevated E. coli or enterococci levels need to be explained and addressed. Gulls, other shorebirds and waterfowl are suspect fecal pollution sources at many beaches. Gulls appear to harbor very different fecal microbial communities than humans, one that is dominated by enterococci and E. coli, with a limited number of fecal anaerobes [27, 112, 113]. Based on cloning of the microbial community, a genetic marker targeting Catellicoccus marimammalium was described by Lu and colleagues [112]. Deep sequencing demonstrated this organism was the dominant community member (in some cases comprising >90% of the total community) in gull feces and much more abundant then traditional enterococci fecal indicators [113]. Comparison with sewage samples that were also deeply sequenced [100] suggested this target was completely absent in sewage and therefore potentially a reliable marker to complement sewage indictors at beaches. In this instance, the depth of next-generation sequencing shed light on the usefulness of the gull genetic marker targeting Catellicoccus marimammalium.
Instead of looking for one genetic marker at a time, we are now able to step back and examine the whole community to assess various targets. In addition, new technologies are lending themselves to innovative approaches for water quality applications. Detection strategies could employ the entire community or a broad taxonomic group such as Bacteroidales or Clostridiales as a fingerprint. Assays could target key, specific members either singly or in combination using qPCR, hybridization, sequencing, or could employ other strategies not yet envisioned. The 16S rRNA gene is a robust genetic marker that maps to microbial members within host niches. We need to learn more about the genomic basis for host colonization and specialization to better understand selection, adaption, and drivers of the microbiome (Box 4). The Human Microbiome Project [106], the Earth Microbiome Project [107], and the growing number of other microbiome research studies provide a resource for the development of new indicators for fecal pollution. Minimal marker gene survey metadata [108] can provide some information about the source of samples but gaps in knowledge likely need to be filled with studies designed to answer specific questions. Prospective studies are needed to systematically catalog microbiome data of humans and animals and control for diet, geographic distributions, and other external factors.
Box 4. Outstanding questions.
What is the variation in the microbiome of individuals and geographically disbursed populations of human and animal hosts?
Are there core microbiome members and are these specific to a host species or do they have a broader distribution among other hosts (i.e., are core organisms specialists or generalists)?
How do cultured representatives currently capture host-specific sub-populations and what additional culture efforts are needed for genomic studies?
What is the biological relevance of the host patterns observed in fecal taxa (i.e., Clostridales or Bacteroidales)?
What is the functional basis for host-specificity? Do strictly host-specific organisms fulfill a key metabolic function or are they selected for by host physiology?
As microbiome research advances, further understanding of the ecology and forces that shape the gut microbiome will accelerate discovery and validation of new indicators. Likewise, the studies directed at identifying host-specific organisms for environmental and public health applications provide glimpses into basic questions in microbial ecology. We suggest that microbial source tracking studies, taken as a whole, could be seen as the ‘field experiment’ that tests for host structure in natural host populations. Integration across disciplines will enhance our understanding of human and animal microbiomes and expedite discovery of alternative indicators of fecal pollution.
Highlights.
Microbiome research affords new opportunities for choosing indicators of fecal pollution.
Highly resolved 16S rRNA gene sequences reveal host patterns in closely related organisms.
Bacteriodales and Clostridiales are rich in host specific indicators.
Acknowledgments
We thank Mitchell Sogin for contributing insights into 16S rRNA evolution in microbial populations and Ryan Newton for discussion and suggestions for this review. We also thank Ronald Blanton and Rafael Ponce Terashima for working with us in collaborative studies in Salvador and Jenipapo, Brazil. Finally, we thank lab members Jen Fisher, Deb Dila, Patricia Bower, Danielle Cloutier, Morgan Schroeder, Ryan Bartleme, Hayley Templer and Amber Koskey for contributing to the review of literature.
Glossary
- Alternative indictor
an organism or non-biological constituent of fecal pollution or sewage that is used to indicate the presence of fecal pollution. Constituents can range from commensal organisms found only in one type of host species to viruses, caffeine, or optical brighteners. These indicators are often used to the complement traditional indicators including fecal coliforms, Escherichia coli or enterococci in investigative studies. In this review, we examine commensal organisms as indicators that can provide information on the host source
- Core community member
an organism that is found in all individuals of a host species or related group of host species (i.e., ruminants). Core community members are hypothesized to fulfill a critical role in the host or be specifically adapted to the host’s physiology. A core member is not necessarily exclusive to the host species in which they are found, but may be found in other hosts as either an essential or transient member of the community
- Cosmopolitan
refers to the ubiquitous distribution of an organism among samples of different host species, where they occur in almost all individuals and hosts at varying relative abundances, with no distinctive pattern
- Entropy
variation in the nucleotide sequence of a position in aligned sequences. Entropy at certain positions can correspond to a phylogenetic signal
- Genetic marker
a DNA sequence that can be used to track an organism or closely related subpopulation of organisms that share the marker. A genetic marker is the sequence that can be targeted by primers to make an assay specific for a host source
- Host-associated
refers to the abundance pattern of an organism found in one host species, but not every individual of that host, and is absent in other host species
- Host-preferred
describes the abundance pattern of an organism that is dominant in all individuals of a host species and low or absent in other host species
- Host-specific
may be used as a general reference to organisms that are indicative of host sources. In describing different abundance patterns of host microbial communities, we define host-specific more stringently, to mean strictly host-specific, where organisms are present in all individuals of a host species and absent in all other hosts
- Microbial source tracking
the process of determining the source of fecal bacteria found in contaminated environments. General indicators such as fecal coliforms, E. coli and enterococci in most cases do not provide information as to the host in which they originated. Alternatives to these general indicators, i.e., alternative indicators, are based on commensal bacteria specifically associated with a host
- Oligotyping
a supervised computational method to analyze closely related sequences based on only considering high entropy positions. Oligotypes can be any length and could use the entire 16S rRNA gene sequence, but generally consist of 20–30 bps chosen from a sequence read of 60–250 bp depending on the sequencing platform. Oligotyping complements OTU clustering methods as it can resolve ecologically distinct organisms that may only vary by a single bp in regions of a selected 16S rRNA region used for community analysis
- Operational taxonomic units (OTUs)
taxonomic units typically defined by a sequence-similarity based criterion. The most commonly used criterion, is 16S rRNA gene sequence clustering at a 97% similarity threshold. This approach minimizes inflated diversity because of sequencing errors while preserving resolution of closely related organisms
- Taxonomic unit
a general designation for different levels of resolution in classifying organisms (family, genus, species, strain, or operational taxonomic unit defined by sequence analysis). In this review we introduce oligotype as a taxonomic unit. The abbreviated term ‘taxa’ is often used
Footnotes
Publisher's Disclaimer: This is a PDF file of an unedited manuscript that has been accepted for publication. As a service to our customers we are providing this early version of the manuscript. The manuscript will undergo copyediting, typesetting, and review of the resulting proof before it is published in its final citable form. Please note that during the production process errors may be discovered which could affect the content, and all legal disclaimers that apply to the journal pertain.
References
- 1.World Health Organization (WHO) and United Nations Children’s Fund (UNICEF) Joint Monitoring Programme on Water Suppply and Sanitation (JMP). First meeting of the Advisory Group; Geneva. 23–25 April 2003.2003. [Google Scholar]
- 2.World Health Organization (WHO), et al. Global water supply and sanitation assessment 2000 report. World Health Organization; Geneva: 2000. [Google Scholar]
- 3.Langergraber G, Muellegger E. Ecological Sanitation--a way to solve global sanitation problems? Environ Int. 2005;31(3):433–44. doi: 10.1016/j.envint.2004.08.006. [DOI] [PubMed] [Google Scholar]
- 4.USEPA. National Water Quality Inventory: Report to Congress. 2009. [Google Scholar]
- 5.Dufour AP, Schaub S. The evolution of water quality criteria in the United Sates, 1922–2003. In: Wymer LJ, editor. Statistical Framework for Recreational Water Quality Monitoring. John Wiley & Sons, Ltd; New York: 2007. [Google Scholar]
- 6.Eckburg PB, et al. Diversity of the human intestinal microbial flora. Science. 2005;308(5728):1635–1638. doi: 10.1126/science.1110591. [DOI] [PMC free article] [PubMed] [Google Scholar]
- 7.Kreader CA. Design and evaluation of Bacteroides DNA probes for the specific detection of human fecal pollution. Appl Environ Microbiol. 1995;61(4):1171–9. doi: 10.1128/aem.61.4.1171-1179.1995. [DOI] [PMC free article] [PubMed] [Google Scholar]
- 8.Bernhard AE, Field KG. Identification of nonpoint sources of fecal pollution in coastal waters by using host-specific 16S ribosomal DNA genetic markers from fecal anaerobes. Appl Environ Microbiol. 2000;66(4):1587–94. doi: 10.1128/aem.66.4.1587-1594.2000. [DOI] [PMC free article] [PubMed] [Google Scholar]
- 9.Layton A, et al. Development of Bacteroides 16S rRNA gene TaqMan-based real-time PCR assays for estimation of total, human, and bovine fecal pollution in water. Appl Environ Microbiol. 2006;72(6):4214–24. doi: 10.1128/AEM.01036-05. [DOI] [PMC free article] [PubMed] [Google Scholar]
- 10.Okabe S, et al. Quantification of host-specific Bacteroides-Prevotella 16S rRNA genetic markers for assessment of fecal pollution in freshwater. Appl Microbiol Biotechnol. 2007;74:890–901. doi: 10.1007/s00253-006-0714-x. [DOI] [PubMed] [Google Scholar]
- 11.Wery N, et al. Human-specific fecal bacteria in wastewater treatment plant effluents. Water Res. 2010;44(6):1873–83. doi: 10.1016/j.watres.2009.11.027. [DOI] [PubMed] [Google Scholar]
- 12.McLellan SL, et al. Sewage reflects the distribution of human faecal Lachnospiraceae. Environ Microbiol. 2013;15(8):2213–27. doi: 10.1111/1462-2920.12092. [DOI] [PMC free article] [PubMed] [Google Scholar]
- 13.Balleste E, Blanch AR. Bifidobacterial diversity and the development of new microbial source tracking indicators. Appl Environ Microbiol. 2011;77(10):3518–25. doi: 10.1128/AEM.02198-10. [DOI] [PMC free article] [PubMed] [Google Scholar]
- 14.Resnick IG, Levin MA. Assessment of bifidobacteria as indicators of human fecal pollution. Appl Environ Microbiol. 1981;42(3):433–8. doi: 10.1128/aem.42.3.433-438.1981. [DOI] [PMC free article] [PubMed] [Google Scholar]
- 15.Marti R, Dabert P, Pourcher AM. Pig manure contamination marker selection based on the influence of biological treatment on the dominant fecal microbial groups. Applied and Environmental Microbiology. 2009;75(15):4967–4974. doi: 10.1128/AEM.02791-08. [DOI] [PMC free article] [PubMed] [Google Scholar]
- 16.Gomez-Donate M, et al. New molecular quantitative PCR assay for detection of host-specific Bifidobacteriaceae suitable for microbial source tracking. Applied and Environmental Microbiology. 2012;78(16):5788–5795. doi: 10.1128/AEM.00895-12. [DOI] [PMC free article] [PubMed] [Google Scholar]
- 17.Ufnar JA, et al. Methanobrevibacter ruminantium as an indicator of domesticated-ruminant fecal pollution in surface waters. Applied and Environmental Microbiology. 2007;73(21):7118–7121. doi: 10.1128/AEM.00911-07. [DOI] [PMC free article] [PubMed] [Google Scholar]
- 18.Johnston C, et al. A real-time qPCR assay for the detection of the nifH gene of Methanobrevibacter smithii, a potential indicator of sewage pollution. J Appl Microbiol. 2010;109(6):1946–56. doi: 10.1111/j.1365-2672.2010.04824.x. [DOI] [PubMed] [Google Scholar]
- 19.Alm EW, Burke J, Spain A. Fecal indicator bacteria are abundant in wet sand at freshwater beaches. Water Research. 2003;37(16):3978–3982. doi: 10.1016/S0043-1354(03)00301-4. [DOI] [PubMed] [Google Scholar]
- 20.Whitman RL, et al. Occurrence of Escherichia coli and enterococci in Cladophora (Chlorophyta) in nearshore water and beach sand of Lake Michigan. Appl Environ Microbiol. 2003;69(8):4714–9. doi: 10.1128/AEM.69.8.4714-4719.2003. [DOI] [PMC free article] [PubMed] [Google Scholar]
- 21.Yamahara KM, Walters SP, Boehm AB. Growth of enterococci in unaltered, unseeded beach sands subjected to tidal wetting. Appl Environ Microbiol. 2009;75(6):1517–24. doi: 10.1128/AEM.02278-08. [DOI] [PMC free article] [PubMed] [Google Scholar]
- 22.Phillips MC, et al. Relationships between sand and water quality at recreational beaches. Water Research. 2011;45(20):6763–6769. doi: 10.1016/j.watres.2011.10.028. [DOI] [PMC free article] [PubMed] [Google Scholar]
- 23.Olapade OA, et al. Microbial communities and fecal indicator bacteria associated with Cladophora mats on beach sites along Lake Michigan shores. Appl Environ Microbiol. 2006;72(3):1932–8. doi: 10.1128/AEM.72.3.1932-1938.2006. [DOI] [PMC free article] [PubMed] [Google Scholar]
- 24.Desmarais TR, Solo-Gabriele HM, Palmer CJ. Influence of soil on fecal indicator organisms in a tidally influenced subtropical environment. Applied and Environmental Microbiology. 2002;68(3):1165–1172. doi: 10.1128/AEM.68.3.1165-1172.2002. [DOI] [PMC free article] [PubMed] [Google Scholar]
- 25.Byappanahalli MN, et al. Population structure, persistence, and seasonality of autochthonous Escherichia coli in temperate, coastal forest soil from a Great Lakes watershed. Environmental Microbiology. 2006;8(3):504–513. doi: 10.1111/j.1462-2920.2005.00916.x. [DOI] [PubMed] [Google Scholar]
- 26.Ishii S, et al. Presence and growth of naturalized Escherichia coli in temperate soils from Lake Superior watersheds. Appl Environ Microbiol. 2006;72(1):612–21. doi: 10.1128/AEM.72.1.612-621.2006. [DOI] [PMC free article] [PubMed] [Google Scholar]
- 27.Dubinsky EA, et al. Application of phylogenetic microarray analysis to discriminate sources of fecal pollution. Environ Sci Technol. 2012;46(8):4340–7. doi: 10.1021/es2040366. [DOI] [PubMed] [Google Scholar]
- 28.Newton RJ, et al. A microbial signature approach to identify fecal pollution in the waters off an urbanized coast of Lake Michigan. Microb Ecol. 2013;65(4):1011–23. doi: 10.1007/s00248-013-0200-9. [DOI] [PMC free article] [PubMed] [Google Scholar]
- 29.Cao Y, et al. Evaluation of molecular community analysis methods for discerning fecal sources and human waste. Water Res. 2013;47(18):6862–72. doi: 10.1016/j.watres.2013.02.061. [DOI] [PubMed] [Google Scholar]
- 30.Hamilton MJ, Yan T, Sadowsky MJ. Development of goose- and duck-specific DNA markers to determine sources of Escherichia coli in waterways. Appl Environ Microbiol. 2006;72(6):4012–9. doi: 10.1128/AEM.02764-05. [DOI] [PMC free article] [PubMed] [Google Scholar]
- 31.Shanks OC, et al. Competitive metagenomic DNA hybridization identifies host-specific microbial genetic markers in cow fecal samples. Appl Environ Microbiol. 2006;72(6):4054–60. doi: 10.1128/AEM.00023-06. [DOI] [PMC free article] [PubMed] [Google Scholar]
- 32.Shanks OC, et al. Identification of bacterial DNA markers for the detection of human fecal pollution in water. Appl Environ Microbiol. 2007;73(8):2416–22. doi: 10.1128/AEM.02474-06. [DOI] [PMC free article] [PubMed] [Google Scholar]
- 33.Shanks OC, et al. Quantitative PCR for detection and enumeration of genetic markers of bovine fecal pollution. Appl Environ Microbiol. 2008;74(3):745–52. doi: 10.1128/AEM.01843-07. [DOI] [PMC free article] [PubMed] [Google Scholar]
- 34.Ebentier DL, et al. Evaluation of the repeatability and reproducibility of a suite of qPCR-based microbial source tracking methods. Water Res. 2013;47(18):6839–48. doi: 10.1016/j.watres.2013.01.060. [DOI] [PubMed] [Google Scholar]
- 35.Ashbolt NJ, et al. Predicting pathogen risks to aid beach management: the real value of quantitative microbial risk assessment (QMRA) Water Res. 2010;44(16):4692–703. doi: 10.1016/j.watres.2010.06.048. [DOI] [PubMed] [Google Scholar]
- 36.Colford JM, Jr, et al. Water quality indicators and the risk of illness at beaches with nonpoint sources of fecal contamination. Epidemiology. 2007;18(1):27–35. doi: 10.1097/01.ede.0000249425.32990.b9. [DOI] [PubMed] [Google Scholar]
- 37.Schoen ME, Ashbolt NJ. Assessing pathogen risk to swimmers at non-sewage impacted recreational beaches. Environ Sci Technol. 2010;44(7):2286–91. doi: 10.1021/es903523q. [DOI] [PubMed] [Google Scholar]
- 38.Sercu B, et al. Storm drains are sources of human fecal pollution during dry weather in three urban southern California watersheds. Environmental Science & Technology. 2009;43(2):293–298. doi: 10.1021/es801505p. [DOI] [PubMed] [Google Scholar]
- 39.Parker JK, McIntyre D, Noble RT. Characterizing fecal contamination in stormwater runoff in coastal North Carolina, USA. Water Res. 2010;44(14):4186–4194. doi: 10.1016/j.watres.2010.05.018. [DOI] [PubMed] [Google Scholar]
- 40.Sauer EP, et al. Detection of the human specific Bacteroides genetic marker provides evidence of widespread sewage contamination of stormwater in the urban environment. Water Research. 2011;45(14):4081–4091. doi: 10.1016/j.watres.2011.04.049. [DOI] [PubMed] [Google Scholar]
- 41.Ahmed W, et al. Evaluation of multiple sewage-associated Bacteroides PCR markers for sewage pollution tracking. Water Res. 2009;43(19):4872–7. doi: 10.1016/j.watres.2009.08.042. [DOI] [PubMed] [Google Scholar]
- 42.Newton RJ, et al. Lachnospiraceae and Bacteroidales alternative fecal indicators reveal chronic human sewage contamination in an urban harbor. Appl Environ Microbiol. 2011;77(19):6972–81. doi: 10.1128/AEM.05480-11. [DOI] [PMC free article] [PubMed] [Google Scholar]
- 43.Ley RE, et al. Evolution of mammals and their gut microbes. Science. 2008;320(5883):1647–51. doi: 10.1126/science.1155725. [DOI] [PMC free article] [PubMed] [Google Scholar]
- 44.Muegge BD, et al. Diet drives convergence in gut microbiome functions across mammalian phylogeny and within humans. Science. 2011;332(6032):970–4. doi: 10.1126/science.1198719. [DOI] [PMC free article] [PubMed] [Google Scholar]
- 45.Turnbaugh PJ, et al. The effect of diet on the human gut microbiome: a metagenomic analysis in humanized gnotobiotic mice. Sci Transl Med. 2009;1(6):6ra14. doi: 10.1126/scitranslmed.3000322. [DOI] [PMC free article] [PubMed] [Google Scholar]
- 46.Walker AW, et al. Dominant and diet-responsive groups of bacteria within the human colonic microbiota. ISME J. 2011;5(2):220–30. doi: 10.1038/ismej.2010.118. [DOI] [PMC free article] [PubMed] [Google Scholar]
- 47.Wu GD, et al. Linking long-term dietary patterns with gut microbial enterotypes. Science. 2011;334(6052):105–8. doi: 10.1126/science.1208344. [DOI] [PMC free article] [PubMed] [Google Scholar]
- 48.David LA, et al. Diet rapidly and reproducibly alters the human gut microbiome. Nature. 2014;505(7484):559–63. doi: 10.1038/nature12820. [DOI] [PMC free article] [PubMed] [Google Scholar]
- 49.Yatsunenko T, et al. Human gut microbiome viewed across age and geography. Nature. 2012;486(7402):222–227. doi: 10.1038/nature11053. [DOI] [PMC free article] [PubMed] [Google Scholar]
- 50.Shanks OC, et al. Community structures of fecal bacteria in cattle from different animal feeding operations. Appl Environ Microbiol. 2011;77(9):2992–3001. doi: 10.1128/AEM.02988-10. [DOI] [PMC free article] [PubMed] [Google Scholar]
- 51.Benson AK, et al. Individuality in gut microbiota composition is a complex polygenic trait shaped by multiple environmental and host genetic factors. Proc Natl Acad Sci U S A. 2010;107(44):18933–8. doi: 10.1073/pnas.1007028107. [DOI] [PMC free article] [PubMed] [Google Scholar]
- 52.Moeller AH, Ochman H. Factors that drive variation among gut microbial communities. Gut Microbes. 2013;4(5):403–8. doi: 10.4161/gmic.26039. [DOI] [PMC free article] [PubMed] [Google Scholar]
- 53.Frese SA, et al. The evolution of host specialization in the vertebrate gut symbiont Lactobacillus reuteri. PLoS Genet. 2011;7(2):e1001314. doi: 10.1371/journal.pgen.1001314. [DOI] [PMC free article] [PubMed] [Google Scholar]
- 54.Turnbaugh PJ, et al. A core gut microbiome in obese and lean twins. Nature. 2009;457(7228):480–4. doi: 10.1038/nature07540. [DOI] [PMC free article] [PubMed] [Google Scholar]
- 55.Sekelja M, et al. Unveiling an abundant core microbiota in the human adult colon by a phylogroup-independent searching approach. Isme Journal. 2011;5(3):519–531. doi: 10.1038/ismej.2010.129. [DOI] [PMC free article] [PubMed] [Google Scholar]
- 56.Shade A, Handelsman J. Beyond the Venn diagram: the hunt for a core microbiome. Environ Microbiol. 2012;14(1):4–12. doi: 10.1111/j.1462-2920.2011.02585.x. [DOI] [PubMed] [Google Scholar]
- 57.Turnbaugh PJ, et al. Organismal, genetic, and transcriptional variation in the deeply sequenced gut microbiomes of identical twins. Proceedings of the National Academy of Sciences of the United States of America. 2010;107(16):7503–7508. doi: 10.1073/pnas.1002355107. [DOI] [PMC free article] [PubMed] [Google Scholar]
- 58.Cole JR, et al. The Ribosomal Database Project: improved alignments and new tools for rRNA analysis. Nucleic Acids Res. 2009;37(Database issue):D141–5. doi: 10.1093/nar/gkn879. [DOI] [PMC free article] [PubMed] [Google Scholar]
- 59.Huse SM, et al. Exploring microbial diversity and taxonomy using SSU rRNA hypervariable tag sequencing. PLoS Genet. 2008;4(11):e1000255. doi: 10.1371/journal.pgen.1000255. [DOI] [PMC free article] [PubMed] [Google Scholar]
- 60.Sun Y, et al. A large-scale benchmark study of existing algorithms for taxonomy-independent microbial community analysis. Brief Bioinform. 2012;13(1):107–21. doi: 10.1093/bib/bbr009. [DOI] [PMC free article] [PubMed] [Google Scholar]
- 61.Koeppel AF, Wu M. Surprisingly extensive mixed phylogenetic and ecological signals among bacterial Operational Taxonomic Units. Nucleic Acids Res. 2013;41 (10):5175–88. doi: 10.1093/nar/gkt241. [DOI] [PMC free article] [PubMed] [Google Scholar]
- 62.Ward DM. A natural species concept for prokaryotes. Curr Opin Microbiol. 1998;1 (3):271–7. doi: 10.1016/s1369-5274(98)80029-5. [DOI] [PubMed] [Google Scholar]
- 63.Thompson JR, et al. Genotypic diversity within a natural coastal bacterioplankton population. Science. 2005;307(5713):1311–3. doi: 10.1126/science.1106028. [DOI] [PubMed] [Google Scholar]
- 64.Vandewalle JL, et al. Acinetobacter, Aeromonas and Trichococcus populations dominate the microbial community within urban sewer infrastructure. Environ Microbiol. 2012;14(9):2538–52. doi: 10.1111/j.1462-2920.2012.02757.x. [DOI] [PMC free article] [PubMed] [Google Scholar]
- 65.Eren AM, et al. Oligotyping: Differentiating between closely related microbial taxa using 16S rRNA gene data. Methods Ecol Evol. 2013;4(12) doi: 10.1111/2041-210X.12114. [DOI] [PMC free article] [PubMed] [Google Scholar]
- 66.Shannon CE. A note on the concept of entropy. Bell System Tech J. 1948;27:379–423. [Google Scholar]
- 67.Eren AM, et al. Exploring the diversity of Gardnerella vaginalis in the genitourinary tract microbiota of monogamous couples through subtle nucleotide variation. PLoS One. 2011;6(10):e26732. doi: 10.1371/journal.pone.0026732. [DOI] [PMC free article] [PubMed] [Google Scholar]
- 68.Maignien L, et al. Ecological succession and stochastic variation in the assembly of Arabidopsis thaliana phyllosphere communities. MBio. 2014;5(1):e00682–13. doi: 10.1128/mBio.00682-13. [DOI] [PMC free article] [PubMed] [Google Scholar]
- 69.Reveillaud J, et al. Host-specificity among abundant and rare taxa in the sponge microbiome. ISME J. 2014;8(6):1198–209. doi: 10.1038/ismej.2013.227. [DOI] [PMC free article] [PubMed] [Google Scholar]
- 70.Eren AM, et al. A single genus in the gut microbiome reflects host preference and specificity. Isme Journal. 2014 doi: 10.1038/ismej.2014.97. [DOI] [PMC free article] [PubMed] [Google Scholar]
- 71.Cortes C, Vipnik V. Support-vector networks. Machine learning. 1995;20:273–297. [Google Scholar]
- 72.Larsen PE, Field D, Gilbert JA. Predicting bacterial community assemblages using an artificial neural network approach. Nat Methods. 2012;9(6):621–5. doi: 10.1038/nmeth.1975. [DOI] [PubMed] [Google Scholar]
- 73.Breiman L. Random Forests. Machine learning. 2001;45(1):5–32. [Google Scholar]
- 74.Smith A, Sterba-Boatwright B, Mott J. Novel application of a statistical technique, Random Forests, in a bacterial source tracking study. Water Res. 2010;44 (14):4067–76. doi: 10.1016/j.watres.2010.05.019. [DOI] [PubMed] [Google Scholar]
- 75.Statnikov A, et al. A comprehensive evaluation of multicategory classification methods for microbiomic data. Microbiome. 2013;1(1):11. doi: 10.1186/2049-2618-1-11. [DOI] [PMC free article] [PubMed] [Google Scholar]
- 76.Unno T, et al. Integrated online system for a pyrosequencing-based microbial source tracking method that targets Bacteroidetes 16S rDNA. Environ Sci Technol. 2012;46(1):93–8. doi: 10.1021/es201380c. [DOI] [PubMed] [Google Scholar]
- 77.Knights D, et al. Bayesian community-wide culture-independent microbial source tracking. Nat Methods. 2011;8(9):761–3. doi: 10.1038/nmeth.1650. [DOI] [PMC free article] [PubMed] [Google Scholar]
- 78.Friedman J, Alm EJ. Inferring correlation networks from genomic survey data. PLoS Comput Biol. 2012;8(9):e1002687. doi: 10.1371/journal.pcbi.1002687. [DOI] [PMC free article] [PubMed] [Google Scholar]
- 79.Parks DH, Beiko RG. Identifying biologically relevant differences between metagenomic communities. Bioinformatics. 2010;26(6):715–21. doi: 10.1093/bioinformatics/btq041. [DOI] [PubMed] [Google Scholar]
- 80.Segata N, et al. Metagenomic biomarker discovery and explanation. Genome Biol. 2011;12(6):R60. doi: 10.1186/gb-2011-12-6-r60. [DOI] [PMC free article] [PubMed] [Google Scholar]
- 81.Fiksdal L, et al. Survival and detection of Bacteroides spp., prospective indicator bacteria. Appl Environ Microbiol. 1985;49(1):148–50. doi: 10.1128/aem.49.1.148-150.1985. [DOI] [PMC free article] [PubMed] [Google Scholar]
- 82.Dick LK, et al. Host distributions of uncultivated fecal Bacteroidales bacteria reveal genetic markers for fecal source identification. Appl Environ Microbiol. 2005;71(6):3184–91. doi: 10.1128/AEM.71.6.3184-3191.2005. [DOI] [PMC free article] [PubMed] [Google Scholar]
- 83.Kildare BJ, et al. 16S rRNA-based assays for quantitative detection of universal, human-, cow-, and dog-specific fecal Bacteroidales: a Bayesian approach. Water Res. 2007;41(16):3701–15. doi: 10.1016/j.watres.2007.06.037. [DOI] [PubMed] [Google Scholar]
- 84.Haugland RA, et al. Evaluation of genetic markers from the 16S rRNA gene V2 region for use in quantitative detection of selected Bacteroidales species and human fecal waste by qPCR. Systematic and Applied Microbiology. 2010;33(6):348–357. doi: 10.1016/j.syapm.2010.06.001. [DOI] [PubMed] [Google Scholar]
- 85.Mieszkin S, et al. Phylogenetic analysis of Bacteroidales 16S rRNA gene sequences from human and animal effluents and assessment of ruminant faecal pollution by real-time PCR. J Appl Microbiol. 2010;108(3):974–84. doi: 10.1111/j.1365-2672.2009.04499.x. [DOI] [PubMed] [Google Scholar]
- 86.Bernhard AE, Field KG. A PCR assay to discriminate human and ruminant feces on the basis of host differences in Bacteroides-Prevotella genes encoding 16S rRNA. Appl Environ Microbiol. 2000;66(10):4571–4. doi: 10.1128/aem.66.10.4571-4574.2000. [DOI] [PMC free article] [PubMed] [Google Scholar]
- 87.Ahmed W, et al. Comparison of molecular markers to detect fresh sewage in environmental waters. Water Res. 2009;43(19):4908–17. doi: 10.1016/j.watres.2009.09.047. [DOI] [PubMed] [Google Scholar]
- 88.Shanks OC, et al. Performance of PCR-based assays targeting Bacteroidales genetic markers of human fecal pollution in sewage and fecal samples. Environ Sci Technol. 2010;44(16):6281–8. doi: 10.1021/es100311n. [DOI] [PubMed] [Google Scholar]
- 89.Ahmed W, Masters N, Toze S. Consistency in the host specificity and host sensitivity of the Bacteroides HF183 marker for sewage pollution tracking. Lett Appl Microbiol. 2012;55(4):283–9. doi: 10.1111/j.1472-765X.2012.03291.x. [DOI] [PubMed] [Google Scholar]
- 90.Layton BA, et al. Performance of human fecal anaerobe-associated PCR-based assays in a multi-laboratory method evaluation study. Water Research. 2013;47(18):6897–6908. doi: 10.1016/j.watres.2013.05.060. [DOI] [PubMed] [Google Scholar]
- 91.Seurinck S, et al. Detection and quantification of the human-specific HF183 Bacteroides 16S rRNA genetic marker with real-time PCR for assessment of human faecal pollution in freshwater. Environ Microbiol. 2005;7(2):249–59. doi: 10.1111/j.1462-2920.2004.00702.x. [DOI] [PubMed] [Google Scholar]
- 92.Green HC, et al. Improved HF183 quantitative real-time PCR assay for characterization of human fecal pollution in ambient surface water samples. Appl Environ Microbiol. 2014;80(10):3086–94. doi: 10.1128/AEM.04137-13. [DOI] [PMC free article] [PubMed] [Google Scholar]
- 93.Reischer GH, et al. Quantitative PCR method for sensitive detection of ruminant fecal pollution in freshwater and evaluation of this method in alpine karstic regions. Appl Environ Microbiol. 2006;72(8):5610–4. doi: 10.1128/AEM.00364-06. [DOI] [PMC free article] [PubMed] [Google Scholar]
- 94.Boehm AB, et al. Performance of forty-one microbial source tracking methods: a twenty-seven lab evaluation study. Water Res. 2013;47(18):6812–28. doi: 10.1016/j.watres.2012.12.046. [DOI] [PubMed] [Google Scholar]
- 95.Reischer GH, et al. Performance characteristics of qPCR assays targeting human-and ruminant-associated bacteroidetes for microbial source tracking across sixteen countries on six continents. Environ Sci Technol. 2013;47(15):8548–56. doi: 10.1021/es304367t. [DOI] [PMC free article] [PubMed] [Google Scholar]
- 96.Marti R, et al. Development and validation of a microbial source tracking marker for the detection of fecal pollution by muskrats. J Microbiol Methods. 2011;87(1):82–8. doi: 10.1016/j.mimet.2011.07.013. [DOI] [PubMed] [Google Scholar]
- 97.Marti R, et al. Assessment of a new Bacteroidales marker targeting North American beaver (Castor canadensis) fecal pollution by real-time PCR. J Microbiol Methods. 2013;95(2):201–6. doi: 10.1016/j.mimet.2013.08.016. [DOI] [PubMed] [Google Scholar]
- 98.Turnbaugh PJ, et al. The human microbiome project. Nature. 2007;449(7164):804–10. doi: 10.1038/nature06244. [DOI] [PMC free article] [PubMed] [Google Scholar]
- 99.Collins MD, et al. The phylogeny of the genus Clostridium - proposal of 5 new genera and 11 new species combinations. International Journal of Systematic Bacteriology. 1994;44(4):812–826. doi: 10.1099/00207713-44-4-812. [DOI] [PubMed] [Google Scholar]
- 100.McLellan SL, et al. Diversity and population structure of sewage-derived microorganisms in wastewater treatment plant influent. Environ Microbiol. 2010;12(2):378–92. doi: 10.1111/j.1462-2920.2009.02075.x. [DOI] [PMC free article] [PubMed] [Google Scholar]
- 101.Shanks OC, et al. Comparison of the microbial community structures of untreated wastewaters from different geographic locales. Appl Environ Microbiol. 2013;79(9):2906–13. doi: 10.1128/AEM.03448-12. [DOI] [PMC free article] [PubMed] [Google Scholar]
- 102.Lee JE, et al. Analysis of human and animal fecal microbiota for microbial source tracking. Isme Journal. 2011;5(2):362–365. doi: 10.1038/ismej.2010.120. [DOI] [PMC free article] [PubMed] [Google Scholar]
- 103.Cao Y, et al. Application of an integrated community analysis approach for microbial source tracking in a coastal creek. Environ Sci Technol. 2011;45(17):7195–201. doi: 10.1021/es201118r. [DOI] [PubMed] [Google Scholar]
- 104.Wu CH, et al. Characterization of coastal urban watershed bacterial communities leads to alternative community-based indicators. PLoS One. 2010;5(6):e11285. doi: 10.1371/journal.pone.0011285. [DOI] [PMC free article] [PubMed] [Google Scholar]
- 105.Unno T, et al. Use of barcoded pyrosequencing and shared OTUs to determine sources of fecal bacteria in watersheds. Environmental Science & Technology. 2010;44(20):7777–7782. doi: 10.1021/es101500z. [DOI] [PubMed] [Google Scholar]
- 106.Huttenhower C, et al. Structure, function and diversity of the healthy human microbiome. Nature. 2012;486(7402):207–214. doi: 10.1038/nature11234. [DOI] [PMC free article] [PubMed] [Google Scholar]
- 107.Gilbert JA, et al. The Earth Microbiome Project: Meeting report of the “1 EMP meeting on sample selection and acquisition” at Argonne National Laboratory October 6 2010. Stand Genomic Sci. 2010;3(3):249–53. doi: 10.4056/aigs.1443528. [DOI] [PMC free article] [PubMed] [Google Scholar]
- 108.Yilmaz P, et al. Minimum information about a marker gene sequence (MIMARKS) and minimum information about any (x) sequence (MIxS) specifications. Nat Biotechnol. 2011;29(5):415–20. doi: 10.1038/nbt.1823. [DOI] [PMC free article] [PubMed] [Google Scholar]
- 109.Woese CR. Bacterial evolution. Microbiol Rev. 1987;51(2):221–71. doi: 10.1128/mr.51.2.221-271.1987. [DOI] [PMC free article] [PubMed] [Google Scholar]
- 110.De Filippo C, et al. Impact of diet in shaping gut microbiota revealed by a comparative study in children from Europe and rural Africa. Proc Natl Acad Sci U S A. 2010;107(33):14691–6. doi: 10.1073/pnas.1005963107. [DOI] [PMC free article] [PubMed] [Google Scholar]
- 111.Koskey AM, et al. Blautia and Prevotella sequences distinguish human and animal fecal pollution in Brazil surface waters. Environ Micro Reports. 2014 doi: 10.1111/1758-2229.12189. [DOI] [PMC free article] [PubMed] [Google Scholar]
- 112.Lu J, et al. Phylogenetic diversity and molecular detection of bacteria in gull feces. Appl Environ Microbiol. 2008;74(13):3969–76. doi: 10.1128/AEM.00019-08. [DOI] [PMC free article] [PubMed] [Google Scholar]
- 113.Koskey AM, et al. Analysis of the gull fecal microbial community reveals the dominance of Catellicoccus marimammalium in relation to culturable Enterococci. Appl Environ Microbiol. 2014;80(2):757–65. doi: 10.1128/AEM.02414-13. [DOI] [PMC free article] [PubMed] [Google Scholar]