

Abstract
The mechanical microenvironment of solid tumors includes both fluid and solid stresses. These stresses play a crucial role in cancer progression and treatment and have been analyzed rigorously both mathematically and experimentally. The magnitude and spatial distribution of osmotic pressures in tumors, however, cannot be measured experimentally and to our knowledge there is no mathematical model to calculate osmotic pressures in the tumor interstitial space. In this study, we developed a triphasic biomechanical model of tumor growth taking into account not only the solid and fluid phase of a tumor, but also the transport of cations and anions, as well as the fixed charges at the surface of the glycosaminoglycan chains. Our model predicts that the osmotic pressure is negligible compared to the interstitial fluid pressure for values of glycosaminoglycans (GAGs) taken from the literature for sarcomas, melanomas and adenocarcinomas. Furthermore, our results suggest that an increase in the hydraulic conductivity of the tumor, increases considerably the intratumoral concentration of free ions and thus, the osmotic pressure but it does not reach the levels of the interstitial fluid pressure.
Keywords: tumor microenvironment, tumor mechanics, fixed charged density, Donnan osmotic pressure, glycosaminoglycans
Introduction
Generation and accumulation of physical forces during growth play a crucial role in tumor progression and response to treatment (Jain et al., 2014). Physical forces stem from both the fluid and the solid phase of a tumor (Stylianopoulos et al., 2013). The forces of the fluid phase correspond to the hydrostatic fluid pressure of the tumor interstitial space, the osmotic pressure owing to the transport of positive and negative ions and the existence of fixed charges in the tumor microenvironment, and also include the vascular pressure and the fluid shear stress on the luminal side of the tumor blood vessel wall (Koumoutsakos et al., 2013). The forces of the solid phase of tumors are divided into two types: the residual stresses developed due to mechanical interactions between solid constituents of the tumor microenvironment and particularly interactions between the collagen fibers, glycosaminoglycans (GAGs: hyaluronic acid, heparin sulfate, chondroitin sulfate and keratin sulfate) and cells (Stylianopoulos et al., 2012), and the stresses exerted on the entire tumor by the surrounding normal tissue, which resists to tumor expansion.
Solid stresses in the interior of tumors are compressive and when applied directly to cancer cells reduce their proliferation rate, induce apoptosis and increase their metastatic and invasive potential (Cheng et al., 2009; Helmlinger et al., 1997; Tse et al., 2012). These stresses are also applied to intratumoral blood vessels causing their compression (Padera et al., 2004; Stylianopoulos et al., 2013). Vessel compression, in turn, reduces perfusion and as a result hinders the delivery of blood-borne therapeutic agents. Cancer and stromal cells, collagen and hyaluronic acid contribute to the generation of solid stresses, while solid stress alleviation by selective depletion of any of these components decompresses tumor blood vessels and improves perfusion and drug delivery (Chauhan et al., 2013; Stylianopoulos et al., 2012).
Interstitial fluid pressure (IFP) in the interior of the tumor is uniformly elevated and can be as high as the vascular pressure (Boucher and Jain, 1992). This eliminates pressure gradients across the tumor vessel wall, and hinders the transvascular transport of macromolecules and nanomedicines (Jain and Stylianopoulos, 2010). Significant progress has been also made on the role of microvascular fluid flow and vessel wall shear stress in tumor progression, metastasis and response to treatment (Jain et al., 2014; Koumoutsakos et al., 2013). Little work has been performed, however, on the effect of the osmotic pressure in the tumor microenvironment. The high negative charge density of GAGs attracts cations and establishes a Donnan distribution of diffusible species that is responsible for the osmotic pressure. Many tumors are rich in hyaluronic acid as well as in other GAGs and recently researchers hypothesized that the osmotic pressure might contribute to the compression of intratumoral blood vessels in a way similar to solid stress (Provenzano et al., 2012; Provenzano and Hingorani, 2013). The magnitude and distribution of osmotic pressures in tumors, however, cannot be measured experimentally and to our knowledge there is no mathematical model to calculate osmotic pressures in the interstitial space of tumors.
In this study, we extended our biomechanical model of tumor growth (Stylianopoulos et al., 2013) to account for the transport of free ions and fixed charges in the tumor microenvironment. We correlated the concentration of fixed charges to the amount of GAGs in the tumor interior and calculated the levels of osmotic pressure for different concentrations of GAGs, using values from the literature. Our model suggests that for physiologically relevant GAG concentrations for tumors (i.e., on the order of 0.4 mg/g wet tissue), osmotic pressures are relatively low and should not contribute to the compression of intratumoral blood vessels. Furthermore, model predictions elucidate the dependence of the concentration of free ions and the levels of osmotic pressure on the hydraulic conductivity of the tumor interstitial space.
Methods
Multiplicative decomposition of the deformation gradient tensor
A detailed description of the methodology can be found in the Supplementary Material. Tumor growth is modeled using the multiplicative decomposition of the deformation gradient tensor, F (Ambrosi and Mollica, 2002; Rodriguez et al., 1994). The tensor, F, is decomposed to three independent motions: the growth of the tumor, Fg, the generation of residual stresses, Fr, and the elastic mechanical interactions, Fe (Fig. 1d in (Skalak et al., 1996)). Therefore, the final expression of F becomes,
| (1) |
Figure 1. Spatial distribution of the concentration of fixed, cf, and free, ck, ions, of the interstitial fluid pressure (IFP) and the osmotic pressure in the tumor and the surrounding normal tissue.

The GAG content of the tumor varied from zero to 0.4 mg/g wet wt at day 8. The GAG content of the normal tissue was set to 4.5 mg/g wet wt. Vertical lines on the plot depict the interface of tumor and normal tissue.
We considered Fr to be an isotropic tensor, i.e., FrI = λr, and the value of the residual stretch ratio λr was calculated by a bi-exponential expression as a function of the volume of the tumor based on previous research (Stylianopoulos et al., 2013).
Tumor growth was also taken to be isotropic, i.e., FgI = λg, where the growth stretch ratio, λg was calculated as a function of the oxygen concentration in the tissue according to (MacLaurin et al., 2012; Roose et al., 2003) (details in Supplementary Material). The elastic component of the deformation gradient tensor was calculated as Fe = F(FrFg)−1.
The tumor was taken to be isotropic and governed by the compressible neo-Hookean constitutive equation with strain energy density function given by
| (2) |
where μ is the shear modulus, κ is the bulk modulus, Je is the determinant of the elastic deformation gradient tensor Fe, , and I1 is the first invariant of the right Cauchy-Green deformation tensor, evaluated from Fe.
Implementation of Triphasic theory
The equations for solid and fluid phase conservation are:
| (3) |
| (4) |
where φs and φw are the volume fractions of the solid and fluid phase, respectively and vs and vw are the corresponding solid and fluid velocities. Ss is the creation/degradation of the solid phase and Q describes the fluid entering the tissue from the vasculature and exiting the tissue through the lymphatics.
The quantity Ss in Eq. (3) was calculated as (Roose et al., 2003):
| (5) |
where cox is the oxygen concentration, F is a parameter, which accounts for the inhibitory effect of solid stress on tumor growth and λc and kc are constant parameters derived from experimental data (Casciari et al., 1992a; Casciari et al., 1992b) (details in Supplementary Material).
The quantity Q in Eq. (4) was calculated from Starling’s approximation (Baxter and Jain, 1989):
| (6) |
where pv, Lp and (S/V) are the micro-vascular pressure, hydraulic conductivity and vascular density of the blood vessels, respectively, and pl, Lpl and (S/V)l are the corresponding quantities for the lymphatics.
The momentum balance equations for a triphasic medium are (Lu et al., 2010; Sun et al., 1999):
| (7) |
| (8) |
where σs is the solid stress tensor, p is the IFP, k is the hydraulic conductivity of the interstitial space, Fc is Faraday’s constant, Ψ is the electric potential, cf is the concentration of the fixed ions, ck is the sum of the free anions and cations within the tissue, and φ is the osmotic coefficient. A derivation of Eq. (8) is found in the Supplementary Material. Notice also that if we ignore the term in the square brackets on the right hand side of this equation, we end up having the usual biphasic, poroelastic formulation of soft biological tissues. The spatial derivatives in Eqs. 7 and 8 were calculated with respect to the reference configuration.
The Cauchy stress tensor of the solid phase, σs, in Eq. (7) was calculated by the strain energy density function as (Taber, 2008):
| (9) |
The ion transport equations for the cations, c+, and anions, c−, are (Mattern et al., 2008):
| (10.1) |
| (10.2) |
where D+ and D− are the diffusion coefficients of the cations and anions, respectively and Ψ is the electric potential. Subtraction and addition of Eqs. (10.1) and (10.2), replacing where and yields:
| (11.1) |
| (11.2) |
where Da = (D+ + D−)/2 and Dd = (D+ − D−)/2 , R is the gas constant and T is the temperature.
Finally, the electric potential Ψ was calculated by the solution of the Poisson-Boltzmann equation (e.g. (Jim and Grodzinsky, 2001)):
| (12) |
where ε is the dielectric permittivity and c0 is the ion concentration of the tissue.
Solving the above system of equations, we calculated the solid stress, the IFP and the concentration of fixed and free ions. The osmotic pressure was then calculated from the concentration of free ions as posm = φRTck. We used the finite element method and the commercial finite element software COMSOL to solve the system. The boundary conditions and the values of the model parameters employed for our analysis are described in the following sessions.
Boundary conditions
We assumed a spherical tumor within a host tissue of cubic shape (Supplementary Fig. 1). The tumor had an initial size of 1 mm and the length size of the surrounding tissue was taken to be two orders of magnitude larger to avoid any boundary effects (Stylianopoulos et al., 2013). Because of symmetry we solved for the one eighth of the domain. Symmetry boundary conditions for the displacements, u, the concentrations, the phase volume fractions and the electric potential were employed at the symmetry planes (Supplementary Fig. 1):
| (13) |
At the interface with the normal tissue the conditions for the continuity of the stresses, displacements and ion concentrations were automatically applied by COMSOL.
Model parameters
We modeled a murine tumor that grows subcutaneously within a period of 8 days. The hydraulic conductivity of the interstitial space, k, was set to 1×10⁻⁸ cm2/mmHg-s for both the tumor and the host tissue (i.e., mouse skin), if it is not otherwise stated (Baxter and Jain, 1989; Netti et al., 1995). The vascular and lymphatic pressures were set to pv = 30 mmHg, pl = 0.0 mmHg (Baxter and Jain, 1989). The hydraulic conductivity of the normal blood and lymphatic vessel wall were taken to be Lp = 3.6×10⁻⁸ cm/mmHg-s, and Lpl(S/V)l = 0.05 (mmHg-s)−1, respectively (Baxter and Jain, 1989; Netti et al., 1995). The hydraulic conductivity of the vessel wall for the tumor tissue is not constant. Since the production of cytokines, that increase vascular hydraulic conductivity and permeability (e.g., VEGF), increases with tumor growth and tumor growth depends on time, we have chosen the dependence of Lp on time. Therefore, in the model Lp is a linear function of time starting from the value of the normal tissue and at day 8, Lp becomes that of a tumor, Lp = 2.8×10⁻⁷ cm/mmHg-s (Stylianopoulos et al., 2013). The vascular density of the tumor and host tissue was (S/V) = 200 cm−1 and (S/V) = 70 cm−1, respectively (Baxter and Jain, 1989; Netti et al., 1995).
The concentration of fixed charges, cf, of the tumor and the host tissue were estimated from values of the GAG content taken from the literature (Netti et al., 2000; Wiig and Swartz, 2012) and using a relationship to relate GAG content to cf (Jackson et al., 2009; Lesperance et al., 1992):
| (14) |
were 2 are the moles of charge per mole of GAG, ρ is the tumor density set to 1.1 g wet/ml (Stylianopoulos et al., 2012), [GAG] is the concentration in mg/g wet and 502.5 is the molecular weight of GAG (g/mole). The amount of GAG in the tumor was assumed to increase linearly with time from zero to a given value within an 8 days period. A nonlinear relationship would change the results only qualitatively. The final amount of GAG was set to 0.4 mg/g wet wt, which corresponds to values taken from the literature (Netti et al., 2000; Wiig and Swartz, 2012), unless otherwise is stated. The initial concentration of the free ions, ck, at day 0 was taken to be twice as much as cf (Sun et al., 1999). The physiological values of model parameters are summarized in Table 1.
Table 1. Physiological values of model parameters.
| Parameter | Value | Reference |
|---|---|---|
| Fc, Faraday constant | 9.64×10⁴ [C·mol−1] | |
| R, Gas constant | 8.314 [J·(mol·K)−1] | |
| T, Temperature | 310 [K] | |
| ε, Dielectric Permittivity | 7.08×10⁻¹⁰ [c2·(J·m)−1] | (Sun et al., 1999) |
| D+, Diffusivity of cations | 0.5×10⁻⁹ [m2·s−1] | (Sun et al., 1999) |
| D−, Diffusivity of anions | 0.8×10⁻⁹ [m2·s−1] | (Sun et al., 1999) |
| φ, Osmotic coefficient | 0.8 | (Sun et al., 1999) |
| k, Hydraulic conductivity of normal and tumor tissue | 1.0×10⁻⁸ [cm2·(mmHg-s)−1] | (Netti et al., 2000) |
| pv, Vascular pressure | 30.0 [mmHg] | (Baxter and Jain, 1989) (Stylianopoulos et al., 2013) |
| pl, Lymphatic pressure | 0.0 [mmHg] | (Stylianopoulos et al., 2013) |
| Lp, Hydraulic conductivity of blood vessel wall of normal and tumor tissue | 3.6×10⁻⁸ [cm·mmHg-s] (normal) 2.8×10⁻⁷ [cm·mmHg-s] (tumor) |
(Baxter and Jain, 1989) |
| S/V, Vascular density of normal and tumor tissue | 70 [cm−1] (normal) 200 [cm−1] (tumor) |
(Baxter and Jain, 1989) |
| Lpl(S/V)l, Permeability of Lymphatics | 0.05 [(mmHg-s)−1] | (Baxter and Jain, 1989) |
| μ, Shear modulus of normal and tumor tissue | 10.0 [kPa] (normal) 20.0 [kPa] (tumor) |
(Stylianopoulos et al., 2013) |
| κ, Bulk modulus of normal and tumor tissue | 13.3 [kPa] (normal) 193.3 [kPa] (tumor) |
(Stylianopoulos et al., 2013) |
| λc, Growth rate parameter | 0.42 [day−1] | This work |
| kc, Growth rate parameter | 8.3×10⁻³ [mol·m−3] | (Casciari et al., 1992a; Casciari et al., 1992b) |
| λn, Oxygen uptake parameter | 2.2×10⁻³ [mol·(m3-day)−1] | (Casciari et al., 1992a; Casciari et al., 1992b) |
| kn, Oxygen uptake parameter | 4.64×10⁻³ [mol·m−3] | (Casciari et al., 1992a; Casciari et al., 1992b) |
| Dc, Oxygen Diffusion in the Tumor | 1.55×10⁻⁴ [m2·(day)−1] | (Mueller-Klieser and Sutherland, 1984) |
| Dc, Oxygen Diffusion in Normal Tissue | 1.86×10⁻⁴ [m2·(day)−1] | (Kim et al., 2011) |
| co, Ion Concentration | 0.15 [M] | Physiological value |
Results
Osmotic pressure is low for physiological values of GAG and increases with GAG content
We first performed simulations for GAG concentrations for sarcomas, melanomas, breast and colon cancers (Netti et al., 2000; Wiig and Swartz, 2012). The amount of GAG increased linearly from zero to 0.4 mg/g wet wt, in a period of 8 days. The GAG content of the host tissue was taken to be constant (4.5 mg/g wet wt). The results of our analysis are shown in Fig. 1. The concentration of fixed charges, cf, and the sum of free ions, ck, increase with time as the GAG content increases. The resulting osmotic pressure is negative and negligible compared with IFP. Subsequently, we increased the amount of GAG by an order of magnitude to 4.5 mg/g wet wt, keeping the GAG concentration in the host tissue at 4.5 mg/g wet wt (Supplementary Fig. 2). An increase in the GAG content of the tumor did not cause any increase in the concentration of fixed and free ions or in the magnitude of the osmotic pressure. After day 0, the charge concentration (fixed and free) inside the tumor becomes comparable to the concentration outside the tumor and it increases slowly with time the subsequent days, as the GAG content in the tumor increases.
An increase in the tumor hydraulic conductivity increases osmotic pressure significantly
From Figs. 1 and Supplementary Fig. 2, we conclude that owing to the communication between the tumor and the host tissue, the ion concentrations in the two tissues take similar values, despite the fact that the GAG content is different in the two domains. As shown in these figures, IFP is uniform inside the tumor and drops rapidly at the interface with the host tissue. This creates a fluid flux, which oozes ions to the surrounding tissue. A regulator of the fluid exchange between the tumor and the host tissue is the hydraulic conductivity of the interstitial space. Increasing the tumor hydraulic conductivity, reduces the fluid resistance within the tumor and decreases IFP. As a result, pressure gradients at the tumor margin are not steep, which would hinder escape of ions from the tumor. Indeed, Fig. 2 presents the results for three different values of the hydraulic conductivity of the tumor at day 4. The final GAG content of the tumor is set to 0.4 mg/g wet wt. An increase in the hydraulic conductivity, increases significantly the ion concentration and the negative osmotic pressure in the tumor. On the other hand, a reduction in the hydraulic conductivity eliminates any difference between the tumor and the host. Furthermore, in Supplementary Fig. 3, we plot the ion concentrations and osmotic pressure for three different values of the hydraulic conductivity of the normal tissue. As the conductivity of the normal tissue decreases, the ion concentration inside the tumor increases and the magnitude of the osmotic pressure increases as well. The dependence of the osmotic pressure on the conductivity of the host tissue is, however, less significant than the effect of the tumor conductivity.
Figure 2. Effect of tumor’s hydraulic conductivity, k [cm2/mmHg-s], on the concentration of fixed, cf, and free, ck, ions, of the interstitial fluid pressure (IFP) and the osmotic pressure.

The GAG content of the tumor varied from zero at day 0 to 0.4 mg/g wet wt at day 8. The GAG content of the normal tissue was set to 4.5 mg/g wet wt. Vertical lines on the plot depict the interface of tumor and normal tissue.
Dependence of tumor hydraulic conductivity on GAG content reduces levels of osmotic pressure during tumor progression
Thus far in our analysis, we did not consider the fact that changes in GAG content affect the hydraulic conductivity of the interstitial space. Empirical correlations exist that relate the hydraulic conductivity to the volume fraction of the collagen and GAG (Levick, 1987). We have used this methodology in previous research (Stylianopoulos and Jain, 2013) and we applied it here as well. Assuming a collagen volume fraction of 0.25 and taking the same GAG concentration as in Figs. 1 and 2, the change in the hydraulic conductivity during the growth of the tumor is shown in Fig. 3. The decrease in the hydraulic conductivity with time, will eventually cause a decrease in the fixed ion concentration in the tumor, despite the fact that the concentration of GAG increases linearly with time. Interestingly, the concentration of the free ions and as a result, the osmotic pressure are not decreased (Fig. 4). To better observe this effect, in Fig. 4 we present results up to day 10 of the simulations.
Figure 3. Decrease in tumor’s hydraulic conductivity as a function of time owing to an increase in GAG content.
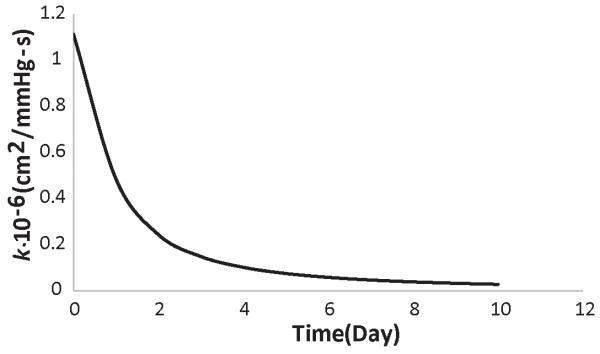
Figure 4. Spatial distribution of the concentration of fixed cf, and free, ck, ions, of the interstitial fluid pressure (IFP) and the osmotic pressure taking into account the variation of the hydraulic conductivity of the tumor during growth.

Vertical lines on the plot depict the interface of tumor and normal tissue.
Discussion
We developed a triphasic model of tumor mechanics to account for the transport of ions into the tumor microenvironment in order to calculate the magnitude of the osmotic pressures in tumors for different amounts of GAGs. Taking values of the GAG content from the literature, we reached two important conclusions. The first conclusion is that according to our calculations the magnitude of the osmotic pressure, even for tumors very rich in GAGs (Supplementary Fig. 2) is considerably lower than the magnitude of the IFP as well as the magnitude of solid stress, which as shown in Fig. 5 exceeds 10 kPa at the interior of the tumor. Therefore, it is the solid stress that compresses intratumoral blood vessels and the osmotic pressure should have no effects on vessel compression. The second conclusion is that the transport of ions inside the tumor and in the host tissue is determined in large part by the hydraulic conductivity. The higher the hydraulic conductivity of the tumor, the larger the concentration of free ions, which results in the elevation of the osmotic pressure. As far as the hydraulic conductivity of the host tissue is concerned, low values of the hydraulic conductivity inhibit fluid transport between the tumor and the host tissue and result in the isolation of the tumor. As a consequence, the transport of ions to the host tissue is hindered, ions cannot escape from the tumor and their intratumoral concentration increases.
Figure 5. Radial component of solid stress as a function of the position from tumor center.
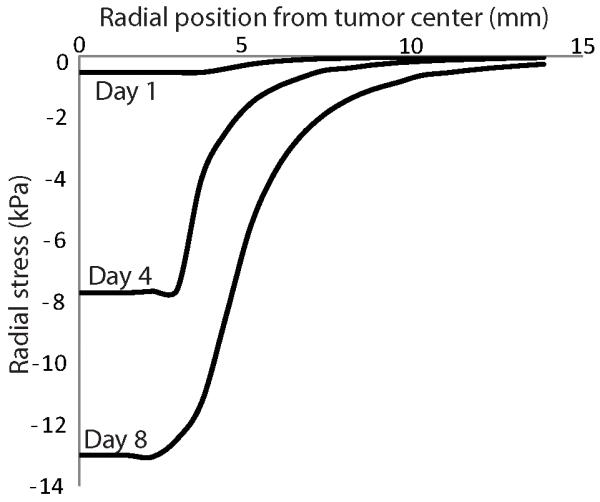
The GAG content of the tumor varied from zero at day 0 to 0.4 mg/g wet wt at day 8. The GAG content of the normal tissue was set to 4.5 mg/g wet wt. The hydraulic conductivity of the tumor and the host tissue was set to 10-8 cm2/mmHg-s. The radial stress is compressive at the tumor interior and becomes zero as we move to the host tissue.
In our analysis, we assumed the initial concentration of free ions, ck, at day 0 to be twice as much as the concentration of fixed ions, cf, based on previous research (Sun et al., 1999). The osmotic pressure is determined by the concentration of free ions and thus, this assumption affects the results. We repeated our analysis doubling the amount of free ions at the beginning of the simulation, such that ck at day 0 to be four times as much as cf. The final concentration of GAG was taken to be 0.4 mg/g wet wt and the baseline value of the hydraulic conductivity (i.e., 10−8 cm2/mmHg-s) was used for the tumor and the host tissue. The results are shown in Fig. 6; doubling the initial concentration of free ions in the beginning of the simulation, increases by approximately the same amount the values of ck and the osmotic pressure. The osmotic pressure is still lower than the solid stress, despite the fact that we assumed the amount of GAG to be an order of magnitude higher than published measurements (Fig. 6).
Figure 6. Concentration of free ions, ck, and osmotic pressure as a function of the radial position from the center of the tumor for two different initial concentrations of free ions, ck=2cf and ck=4cf.
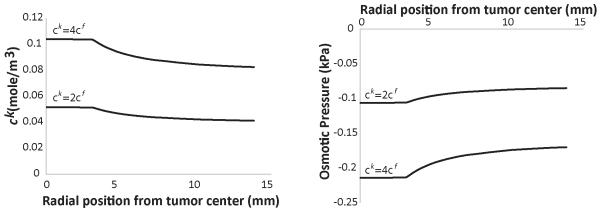
The results correspond to day 6 of the simulations. The GAG content of the tumor varied from zero at day 0 to 0.4 mg/g wet wt at day 8. The GAG content of the normal tissue was set to 4.5 mg/g wet wt.
Our mathematical approach is limited in that it cannot model the contribution of GAG (e.g., hyaluronic acid) to the generation of solid stress (Stylianopoulos et al., 2012). Indeed, our model considers the tumor microenvironment to be a continuum that behaves as an isotropic and compressible neo-Hookean material. District incorporation of the constituents of the solid phase of the tumor into a unified mathematical framework is a challenging task because it involves structural components and interactions that span multiple length scales. Our mathematical framework is general and can incorporate anisotropic growth as well as more sophisticated models for the growth of the tumor taking into account not only the concentration of oxygen but also the nutrients. The evolution of the osmotic pressures, however, is independent from the selection of the methodology for tumor growth. Finally, given the lack of experimental data for tumors, some of the values of the model parameters were derived from pertinent studies performed in articular cartilage (Table 1). When more information is available for solid tumors our model predictions can be updated.
Supplementary Material
Acknowledgments
The authors thank Dr. Athanasios Pirentis for useful comments on the manuscript. The research leading to these results has received funding from the European Research Council under the European Union’s Seventh Framework Programme (FP7/2007-2013)/ERC grant agreement n° 336839-ReEngineeringCancer.
Footnotes
Conflict of Interest Statement: The authors declare no competing interests.
REFERENCES
- Ambrosi D, Mollica F. On the mechanics of a growing tumor. 2002;40:1297–1316. [Google Scholar]
- Baxter LT, Jain RK. Transport of fluid and macromolecules in tumors. I. Role of interstitial pressure and convection. Microvasc Res. 1989;37:77–104. doi: 10.1016/0026-2862(89)90074-5. [DOI] [PubMed] [Google Scholar]
- Boucher Y, Jain RK. Microvascular pressure is the principal driving force for interstitial hypertension in solid tumors: implications for vascular collapse. Cancer Res. 1992;52:5110–4. [PubMed] [Google Scholar]
- Casciari JJ, Sotirchos SV, Sutherland RM. Mathematical modelling of microenvironment and growth in EMT6/Ro multicellular tumour spheroids. Cell Proliferation. 1992a;25:1–22. doi: 10.1111/j.1365-2184.1992.tb01433.x. [DOI] [PubMed] [Google Scholar]
- Casciari JJ, Sotirchos SV, Sutherland RM. Variations in tumor cell growth rates and metabolism with oxygen concentration, glucose concentration, and extracellular pH. Journal of Cellular Physiology. 1992b;151:386–394. doi: 10.1002/jcp.1041510220. [DOI] [PubMed] [Google Scholar]
- Chauhan VP, Martin JD, Liu H, Lacorre DA, Jain SR, Kozin SV, Stylianopoulos T, Mousa A, Han X, Adstamongkonkul P, Popovic Z, Bawendi MG, Boucher Y, Jain RK. Angiotensin inhibition enhances drug delivery and potentiates chemotherapy by decompressing tumor blood vessels. Nat Commun. 2013;4:2516. doi: 10.1038/ncomms3516. 10.1038/ncomms.3516. [DOI] [PMC free article] [PubMed] [Google Scholar]
- Cheng G, Tse J, Jain RK, Munn LL. Micro-environmental mechanical stress controls tumor spheroid size and morphology by suppressing proliferation and inducing apoptosis in cancer cells. PLoS One. 2009;4:e4632. doi: 10.1371/journal.pone.0004632. [DOI] [PMC free article] [PubMed] [Google Scholar]
- Helmlinger G, Netti PA, Lichtenbeld HC, Melder RJ, Jain RK. Solid stress inhibits the growth of multicellular tumor spheroids. Nat Biotechnol. 1997;15:778–83. doi: 10.1038/nbt0897-778. [DOI] [PubMed] [Google Scholar]
- Jackson AR, Yuan TY, Huang CY, Gu WY. A conductivity approach to measuring fixed charge density in intervertebral disc tissue. Annals of Biomedical Engineering. 2009;37:2566–2573. doi: 10.1007/s10439-009-9792-0. [DOI] [PMC free article] [PubMed] [Google Scholar]
- Jain RK, Martin JD, Stylianopoulos T. The role of mechanical forces in tumor progression and therapy. 2014;16:321–346. doi: 10.1146/annurev-bioeng-071813-105259. [DOI] [PMC free article] [PubMed] [Google Scholar]
- Jain RK, Stylianopoulos T. Delivering nanomedicine to solid tumors. Nat Rev Clin Oncol. 2010;7:653–64. doi: 10.1038/nrclinonc.2010.139. [DOI] [PMC free article] [PubMed] [Google Scholar]
- Jim M, Grodzinsky AJ. Effect of electrostatic interactions between glycosaminoglycans on the shear stiffness of cartilage: A molecular model and experiments. 2001;34:8330–8339. [Google Scholar]
- Kim Y, Stolarska MA, Othmer HG. The role of the microenvironment in tumor growth and invasion. Progress in Biophysics and Molecular Biology. 2011;106:353–379. doi: 10.1016/j.pbiomolbio.2011.06.006. [DOI] [PMC free article] [PubMed] [Google Scholar]
- Koumoutsakos P, Pivkin I, Milde F. The fluid mechanics of cancer and its therapy. 2013;45:325–355. [Google Scholar]
- Lesperance LM, Gray ML, Burstein D. Determination of fixed charge density in cartilage using nuclear magnetic resonance. Journal of Orthopaedic Research. 1992;10:1–13. doi: 10.1002/jor.1100100102. [DOI] [PubMed] [Google Scholar]
- Levick JR. Flow through interstitium and other fibrous matrices. Q J Exp Physiol. 1987;72:409–37. doi: 10.1113/expphysiol.1987.sp003085. [DOI] [PubMed] [Google Scholar]
- Lu XL, Wan LQ, Guo XE, Mow VC. A linearized formulation of triphasic mixture theory for articular cartilage, and its application to indentation analysis. Journal of Biomechanics. 2010;43:673–679. doi: 10.1016/j.jbiomech.2009.10.026. [DOI] [PubMed] [Google Scholar]
- MacLaurin J, Chapman J, Jones GW, Roose T. The buckling of capillaries in solid tumours. 2012;468:4123–4145. [Google Scholar]
- Mattern KJ, Nakornchai C, Deen WM. Darcy permeability of agarose-glycosaminoglycan gels analyzed using fiber-mixture and donnan models. Biophys J. 2008;95:648–56. doi: 10.1529/biophysj.107.127316. [DOI] [PMC free article] [PubMed] [Google Scholar]
- Mueller-Klieser WF, Sutherland RM. Oxygen consumption and oxygen diffusion properties of multicellular spheroids from two different cell lines. Advances in Experimental Medicine and Biology. 1984;180:311–321. doi: 10.1007/978-1-4684-4895-5_30. [DOI] [PubMed] [Google Scholar]
- Netti PA, Baxter LT, Boucher Y, Skalak R, Jain RK. Time-dependent behavior of interstitial fluid pressure in solid tumors: implications for drug delivery. Cancer Research. 1995;55:5451–5458. [PubMed] [Google Scholar]
- Netti PA, Berk DA, Swartz MA, Grodzinsky AJ, Jain RK. Role of extracellular matrix assembly in interstitial transport in solid tumors. Cancer Res. 2000;60:2497–503. [PubMed] [Google Scholar]
- Padera TP, Stoll BR, Tooredman JB, Capen D, di Tomaso E, Jain RK. Pathology: cancer cells compress intratumour vessels. Nature. 2004;427:695. doi: 10.1038/427695a. [DOI] [PubMed] [Google Scholar]
- Provenzano PP, Cuevas C, Chang AE, Goel VK, Von Hoff DD, Hingorani SR. Enzymatic targeting of the stroma ablates physical barriers to treatment of pancreatic ductal adenocarcinoma. Cancer Cell. 2012;21:418–429. doi: 10.1016/j.ccr.2012.01.007. [DOI] [PMC free article] [PubMed] [Google Scholar]
- Provenzano PP, Hingorani SR. Hyaluronan, fluid pressure, and stromal resistance in pancreas cancer. British Journal of Cancer. 2013;108:1–8. doi: 10.1038/bjc.2012.569. [DOI] [PMC free article] [PubMed] [Google Scholar]
- Rodriguez EK, Hoger A, McCulloch AD. Stress-dependent finite growth in soft elastic tissues. J Biomech. 1994;27:455–67. doi: 10.1016/0021-9290(94)90021-3. [DOI] [PubMed] [Google Scholar]
- Roose T, Netti PA, Munn LL, Boucher Y, Jain RK. Solid stress generated by spheroid growth estimated using a linear poroelasticity model. Microvasc Res. 2003;66:204–12. doi: 10.1016/s0026-2862(03)00057-8. [DOI] [PubMed] [Google Scholar]
- Skalak R, Zargaryan S, Jain RK, Netti PA, Hoger A. Compatibility and the genesis of residual stress by volumetric growth. J Math Biol. 1996;34:889–914. doi: 10.1007/BF01834825. [DOI] [PubMed] [Google Scholar]
- Stylianopoulos T, Jain RK. Combining two strategies to improve perfusion and drug delivery in solid tumors. Proc Natl Acad Sci U S A. 2013;110:18632–18637. doi: 10.1073/pnas.1318415110. [DOI] [PMC free article] [PubMed] [Google Scholar]
- Stylianopoulos T, Martin JD, Chauhan VP, Jain SR, Diop-Frimpong B, Bardeesy N, Smith BL, Ferrone CR, Hornicek FJ, Boucher Y, Munn LL, Jain RK. Causes, consequences, and remedies for growth-induced solid stress in murine and human tumors. Proceedings of the National Academy of Sciences of the United States of America. 2012;109:15101–15108. doi: 10.1073/pnas.1213353109. [DOI] [PMC free article] [PubMed] [Google Scholar]
- Stylianopoulos T, Martin JD, Snuderl M, Mpekris F, Jain SR, Jain RK. Coevolution of solid stress and interstitial fluid pressure in tumors during progression: Implications for vascular collapse. Cancer Research. 2013;73:3833–3841. doi: 10.1158/0008-5472.CAN-12-4521. [DOI] [PMC free article] [PubMed] [Google Scholar]
- Sun DN, Gu WY, Guo XE, Lai WM, Mow VC. A mixed finite element formation fo triphasic mechano-electrochemocal thepry for charged, hydrated biological soft tissues. 1999;45:1375–1402. [Google Scholar]
- Taber LA. Theoretical study of Beloussov’s hyper-restoration hypothesis for mechanical regulation of morphogenesis. Biomech Model Mechanobiol. 2008;7:427–41. doi: 10.1007/s10237-007-0106-x. [DOI] [PMC free article] [PubMed] [Google Scholar]
- Tse JM, Cheng G, Tyrrell JA, Wilcox-Adelman SA, Boucher Y, Jain RK, Munn LL. Mechanical compression drives cancer cells toward invasive phenotype. Proceedings of the National Academy of Sciences of the United States of America. 2012;109:911–916. doi: 10.1073/pnas.1118910109. [DOI] [PMC free article] [PubMed] [Google Scholar]
- Wiig H, Swartz MA. Interstitial fluid and lymph formation and transport: physiological regulation and roles in inflammation and cancer. Physiological Reviews. 2012;92:1005–1060. doi: 10.1152/physrev.00037.2011. [DOI] [PubMed] [Google Scholar]
Associated Data
This section collects any data citations, data availability statements, or supplementary materials included in this article.