

Abstract
In contrast to the intensely studied genetic and epigenetic changes that induce host cell transformation to initiate tumor development, those that promote the malignant progression of cancer remain poorly defined. As emerging evidence suggests that the hypoxic tumor microenvironment could re-model the chromatin-associated proteome (chromatome) to induce epigenetic changes and alter gene expression in cancer cells, we hypothesized that hypoxia-driven evolution of the chromatome promotes malignant changes and the development of therapy resistance in tumor cells. To test this hypothesis, we isolated chromatins from tumor cells treated with varying conditions of normoxia, hypoxia, and re-oxygenation and then partially digested them with DNase I and analyzed them for changes in euchromatin- and heterochromatin-associated proteins using an iTRAQ-based quantitative proteomic approach. We identified a total of 1446 proteins with a high level of confidence, including 819 proteins that were observed to change their chromatin association topology under hypoxic conditions. These hypoxia-sensitive proteins included key mediators of chromatin organization, transcriptional regulation, and DNA repair. Furthermore, our proteomic and functional experiments revealed a novel role for the chromatin organizer protein HP1BP3 in mediating chromatin condensation during hypoxia, leading to increased tumor cell viability, radio-resistance, chemo-resistance, and self-renewal. Taken together, our findings indicate that HP1BP3 is a key mediator of tumor progression and cancer cell acquisition of therapy-resistant traits, and thus might represent a novel therapeutic target in a range of human malignancies.
Microenvironmental hypoxia is a hallmark of rapidly growing solid tumors. In order to overcome the growth restrictions imposed by low-oxygen conditions, cancer cells can promote neovascularization and/or acquire characteristics that increase tumor cell survival, replicative capacity, and potential to undergo metastasis (1). Numerous studies have demonstrated that the hypoxic tumor microenvironment plays a key role in cancer progression toward a metastatic phenotype and can promote the acquisition of chemoresistant and radioresistant properties (2–4). Hypoxia-inducible factors have already been identified as key mediators of cancer cell development in low-oxygen environments (5), but it is likely that additional molecular mechanisms are also involved in driving the malignant progression of developing tumors.
Tumor progression is thought to be driven by selective pressure on the cancer cells exerted by the hypoxic microenvironment, leading to the clonal evolution of many different cancer cell phenotypes within an individual patient. This combination of increasing diversity and enhanced survival characteristics makes it progressively more difficult to kill all cancer cell types using a single therapeutic strategy. Identification and therapeutic disruption of the common mechanisms by which tumor cells progress toward malignancy might offer more effective approaches to cancer treatment. Indeed, the hypoxic tumor microenvironment appears to be a common driver of cancer evolution—all solid tumors are subjected to hypoxia stress at some point during development as they increase in size without an immediate increase in oxygen supply. Emerging evidence also suggests that hypoxia contributes to the development of cancer stem cells that exhibit enhanced capacity for self-renewal (6). Together, these data indicate a critical role for hypoxia-sensitive molecular pathways in promoting cancer progression that it may be possible to target with novel therapies in order to disrupt tumor growth (7).
Hypoxia-inducible factors mediate DNA methylation, histone modification, and host cell expression of regulatory RNAs and chromatin-modeling factors that modulate gene expression in response to low-oxygen conditions (5, 8). However, hypoxia can also induce histone modification and chromatin remodeling via hypoxia-inducible factor–independent pathways, indicating that additional mechanisms of epigenetic regulation can shape the cellular response to restricted oxygen supply (9, 10), and potentially increase cell survival and promote angiogenesis in hypoxic conditions (11–14). Hypoxia-induced changes in the composition of the chromatin-associated proteome (chromatome) are therefore likely to alter gene expression and promote clonal evolution in developing tumors. Although better knowledge of chromatome dynamics in low-oxygen conditions is likely to increase our understanding of the molecular events that drive tumor progression, few quantitative proteomic studies of chromatome modulation by hypoxia have been conducted to date.
In the current study, we used partial DNase I digestion together with iTRAQ-based1 quantitative proteomics to analyze the chromatome of A431 cancer cells that had been subjected to hypoxia and re-oxygenation stress. Profiling of both the solubilized fraction (euchromatin-associated proteins) and the undigested fraction (predominantly heterochromatin-associated proteins) uncovered novel effects of hypoxia on chromatin association topology in growing cancer cells. Furthermore, our proteomic and functional experiments indicated that the chromatin-organizing protein HP1BP3 is a key switch in hypoxia-induced malignant progression and might represent a novel therapeutic target in a wide range of human malignancies.
MATERIALS AND METHODS
Reagents
All reagents were purchased from Sigma-Aldrich unless otherwise indicated. Antibodies against α-tubulin (sc-5286), GAPDH (sc-32233), Ku-70 (sc-17789), and Ku-80 (sc-5280) were from Santa Cruz Biotechnology Inc., Santa Cruz, CA; anti-histone H2A (ab13923), histone H4 (ab10158), and HP1BP3 (ab98894) were from Abcam (Cambridge, UK); and anti-actin (MAB1501) was from Millipore, MA.
Cell Culture and Hypoxia Model
A431 squamous carcinoma cells were purchased from ATCC and maintained in DMEM supplemented with 10% FBS, 10,000 U/ml penicillin, and 10,000 μg/ml streptomycin. For each experiment, 2 × 10⁶ cells were seeded onto 10-cm Petri dishes and grown to 30% to 40% confluence at 37 °C in 5% CO2, after which the culture medium was aspirated and replaced with serum-free DMEM. The cells were then placed into a hypoxia chamber and flushed with hypoxic gas (95% N2, 5% CO2, <0.1% O2) at a constant flow rate of 15 l/min for a total of 10 min before the chamber was sealed and incubated at 37 °C for either 48 h or 72 h. Alternatively, the cells were cultured under normoxic (Nx) control conditions (21% O2, 5% CO2) at 37 °C for 72 h.
In re-oxygenation (Rx) experiments, the cells were first incubated in hypoxic conditions for 48 h before the culture medium was refreshed and the cells were incubated for 24 h under normoxia. The experiment was performed in triplicate.
Chromatin Isolation and Digestion
Chromatin isolation was performed according to the method published by Dutta et al., with minor modifications (15). Briefly, 7 × 10⁷ cells were suspended in nuclei extraction buffer A (10 mm HEPES, pH 7.5, 10 mm KCl, 1 mm MgCl2, 0.34 m sucrose, 0.1% triton X-100, 1 mm DTT, and protease inhibitor mixture from Roche Diagnostics, Mannheim, Germany) and kept on ice for 30 min prior to homogenization. The homogenate was centrifuged at 2000 × g for 3 min at 4 °C, and the supernatant was discarded. The pellet fraction was re-suspended in nuclei extraction buffer B (10 mm HEPES, pH 7.5, 10 mm KCl, 1.5 mm MgCl2, 0.34 m sucrose, 0.1% Nonidet P-40, 1 mm DTT, protease inhibitor mixture) and homogenized a second time. The homogenate was loaded onto a 2.1 m sucrose gradient (10 mm HEPES, pH 7.5, 10 mm KCl, 1.5 mm MgCl2, 2.1 m sucrose, 1 mm DTT, protease inhibitor mixture) and ultracentrifuged at 150,000 × g for 3 h at 4 °C using an SW41 rotor with the Optima™ l-100XP Ultra apparatus (Beckman Coulter, CA). After ultracentrifugation, the supernatant was removed and the chromatin pellet was collected from the bottom of the tube. The chromatin pellet was washed with wash buffer (10 mm HEPES, pH 7.5, 1 mm DTT, protease inhibitor mixture) and collected via centrifugation at 20,000 × g for 45 min at 4 °C. The purified chromatin pellet was then suspended in 50 μl of DNase I digestion buffer (10 mm HEPES, pH 7.5, 2.5 mm CaCl2, 2.5 mm MgCl2) and digested with 20 U of DNase I at 37 °C for 60 min. Digestion was terminated by the addition of 1 mm EDTA, and the supernatant (fraction S) was collected via centrifugation at 20,000 × g at 4 °C for 30 min. The remaining undigested pellet (fraction P) was dissolved in 2% SDS solution. The protein contents of the supernatant and pellet fractions were subsequently quantified using 2-D Quant Kits (Amersham Biosciences, Pittsburg, PA). Digestion experiments were performed for three biological replicates, and the digests obtained from three replicates were pooled together prior to in-gel digestion.
In-gel Digestion and iTRAQ Labeling
For each sample, 150 μg of protein was loaded onto a 12.5% SDS-PAGE gel and subjected to electrophoresis for 15 min at 80 V. Sample lanes were cut into small pieces and washed with 25 mm triethylammonium bicarbonate (TEAB) in 75% ACN before being dehydrated with 100% ACN and then vacuum dried. Reduction was performed using 5 mm Tris 2-carboxyethyl phosphine hydrochloride in 25 mm TEAB buffer at 60 °C for 30 min. Reduced samples were then alkylated with 10 mm methyl methanethiosulfonate in 25 mm TEAB buffer at room temperature for 45 min. The gel pieces were then alternately washed in 25 mm TEAB buffer and 25 mm TEAB/75% ACN to remove excess Tris 2-carboxyethyl phosphine hydrochloride and methyl methanethiosulfonate. The gel pieces were again dehydrated and dried. In-gel digestion was carried out overnight at 37 °C in 25 mm TEAB buffer containing 10 ng/ml sequencing-grade modified trypsin (Promega Corporation, Madison, WI). Tryptic peptides derived from the supernatant fractions (Nx-S, Hx48-S, Hx72-S, and Rx-S) and pellet fractions (Nx-P, Hx48-P, Hx72-P, and Rx-P) were labeled with isobars 113, 114, 115, 116, 117, 118, 119, and 121 (supplemental Table S1). The iTRAQ-labeled peptides were pooled together, desalted using Sep-Pak Vac C18 cartridges (Waters, Milford, MA), and dried by vacuum centrifugation.
Electrostatic Repulsion–Hydrophilic Interaction Chromatography Fractionation and LC-MS/MS Analysis
iTRAQ-labeled peptides were dissolved in 100 μl of sample loading buffer (10 mm ammonium acetate in 85% ACN and 1% formic acid) before being fractionated using electrostatic repulsion–hydrophilic interaction chromatography. PolyWAX LP™ 20 columns (4.6 × 200 mm, 5-μm particle size, 300-Å pore size) (PolyLC, Columbia, MD) were used on a 21 Prominence™ HPLC unit (Shimadzu, Kyoto, Japan) for fractionation, during which the flow rate was maintained at 1 ml/min. The gradient used for separation comprised 100% buffer A (10 mm ammonium acetate in 85% ACN and 0.1% acetic acid) for 5 min, 0% to 28% buffer B (30% ACN and 0.1% formic acid) for 40 min, 28% to 100% buffer B for 5 min, and 100% buffer B for 10 min. The 52 collected fractions were combined into 28 fractions according to their chromatograms and then concentrated to dryness using vacuum centrifugation. The electrostatic repulsion–hydrophilic interaction chromatography-fractionated labeled peptides were reconstituted in 0.1% formic acid for LC-MS/MS analysis using a Q-STAR Elite mass spectrometer coupled with an online nano-flow Eksigent HPLC system (Applied Biosystems, MDS-Sciex, Foster City, CA). Nano-bored C18 columns with a picofrit nanospray tip (75 μm inner diameter × 15 cm, 5-μm particles) (New Objectives, Woburn, MA) were used for peptide separation. The entire analysis was carried out at constant flow rate of 300 nl/min. The LC-MS/MS analysis was performed in triplicate by injecting the samples three times. All MS data were acquired in positive ion mode with a mass range of 300–2000 m/z. Peptides with charges of +2 to +4 were selected for MS/MS, and the three most abundant peptide ions above a five-count threshold were dynamically excluded for 30 s with a 30 mDa mass tolerance. Smart information-dependent acquisition was activated with automatic collision energy and MS/MS accumulation. The fragment intensity multiplier was set at 20, and the maximum accumulation time was set at 2 s.
Mass Spectrometric Data Analysis and Bioinformatics
Acquisition of all mass spectrometric data was performed using Analyst QS 2.0 software (Applied Biosystems/MDS-Sciex). Protein Pilot 3 Software (Applied Biosystems) was used for the identification and quantification of proteins. The Paragon and ProGroup algorithms were used for peptide identification and isoform-specific quantification during the ProteinPilot search. The defined parameters used for the search were as follows: (i) sample type, iTRAQ 8-plex (peptide labeled); (ii) cysteine alkylation, methyl methanethiosulfonate; (iii) digestion, trypsin; (iv) instrument, QSTAR Elite ESI; (v) special factors, none; (vi) species, none; (vii) specify processing, quantities; (viii) I.D. focus, biological modifications, amino acid substitutions; (ix) database, the UniProt Knowledgebase (UniProtKB) human protein database (downloaded March 12, 2010: 95,624 sequences and 36,307,192 residues); and (x) search effort, thorough. Other search parameters including precursor and fragment mass tolerance were set at 0.2 Da, and the maximum number of miscleavages was set at 2. The UniProtKB database and its reversed sequence were combined and used for the searches, and the reversed sequence was used for estimation of the false discovery rate. The peptide for quantification was automatically selected by the ProGroup algorithm with the following criteria: (a) the peptide was suitable for quantitation (iTRAQ reporter area > 0); (b) the peptide was identified with good confidence; and (c) the peptide was not shared with another protein that had been identified with greater confidence. The resulting dataset was automatically bias-corrected to eliminate variation due to potential unequal mixing while combining iTRAQ-labeled samples. The UniProtKB database was used for the classification and functional annotation of the proteins. Cluster analysis of the identified proteins was conducted according to their abundance in the chromatin digests using the online bioinformatics tool Gene Pattern before hierarchical clustering and Pearson correlation were applied.
Post-proteomic Validation by Dynamic Selected Reaction Monitoring Quantification
Chromatins were extracted from the four different hypoxic A431 cells and digested with DNase I as described in the previous section. Digests from three biological replicates were pooled together and used for shortlisted protein quantitation via selected reaction monitoring (SRM). 50 μg of protein from each condition was taken for in-gel digestion. A TSQ Vantage triple-stage quadrupole mass spectrometer coupled with an EASY-nLC™ 1000 nanoflow UHPLC system (Thermo Scientific) was used for the SRM-based quantification of tryptic peptides. Peptides and their respective transitions of the targeted proteins were selected according to their intensities from our existing human chromatome datasets by using an in-house algorithm. Tryptic peptides were separated in an Acclaim® PepMap RSLC C18 column (75 μm × 15 cm; nanoViper C18, 2 μm, 100 Å) fitted with a Acclaim® PepMap100 tap column (75 μm × 2 cm; nanoViper C18, 3 μm, 100 Å) (Thermo Scientific) by a 60-min gradient of mobile phase A (0.1% formic acid in water) and mobile phase B (0.1% formic acid in ACN) (45 min of 3% to 30% B, followed by 9 min of 30% to 50% B and 1 min of 50% to 60%, after which the gradient was maintained at 60% B for 2 min and finally reequilibrated at 3% B for 8 min). Machine parameters were set at optimum, including an electrospray voltage of 1500 V, a capillary temperature of 250 °C, a collision gas pressure of 1 mTorr, a mass window of 0.7 full width at half-maximum, and a scan time of 50 ms for the SRM experiment. The retention time of the selected peptide was picked for the 60-min full-scan data. Dynamic SRM with a 5-min time window was used for quantification and performed in triplicate. Data processing and quantitative analysis were performed using Thermo Pinpoint 1.2.0 software (Thermo Scientific, West Palm, FL).
Western Blot Analysis
Equal amounts of protein from each sample were resolved in 10% acrylamide gels and transferred onto nitrocellulose membranes. Immunoblotting was performed using anti-protein antibodies together with the ECL system for detection (Invitrogen).
Flow Cytometry
Cells were washed with ice-cold PBS and fixed in ethanol at −20 °C for 24 h. The fixed cells were then stained with 0.5 mg/ml propidium iodide for 15 min at 37 °C. DNA content was measured using a FACSCalibur™ flow cytometer, and data were analyzed using CELLQUEST software (BD Biosciences, Franklin Lakes, NJ).
HP1BP3 Knockdown
HP1BP3 knockdown in A431 and U2OS cells was achieved using shRNA-1 (#RHS4430–101127970) (RNA intro GIPZ Lentiviral shRNAmir Starter Kit, Thermo Scientific Open Biosystems). The pGIPZ clones were grown at 37 °C in low-salt 2× LB broth containing 100 μg/ml ampicillin before plasmid extraction was carried out using kits from Axygen, Union City, CA. A431 cells were transfected with GIPZ Lentiviral shRNAmir (either HP1BP3-specific or non-silencing control) using TurboFect Transfection Reagent (Thermo Scientific). Transfected cells were incubated in DMEM containing 10% FBS at 37 °C, 5% CO2 for 48 h. Transgene expression was determined by the detection of GFP expression. After 48 h, the transfected A431 cells were trypsinized and grown in DMEM containing 2 μg/ml puromycin and 10% FBS for a period of 15 days to select for stable transfectants. After 15 days, each colony was cultured separately, and the efficiency of HP1BP3 knockdown was determined via Western blotting with an anti-HP1BP3 antibody. The colony that exhibited the most efficient HP1BP3 inhibition was used for subsequent experiments. Another two shRNAs (shRNA-2 (#RHS4430–101127098) and shRNA-3 (#RHS4430–101129419)) were used for HP1BP3 knockdown in A431 cells to confirm the HP1BP3 depletion effects, and the resulting phenotypes were named HP1BP3Δ(2) and HP1BP3Δ(3).
Chromatin Compaction Assay
Chromatin samples were extracted from A431 cells, suspended in micrococcal nuclease (MNase) digestion buffer (50 mm Tris-Cl, pH 7.9, 5 mm CaCl2), and then digested with 0 to 10 U MNase at 37 °C for 10 min. Digestion was terminated by an equal volume of 2× TNESK solution (20 mm Tris-Cl, pH 7.4, 200 mm NaCl, 2 mm EDTA, 1% SDS, 0.2 mg/ml protein kinase K) before incubation overnight at 37 °C. DNA fragments were extracted using phenol-chloroform, and DNA content was measured with a NanoDrop 2000 UV-Vis Spectrophotometer (Thermo Fisher Scientific). Equal amounts of DNA from each sample were then loaded and resolved on 1% agarose gels.
MTT Assay
Cells were grown in normoxia or hypoxia for 48 h or 24 h and hypoxia was followed by 24-h re-oxygenation before the cultures were supplemented with 0.5 mg/ml MTT reagent and incubated at 37 °C for 2 h. The culture medium was then aspirated, the formazan crystals were dissolved in dimethyl sulfoxide, and the optical density of the formazan was measured at 570 nm using a microplate reader with a reference wavelength of 630 nm (Tecan Magellan™, Männedorf, Switzerland).
Clonogenic Assay
A total of 500 cells per well were seeded into six-well plates in DMEM containing 10% FBS and incubated at 37 °C in 5% CO2 for 12 days. The culture medium was then aspirated, and the cells were washed, fixed with 95% ethanol, and stained with 5% crystal violet. Excess crystal violet was removed with extensive washing, and the plate was air-dried overnight at room temperature. The number of colonies formed per well was counted, and crystal violet was extracted using 0.5% Triton X-100 for colorimetric quantification.
Cell Adhesion Assay
Cells were grown in normoxia or hypoxia for 48 h or in 24 h hypoxia followed by 24 h re-oxygenation, and 24-well plates were coated with 2 μg/ml collagen, fibronectin, or laminin overnight at 4 °C before the addition of 2 × 10⁵ cells per well and incubation in DMEM at 37 °C for 1 h. The medium was then removed, and the non-adherent cells were released by washing with PBS. The adherent cells were fixed with 95% ethanol and stained with 0.5% crystal violet solution, and the excess dye was removed by washing before the plates were air-dried overnight at room temperature. Crystal violet was extracted in 0.8 ml of 0.5% Triton X-100 and colorimetrically quantified at 595 nm using a microplate reader (Tecan MagellanTM).
Scratch-wound Assay
Cells were grown to ∼100% confluence in six-well plates, and a scratch was made in the middle of the well using a sterile 10-μl pipette tip. Then the cells were washed, and fresh serum-free medium was added prior to incubation at 37 °C in hypoxia/normoxia for 48 h. Images of the scratch area were captured both pre-incubation and after culture in hypoxia/normoxia for 48 h. In some experiments, additional images of the scratch area were captured at 6 h and 24 h during re-oxygenation. Images were taken using a Nikon Eclipse TE2000-U microscope.
Trans-well Assay
Cells were grown in normoxia or hypoxia for 48 h or in 24 h hypoxia followed by 24 h re-oxygenation, and a total of 4 × 10⁴ cells per well in 100 μl of serum-free DMEM were seeded into in the upper chambers of a 24-well trans-well plate (8-μm pore with polycarbonate filter insert; Costar®, Corning, NY), with the lower chambers filled with 600 μl of DMEM containing 2.5% FBS. The plate was incubated at 37 °C in 5% CO2 for 48 h before non-migrated cells (upper surface of the membrane) were removed by wiping with a cotton swab. Migrated cells (lower surface of the membrane) were fixed and stained with 0.5% crystal violet. Excess dye was removed by washing, and the membrane was imaged using a Nikon Eclipse TE2000-U microscope. Crystal violet was extracted in 0.5% Triton-X100 solution and used for colorimetric quantification.
Radiation-resistance and Chemo-resistance Assays
A total of 2 × 10⁵ cells per well were seeded into a six-well plate and incubated at 37 °C for 24 h. The culture medium was then replaced with fresh serum-free medium, and the cells were treated with 10 Gy radiation using a BIOBEAM 2000 gamma irradiation device (Gamma-Service Medical GmbH, Leipzing, Germany). After 24 h, the viability of the radiation-treated cells was determined via MTT assay. For chemo-resistance assays, cells were seeded at a density of 1 × 10⁴ cells per well into a 96-well plate and incubated overnight at 37 °C before being treated with 0 to 1600 ng/ml doxorubicin for 24 h, after which cell viability was determined via MTT assay.
Sphere Formation/Self-renewal Assay
Cells were grown in normoxia or hypoxia for 48 h (or 24 h hypoxia followed by 24 h re-oxygenation) and then cultured in suspension in DMEM/F12 (1:1) medium supplemented with B27, 20 ng/ml epidermal growth factor, 10 ng/ml fibroblast growth factor, and pen-strep. Cells were seeded into ultra-low-attachment flat-bottom 24-well plates (Costar®, Corning) at a density of a specified number of cells per well and then incubated at 37 °C, 5% CO2 for 10 days. After incubation, the number of tumor spheres formed was counted, and images were captured using a Nikon Eclipse TE2000-U microscope.
Xenograft Tumor Model
Male NCr nude mice (CrTac: NCr-Foxn1nu, homozygous; InVivos Pte Ltd, Singapore) aged 4 to 5 weeks and weighing 16 to 22 g each were used for all in vivo experiments. Mice were cage-acclimated for 3 days in a temperature-controlled environment (24 °C ± 3 °C) on an alternating 12 h light/dark cycle with food and water supplied ad libitum. All animal protocols were approved by the Nanyang Technological University Institutional Animal Care and Use Committee. HP1BP3-depleted A431 cells (or mock-depleted control cells) were cultured for 48 h, trypsinized, and suspended in sterile PBS for subcutaneous injection of 1 × 10⁶ viable cells into the right flank of each animal (n = 6 mice per group). The tumors were grown for 4 weeks before all mice were euthanized using isoflurane and the tumors were surgically excised for further analysis.
RESULTS AND DISCUSSION
In Vitro Tumor Model
Tumor progression is driven by selective pressure on cancer cells applied by the hypoxic conditions in the tumor microenvironment, leading to the clonal evolution of many different types of cancer cells in individual patients. Recent research has uncovered many of the oncogenes and tumor suppressor genes that influence tumor development, but variation among cancer cell types means that it is an extremely challenging task to compile an exhaustive list of all the aberrant molecular events that can promote tumor formation and dissemination. However, hypoxia appears to be a common driver of cancer cell evolution, as gas diffusion cannot supply solid tumors with sufficient oxygen as they progressively increase in size (Fig. 1). We therefore hypothesized that hypoxia-sensitive pathways that drive tumor progression to malignant cancer represent promising drug targets for effective cancer treatments.
Fig. 1.
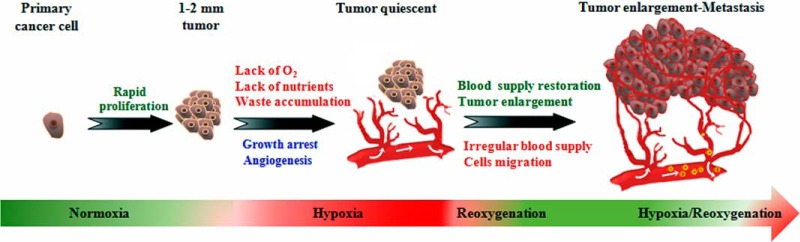
Tumor development and evolution under hypoxic conditions. Cancer starts as a single cell that acquires genetic mutations that promote rapid, uncontrolled growth. When the tumor reaches 1 to 2 mm in diameter, oxygen and nutrient supply by diffusion from nearby blood vessels is insufficient to maintain cancer cell growth. In order to sustain growth and survival under these low-oxygen conditions, the cancer cells modify their genome and epigenome via clonal evolution to generate a diversity of cancer cells with distinct properties. At this late stage, cancer cells may spread to other parts of the body and become resistant to both radio- and chemotherapy.
The effects of hypoxia on tumor biology include promotion of cancer cell proliferation, increased migration/invasive behavior, acquisition of stem cell characteristics, and selection of traits that favor survival during hypoxia/re-oxygenation stress (16, 17). Given this central role of hypoxia in both tumor progression and the development of therapy-resistant properties in cancer cells, we sought to exploit our in vitro model of cancer development to conduct a quantitative proteomic analysis of tumor biology under conditions of variable hypoxia stress. To do this, we first cultured cancer cells under normal oxygen conditions (tumor size < 2 mm) or subjected these cells to hypoxia/re-oxygenation of variable duration (tumor size > 2 mm) in order to simulate the tumor microenvironment during clonal evolution (18, 19). Using this model, we had already uncovered novel effects of hypoxia on cancer progression in our previous studies of the cancer cell secretome (18) and cellular proteome (19). In the current report, we extended our investigations to assess the influence of low-oxygen conditions on chromatome dynamics in the developing tumor.
Mass Spectrometric Identification and Quantification of the Chromatin-associated Proteome
In order to study changes in the composition of the chromatin-associated proteome induced by hypoxia and re-oxygenation stress, we cultured A431 cancer cells under Nx, Hx, or Rx conditions. Chromatin was extracted from the cancer cells and then partially digested with DNase I to extract the euchromatin binding proteins (leaving behind the heterochromatin fraction and matrix-associated proteins in the pellet). Successful fractionation was confirmed by Western blot analysis that indicated high concentrations of GAPDH only in the cytosolic fraction, with high levels of chromatin protein histone H4 detected only in the chromatin fraction (supplemental Fig. S1A). Chromatin digests from three biological replicates were pooled, and chromatin-associated proteins were then subjected to tryptic digestion. The resultant peptides were labeled with iTRAQ reagent. The labeled peptides were subsequently separated by electrostatic repulsion–hydrophilic interaction chromatography fractionation and then analyzed using an HPLC-coupled QqTOF instrument for identification. ProteinPilot v.3 software was used to compare the mass spectrometric spectra of the peptides against the UniProtKB human protein database. Using this approach, we acquired 1.79 × 10⁵ MS/MS spectra from a total of 84 LC-MS/MS runs (n = 3 technical replicates). The distribution of physiochemical properties of the identified proteins indicated a diverse range of molecules within the fractionated samples. Using ProteinPilot searches, we identified a total of 1828 proteins at a level of >99% confidence, with an unused score > 2 and false discovery rate < 1%. Identified proteins that included at least two unique peptides (95% confidence) were then shortlisted for further analysis (1446 proteins total) and classified according to their subcellular localization as reported in the UniProt and neXtProt databases. These analyses revealed that the majority of the identified proteins were located in the nucleus (47%) or had no specified subcellular localization (21%) (supplemental Fig. S1C). We then further classified the proteins according to their annotated biological functions and observed that the majority were mediators of nuclear processes including regulation of transcription (14%), chromatin organization (8%), DNA repair and replication (4%), mRNA processing (8%), rRNA processing (3%), nuclear transport (3%), cell cycling (2%), ribosome biogenesis (1%), and other miscellaneous chromatin-dependent events (4%) (supplemental Fig. S1D).
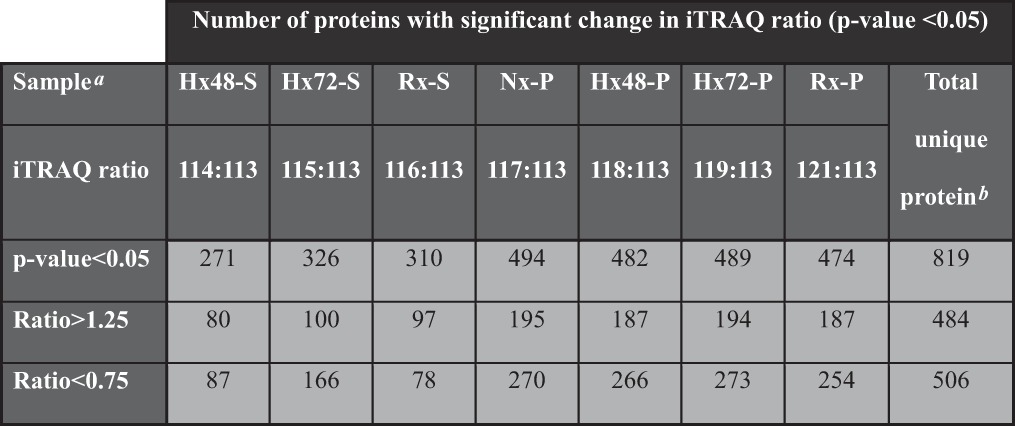
In this iTRAQ-based proteomic analysis, we used the supernatant fraction of cells cultured under normoxia for 48 h as the denominator for relative quantification of the different samples (with iTRAQ ratio cutoff values of 1.25 and 0.75 for fold change in protein abundance). Using this approach, we detected 484 proteins that were up-regulated and 506 proteins that were down-regulated in the different fractions of the chromatin digests. We shortlisted 819 of these modulated proteins for further analysis based on the detection of a significant difference in iTRAQ reporter ratio (p < 0.05) for at least one of the chromatin digests (Table I). The shortlisted proteins were then clustered according to their relative abundance in the chromatin digests of cells subjected to normoxia, hypoxia, or re-oxygenation protocols. An orthogonal SRM-based quantitative proteomic strategy was used for post-proteomic validation using 15 protein candidates. At least two peptides for each protein and three to five of the strongest transitions for each peptide (see “SRM Validation of iTRAQ Results (Hypoxia Cancer Progression)” in the supplemental material) were used for SRM quantitation. SRM quantification results (supplemental Fig. S2) showed chromatin binding topology comparable to the iTRAQ results, indicating the reproducibility and reliability of our chromatome profiling strategy.
Table I. Proteins identified in the chromatin digests.
Chromatin Organization and Transcriptional Regulation during Hypoxia
The hypoxic tumor microenvironment plays a central role in both local and systemic cancer cell proliferation and contributes to the acquisition of radio- and chemoresistant properties (20). Low-oxygen conditions are also known to critically influence numerous chromatin-dependent biological events such as transcription (21), replication (22), DNA repair (23), genomic rearrangement (24), and genome amplification (25). As dynamic changes in the composition and topology of the chromatin-associated proteome critically regulate these key cellular functions in response to changing environmental conditions, it is likely that a better understanding of how chromatome architecture is modified during hypoxia will shed light on numerous important aspects of tumor biology. In the current quantitative proteomic study, we identified a total of 114 proteins involved in chromatin organization and transcriptional regulation that were subject to modulation by changing environmental oxygen levels. Fig. 2 and supplemental Figs. S3A–S3D and S4A–S4F show the differential release of these proteins by partial DNase I digestion of the chromatin samples obtained from the cancer cells cultured under different conditions. Further analysis of these proteomic data enabled the identification of seven distinct protein clusters (a–g) that shared similar chromatin association topology under specific oxygenation conditions and displayed comparable patterns of release by DNase I digestion (Fig. 2). Proteins in cluster a were enriched in chromatin extracts from cells cultured under normoxic conditions but displayed reduced chromatin association during hypoxia. These molecules included proteins DEK and INO80, as well as the condensin complex subunits SMC2, SMC4, NCAPD2, and NCAPG (Fig. 2, supplemental Figs. S3A–S3D). Similarly, cluster c proteins incorporated the chromatin organizing proteins CHAF1B, DNMT1, UHRF1, and CHD4, which were abundant only in the supernatant fraction of normoxic samples (supplemental Figs. S3B and S3D), indicating that hypoxia stress substantially reduced their binding to chromatin. As chromatin organizing proteins and molecular platforms such as the condensin complex are closely associated with cell cycle regulation, it is possible that reduced chromatin binding by proteins in clusters a and c could be attributed to cell cycle disruption due to hypoxia stress (26, 27). Consistent with these proteomic data, our cell cycle analysis of cancer cells that had been subjected to hypoxia revealed a corresponding cell cycle arrest in G0–G1 phase (supplemental Figs. S5B and S5C).
Fig. 2.

Hierarchical clustering of chromatin organizer proteins and transcriptional regulators. A431 cancer cells were cultured under variable conditions of normoxia (Nx), 48 h hypoxia (Hx48), 72 h hypoxia (Hx72), or 48 h hypoxia followed by 24 h re-oxygenation (Rx). Chromatin was then extracted from the cells and subjected to partial DNase I digestion to release euchromatin-binding proteins into the supernatant (suffix S) and leave heterochromatin-bound proteins behind in the undigested pellet (suffix P). Cluster analysis of these data identified a group of proteins that were enriched in Nx samples (cluster a) either in the supernatant fraction (Nx-S; cluster a1) or in the pellet fraction (Nx-P; cluster a2). Cluster b proteins were instead associated with hypoxia and were enriched in both the Hx48 and Hx72 pellet samples (cluster b1), in the Hx48-P fraction only (cluster b2), or in both the Hx48-P and Rx-P fractions (cluster b3). Other proteins were detected at high concentrations only in a single sample fraction, including cluster c (Nx-S), cluster d (Rx-S), cluster e (Hx48-S), and cluster f (Hx72-S). Finally, proteins in clusters g1, g3, and g5 were comparatively enriched in the Hx48-S fraction, whereas clusters g2 and g4 displayed high abundance in both the Nx-S and Hx48-P fractions.
Our DNase I digestion data indicated that key epigenetic regulators including PRMT1, TOX4, and the NuRD complex components HDAC2, MBD2, MTA1, and MTA2 were rapidly released by partial digestion and were relatively abundant in the re-oxygenated supernatant samples (cluster d; supplemental Figs. S3B and S3D). Recent findings suggest that histone deacetylases can regulate apoptosis and mediate expression of VEGF and HIF-1α in hypoxia-stressed cells (28), and MTA family proteins are reported to be pro-metastatic molecules that are overexpressed in a wide range of cancers (29). Protein arginine methyltransferases have also been identified as exerting critical roles in cell proliferation and modulation of the tumor microenvironment (30), and thus increased euchromatin binding of histone deacetylases, MTA proteins, and protein arginine methyltransferases during re-oxygenation would be expected to alter gene expression and potentially enhance oncogenesis/metastasis in developing cancer cells. Cluster d proteins that were enriched in the re-oxygenated supernatant fraction also included numerous transcription factors (CCAR1, KHSRP, GTF3C3, GTF3C5, ILF2, and ILF3) consistent with euchromatin binding of these proteins and modification of gene expression during re-oxygenation.
Proteins in cluster e and cluster g were enriched in the supernatant fraction of chromatin extracted from cells that had been subjected to hypoxia for 48 h but were depleted from digests of cells that had been subjected to longer periods of hypoxia. These proteins included the transcriptional regulator MECP2, polymerase POLR2G, and multiple transcription factors (GCFC, GTF3C4, TAF2, TAF4, and TAF9) (supplemental Figs. S3D and S4E). Hypoxia-induced binding of MECP2 in the hyper-methylated CpG island of euchromatin mediates silencing of tumor suppressor genes and increases cancer cell survival during hypoxia stress (31), and reduced chromatin binding of TAF molecules is associated with activation of the p53-induced pathway of apoptosis after prolonged hypoxia (32). In contrast, the proteins grouped in cluster f (including JUND and SMAD3) (Fig. 2, supplemental Figs. S4A and S4B) were instead enriched in the chromatin supernatants of cells cultured under hypoxia for 72 h, suggesting increased euchromatin binding only after prolonged oxygen deprivation, and indicating that these proteins might contribute to oncogene activation in developing tumors (33, 34).
Quantitative proteomic profiling revealed that cluster b proteins, including the transcriptional regulators NAT10, CIRH1A, and NOC2L, and chromatin organizing proteins HP1BP3 and KDM5B remained unreleased by DNase I digestion and were detected at high levels in hypoxic chromatin pellets relative to other digests (Fig. 2, supplemental Fig. S3A). These data indicated increased binding of cluster b proteins to heterochromatin in response to hypoxia stress, consistent with a role for these molecules in the repression of tumor suppressor genes during malignant progression (35, 36). In agreement with our proteomic data, other investigators have recently reported a role for KDM5B in regulating the expression of E2f genes via remodeling of heterochromatin during cell cycle progression (37), and our Western blot analysis confirmed that HP1BP3 binding to chromatin was increased by hypoxia stress (supplemental Figs. S6A and S6B). Indeed, we have previously demonstrated that HP1BP3 plays an important role in the maintenance of heterochromatin integrity, and that depletion of HP1BP3 increases the MNase sensitivity of chromatin samples (38). Accordingly, our MNase digestion experiments confirmed that hypoxia increased chromatin resistance to nuclease activity, suggesting that these samples contained increased proportions of heterochromatin compaction (Fig. 3). Taken together, our proteomic and biological data were consistent with a role for HP1BP3-mediated chromatin condensation in hypoxia-induced gene modulation in tumorigenesis.
Fig. 3.
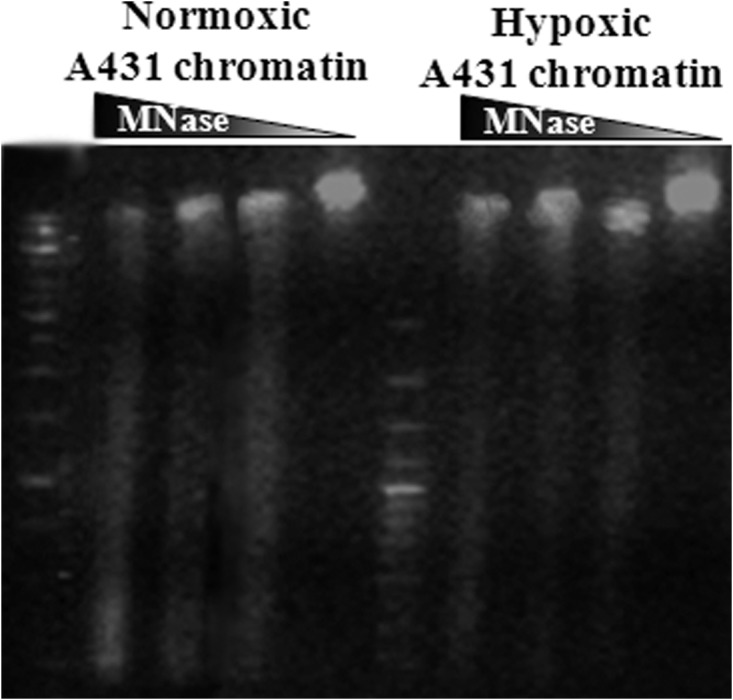
Hypoxia is associated with increased chromatin resistance to nuclease digestion. Agarose gel separation of MNase-digested chromatin obtained from A431 cancer cells subjected to either normoxia or hypoxia. Data suggest increased proportions of heterochromatin compaction in cells cultured under low-oxygen conditions.
HP1BP3 Is a Novel Regulator of Tumor Biology during Hypoxia
HP1BP3 is directly involved in heterochromatin organization and regulation of gene transcription (38), so we next tested whether HP1BP3 mediates global heterochromatinization during hypoxia stress by depleting HP1BP3 in A431 cells with shRNAs (supplemental Figs. S7A–S7C) and observing the effects of HP1BP3 deficiency on tumor progression in low-oxygen conditions. We reconfirmed HP1BP3 depletion effects by repeating few important experiments with different shRNAs.
Having previously established that hypoxia reduces cell viability and induces cell cycle arrest at G0–G1 phase (supplemental Figs. S5A–S5C), and considering our previous finding that HP1BP3 promotes G1/S transition (38), we next sought to determine the effects of HP1BP3 knockdown on cancer cell growth in vitro. Our MTT assays and clonogenicity experiments indicated that HP1BP3-depleted A431 cells were more proliferative than their mock-depleted counterparts during normal cell culture conditions (Figs. 4A, 4C, and 4D; supplemental Figs. S8A–S8C), which suggested a role for HP1BP3-induced heterochromatinization in G0–G1 arrest during hypoxia. HP1BP3-depleted cells also displayed loss of clonogenicity during hypoxia stress, but they formed larger colonies than those generated by mock-depleted cells (Figs. 4E and 4F). These data indicated that depletion of HP1BP3 reduced cell viability during hypoxia but simultaneously increased the proliferation of the surviving cells. Previous experimental data have indicated that hypoxia-induced cell cycle arrest in G0–G1 phase can increase survival by suppressing the p53-induced pathway of apoptosis (39). Indeed, our Western blot analysis revealed that p53 expression levels were increased by ∼1.8-fold in HP1BP3-depleted A431 cells (supplemental Figs. S9A and S9B), and our proteomic data indicated that the extent of p53 association with chromatin was reduced during hypoxia stress (supplemental Fig. S4F). We therefore propose that HP1BP3-mediated heterochromatinization induces transcriptional reprogramming as well as cell cycle arrest in G0–G1 phase to reduce apoptotic death and promote cancer cell survival.
Fig. 4.

HP1BP3 depletion differentially modulates cancer cell viability and clonogenicity. Viability of HP1BP3-depleted A431 cells as assessed by MTT assay after 24 h culture under normoxia (A), or the same cells subjected to 48 h hypoxia or 24 h hypoxia/24 h re-oxygenation (B), with survival expressed relative to the viability of mock-depleted control cells. Representative images and quantification of crystal violet staining in HP1BP3-depleted A431 cells and mock-depleted control cells after 10 days of culture in normoxic conditions (C and D) or the same cells subjected to 48 h normoxia, 48 h hypoxia, or 24 h hypoxia/24 h re-oxygenation prior to culture (E and F). Each experiment was performed in triplicate (*p < 0.05, **p < 0.005).
Regulatory Role of HP1BP3 in Extracellular Matrix Adhesion and Cell Migration
In vivo, tumor cells are surrounded by a complex extracellular matrix (ECM) that exerts a critical influence on tumor cell morphology, proliferation, survival, migration, invasion, and differentiation (40–42). We have previously shown that hypoxia stress alters cancer cell adhesion and metastatic potential by changing the expression of key ECM proteins (18, 19). In order to assess the role played by HP1BP3 in cancer cell motility, we investigated the effect of HP1BP3 knockdown on the efficiency of cell adhesion to matrices including collagen type I, fibronectin, and laminin. Depletion of HP1BP3 significantly increased cancer cell adhesion to collagen and laminin, whereas binding to fibronectin was markedly reduced (supplemental Figs. S10A and S10B). Conversely, under hypoxia, cancer cell adhesion to collagen and laminin was substantially reduced, whereas binding to fibronectin was enhanced (Figs. 5A–5C). However, HP1BP3 depletion also had a significant influence on hypoxia-induced cancer cell adhesion to different ECM components (Figs. 5A–5C). Our previous studies showed that depletion of HP1BP3 led to alter expression levels of adhesion molecules, including up-regulation of integrin α-6 and β-4 and down-regulation of β-1 isoforms (38), which might be responsible for the alternation of the adhesion property of HP1BP3-depleted cells. Thus hypoxia-induced chromatin condensation as mediated by HP1BP3 may instead the expression of adhesion molecules including integrin isoforms in cancer cells that critically regulate migratory potential, as observed in our previous study (19).
Fig. 5.

HP1BP3-dependent modulation of cancer cell adhesion during hypoxia. A431 cells were subjected to 48 h normoxia (Nx), 48 h hypoxia (Hx), or 24 h hypoxia followed by 24 h re-oxygenation (Rx) and then assessed for adhesion to collagen- (A), laminin- (B), and fibronectin-based (C) matrices. Each experiment was performed at least in triplicate (*p < 0.05, **p < 0.005).
Hypoxia-induced tumor cell migration and tissue invasion play major roles in the metastasis of cancers (18). We therefore performed wound healing and trans-well assays to investigate the requirement for HP1BP3 in cancer cell migration in vitro. These analyses indicated that cancer cell migration was significantly increased following HP1BP3 depletion and was further augmented by culture under conditions of hypoxia or re-oxygenation (Figs. 6A–6D). Given that highly migratory and invasive cancer cells are characterized by a loss of cell–cell adhesion and increased binding to ECM components (43), our observations suggest that HP1BP3-mediated heterochromatinization can reprogram gene expression to increase cancer cell migration by modifying key interactions with the ECM according to the prevailing oxygen level in the local microenvironment.
Fig. 6.

HP1BP3-mediated regulation of cell migration. Effect of HP1BP3 depletion on cell migration as assessed via scratch assay (A) or trans-well assay (B) conducted under normoxic conditions, or the same assays conducted with cells that had been subjected to 48 h hypoxia or 24 h hypoxia/24 h re-oxygenation (C and D). Each experiment was performed at least in triplicate (*p < 0.05, **p < 0.005).
Hypoxia and HP1BP3 in Radio- and Chemoresistance
Extensive clinical and experimental data have established that hypoxia induces cancer cell resistance to radio- and chemotherapy, as well as promoting genetic instability and metastasis (44–46). The therapeutic use of ionizing radiation and chemotherapeutic agents is known to induce DNA double-strand breaks (DSBs) that trigger apoptosis of cancer cells, but the effects of hypoxia-induced genetic instability on DNA repair mechanisms in developing tumors are not well understood. Multiple mechanisms can repair DSBs in damaged host cells, including non-homologous end joining (NHEJ) and homologous recombination. Our iTRAQ-based proteomic data and Western blot analyses confirmed that the NHEJ-associated proteins XRCC5 and XRCC6 were enriched in the supernatant fractions of chromatin extracted from cells cultured in low-oxygen or re-oxygenation conditions (Hx48-S, Hx72-S, and Rx-S), whereas a third NHEJ-associated protein, PRKDC, was identified at high concentrations only in the pellet fractions of hypoxic chromatin samples (Figs. 7A–7E). These data suggested that the NHEJ pathway is active in cancer cells that have been subjected to hypoxia, consistent with our recent report that NHEJ-associated proteins are up-regulated during hypoxia/re-oxygenation of cancer cells and contribute to radio- and chemoresistance (19). Proteomic profiling also identified hypoxia/re-oxygenation-induced increases in chromatin binding by NHEJ facilitator proteins (MDC1, NONO, and SFPQ) and alternative DSB-associated proteins (APEX1, PIG16, PRPF19, RECQL, XPC, PSPC1, RPA1, and TP53BP1) (Fig. 7A). DSB repair by homologous recombination is restricted to the late S and G2 phases of the cell cycle, whereas NHEJ repair of DSBs can occur throughout interphase (47, 48), and our previous analyses of cell-cycle-associated changes in the chromatome suggested that NHEJ repair mechanisms operate throughout interphase but are particularly active during G1 and G2 (38). Our findings are therefore consistent with the concept that hypoxia induces G0–G1 cycle arrest to enhance NHEJ-mediated repair of DSBs and increase cancer cell resistance to radio- and chemotherapy. In addition to NHEJ-based DNA repair, hypoxia can also influence both the expression and chromatin binding topology of multiple other proteins that confer increased radio- and chemoresistance on cancer cells. Having already observed that HP1BP3 expression is associated with increased cancer cell viability during hypoxia, we next sought to determine the role of this protein in radio- and chemoresistance. To do this, we treated HP1BP3-depleted A431 cells (or mock-depleted control cells) with either 10 Gy ionizing radiation or doxorubicin for 24 h and assessed cell viability via MTT assay. We observed that HP1BP3 depletion increased cancer cell susceptibility to both radiation treatment (viability decreased ∼18%; Fig. 8A) and doxorubicin exposure (IC50 of doxorubicin treatment decreased from 670.2 ± 62 ng/ml to 503.2 ± 36 ng/ml; Fig. 8B). Taken together, our data reveal a novel role for HP1BP3-induced heterochromatinization in genetic reprogramming of cancer cells during hypoxia, leading to the acquisition of radio- and chemoresistant characteristics.
Fig. 7.

Differential chromatin association of DNA repair proteins during hypoxia stress. A, iTRAQ ratio indicating the relative abundance of different proteins in the samples. B, Western blot showing the chromatin-association levels of proteins Ku70, Ku80, and histone H4 in samples extracted from A431 cells cultured under 48 h normoxia (Nx), 48 h hypoxia (Hx48), 72 h hypoxia (Hx72), or 48 h hypoxia/24 h re-oxygenation (Rx). C, Western blot indicating the quantities of Ku80 and Ku70 proteins obtained via partial DNase I digestion of the chromatin samples (supernatant fraction, suffix S; pellet fraction, suffix P).
Fig. 8.
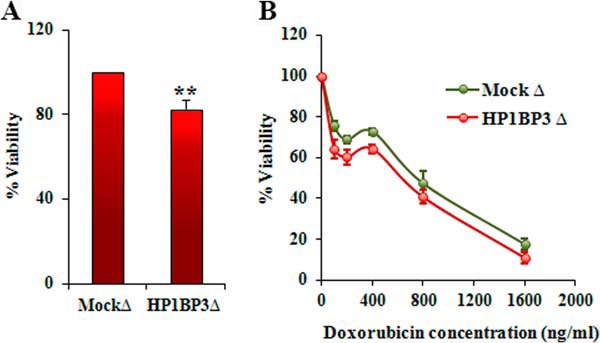
HP1BP3 decreases cancer cell resistance to radio- and chemotherapy. Viability of HP1BP3-deleted A431 cells as measured by MTT assay after exposure to 10 Gy ionizing radiation (A) or after treatment with 0 to 1600 ng/ml doxorubicin (B) relative to mock-depleted control cells (n = 6 experimental replicates, **p < 0.005).
Hypoxia and HP1BP3 in Self-renewal of Cancer Stem Cells
Cancer stem cells (CSCs) exhibit stem-cell-like properties and are thought to play a critical role in the initiation and development of tumors. Previous reports have identified that hypoxia-inducible factor expression in response to low-oxygen conditions induces changes in gene expression that imbue CSCs with an increased capacity for self-renewal and multipotency during cancer progression (49–51). We therefore hypothesized that HP1BP3-induced heterochromatinization and transcriptional reprogramming of cancer cells can promote the generation of CSC-like cells in developing tumors. To test this, we conducted sphere formation assays using different HP1BP3-depleted A431 and U2OS phenotypes in which we observed that over a 10-day culture period, HP1BP3-depleted A431 cells generated far smaller tumor spheres (mean diameter 25 ± 5 μm) than did their mock-depleted counterparts (mean diameter 82 ± 15 μm) (supplemental Figs. S11A–S11C). The number of tumor spheres formed by mock-depleted A431 cells was also ∼4-fold higher than that generated by HP1BP3-depleted A431 cells (supplemental Fig. S11B). Two other HP1BP3-depletion A431 phenotypes obtained by using different shRNAs showed comparable results (supplemental Figs. S11D–S11F), suggesting their on-target effect. A similar effect was observed in U2OS cells upon HP1BP3 depletion (supplemental Figs. S12A–S12C), suggesting HP1BP3 regulates cancer cells' self-renewal property in a cell-line-independent manner. These data were in line with our hypothesis that HP1BP3-mediated heterochromatinization induces changes in gene expression that regulate the self-renewal potential of CSC-like cancer cells. When we subjected A431 cells to either hypoxia or hypoxia/re-oxygenation prior to commencing the tumor sphere assay, we observed that tumor formation by mock-depleted A431 cells was ∼2.5-fold more efficient under hypoxic conditions than under either normoxia or re-oxygenation conditions (Fig. 9). In contrast, HP1BP3-depleted cancer cells displayed inefficient tumor sphere formation in normoxia or re-oxygenation conditions, and they failed to generate any tumor spheres at all under hypoxic conditions (Fig. 9B). Analysis of tumor size distribution further revealed that the average diameter of tumor spheres generated by mock-depleted cancer cells was increased during hypoxia (65 ± 7 μm) and re-oxygenation (80 ± 13 μm) relative to normoxia (41 ± 5 μm) (Fig. 9C). In contrast, the average sphere diameter formed by HP1BP3-depleted cells was not significantly altered by the hypoxia/re-oxygenation protocol (34 ± 6 μm) relative to normoxia (30 ± 4 μm). The effect of HP1BP3 depletion upon tumor sphere formation was further confirmed using another two shRNAs (supplemental Fig. S13). Comparable results were also observed in mock and HP1BP3-depleted U2OS cells under similar conditions (supplemental Fig. S14). Taken together, these data suggest that the hypoxia-induced acquisition of a CSC-like capacity for self-renewal is regulated in an HP1BP3-dependent manner.
Fig. 9.

HP1BP3 depletion inhibits cancer cell renewal during hypoxia/re-oxygenation. HP1BP3-depleted A431 cells were cultured in 48 h normoxia (Nx), 48 h hypoxia (Hx), or 24 h hypoxia/24 h re-oxygenation (Rx) and then assessed for tumor sphere formation over 10 days of culture (A and B). C, size distribution of tumor spheres formed by HP1BP3-depleted A431 cells subjected to the same conditions. Each experiment was performed in triplicate (*p < 0.05, **p < 0.005).
Role of HP1BP3 in Tumorigenesis
Our cell-line-based experiments strongly implicated HP1BP3 in the regulation of multiple biological processes that might contribute to cancer growth and malignancy. We therefore evaluated the role of HP1BP3 in oncogenesis in vivo using a xenograft animal model of tumor growth. Using this approach, we observed that mock-depleted A431 cells produced tumors in all mice (n = 6) that received these cells via subcutaneous injection, whereas HP1BP3-depleted cells produced tumors in only three of six mice injected with these cells. The tumors generated by HP1BP3-depleted cells also displayed significantly reduced size and mass relative to the tumors generated by mock-depleted cells (Figs. 10A–10C). Taken with our cell-line-based experiments that suggested a role for HP1BP3 in promoting cancer cell viability, self-renewal, and resistance to therapy, our xenograft tumor data suggest that HP1BP3 depletion is associated with a loss of CSC-like properties, leading to reduced tumorigenic potential both in vitro and in vivo. Our findings are thus consistent with a recent report that disruption of genes that regulate the “stemness” of CSCs markedly reduces tumorigenic potential (52), and they suggest that therapeutic targeting of HP1BP3 might represent a novel approach to treatment in a range of different malignancies.
Fig. 10.
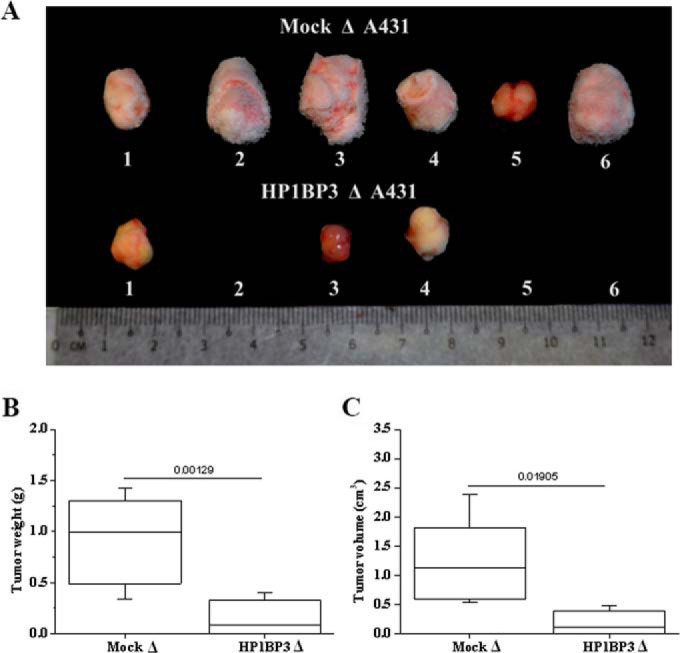
HP1BP3-depleted A431 cells exhibit reduced tumorigenicity in vivo. A, images of tumors formed by HP1BP3-depleted A431 cells in vivo compared with mock-depleted control cells. B, C, mass/size distribution of tumors showing that mock-depleted A431 cells generated larger tumors than HP1BP3-depleted cells (n = 6 NCr nude mice per group, p < 0.05).
CONCLUSION
In this study we used partial DNase I digestion together with an iTRAQ-based quantitative proteomics approach to delineate the chromatin association topology of the proteins that constitute the chromatome and to establish how these molecules are modulated in cancer cells subjected to low-oxygen conditions. Although the hypoxia-induced evolution of chromatin biology is known to play a crucial role in oncogenesis, data that describe global changes in the chromatome dynamics that regulate cellular responses to changing environmental conditions are extremely limited. In our study, we found that the chromatin-binding protein HP1BP3 altered its binding topology in a hypoxia-dependent manner and promoted heterochromatinization in order to modulate gene expression and induce cancer cells to acquire a CSC-like phenotype. Accordingly, depletion of HP1BP3 decreased cancer cell viability, therapy resistance, and stemness under hypoxic conditions, leading to decreased tumorigenic potential of these cells both in vitro and in vivo. These data suggest that targeting of HP1BP3 might provide new therapeutic approaches in a wide range of human cancers.
Supplementary Material
Acknowledgments
We thank Neil McCarthy for a critical review of the manuscript.
Footnotes
Author contributions: S.S. and B.D. designed research; B.D. and Y.R. performed research; S.L. and J.P.T. contributed new reagents or analytic tools; B.D. and S.S. analyzed data; B.D. and S.S. wrote the paper.
* This work is in part supported by the Singapore National Research Foundation under its CBRG (NMRC/CBRG/0004/2012) administered by the Singapore Ministry of Health's National Medical Research Council, and by the Singapore National Research Foundation under its CRP (NRF2011 NRF-CRP 001-109).
 This article contains supplemental material.
1 The abbreviations used are:
- iTRAQ
- isobaric tags for relative and absolute quantitation
- Nx
- normoxic
- Rx
- re-oxygenation
- TEAB
- triethylammonium bicarbonate
- ACN
- acetonitrile
- Hx
- hypoxic
- SRM
- selected reaction monitoring
- MNase
- micrococcal nuclease
- MTT
- 3-(4,5-dimethylthiazol-2-yl)-2,5-diphenyltetrazolium bromide
- ECM
- extracellular matrix
- DSB
- double-strand break
- NHEJ
- non-homologous end joining
- CSC
- cancer stem cell.
REFERENCES
- 1. Ruan K., Song G., Ouyang G. (2009) Role of hypoxia in the hallmarks of human cancer. J. Cell Biochem. 107, 1053–1062 [DOI] [PubMed] [Google Scholar]
- 2. Brizel D. M., Dodge R. K., Clough R. W., Dewhirst M. W. (1999) Oxygenation of head and neck cancer: changes during radiotherapy and impact on treatment outcome. Radiother. Oncol. 53, 113–117 [DOI] [PubMed] [Google Scholar]
- 3. Nordsmark M., Overgaard M., Overgaard J. (1996) Pretreatment oxygenation predicts radiation response in advanced squamous cell carcinoma of the head and neck. Radiother. Oncol. 41, 31–39 [DOI] [PubMed] [Google Scholar]
- 4. Ghattass K., Assah R., El-Sabban M., Gali-Muhtasib H. (2013) Targeting hypoxia for sensitization of tumors to radio- and chemotherapy. Curr. Cancer Drug Targets 13, 670–685 [DOI] [PubMed] [Google Scholar]
- 5. Nguyen M. P., Lee S., Lee Y. M. (2013) Epigenetic regulation of hypoxia inducible factor in diseases and therapeutics. Arch. Pharm. Res. 36, 252–263 [DOI] [PubMed] [Google Scholar]
- 6. Li P., Zhou C., Xu L., Xiao H. (2013) Hypoxia enhances stemness of cancer stem cells in Glioblastoma: An in vitro study. Int. J. Med. Sci. 10, 399–407 [DOI] [PMC free article] [PubMed] [Google Scholar]
- 7. Moyer M. W. (2012) Targeting hypoxia brings breath of fresh air to cancer therapy. Nat. Med. 18, 636–637 [DOI] [PubMed] [Google Scholar]
- 8. Wu C. Y., Tsai Y. P., Wu M. Z., Teng S. C., Wu K. J. (2012) Epigenetic reprogramming and post-transcriptional regulation during the epithelial-mesenchymal transition. Trends Genet. 28, 454–463 [DOI] [PubMed] [Google Scholar]
- 9. Johnson A. B., Barton M. C. (2007) Hypoxia-induced and stress-specific changes in chromatin structure and function. Mutat. Res. 618, 149–162 [DOI] [PMC free article] [PubMed] [Google Scholar]
- 10. Wang F., Zhang R., Beischlag T. V., Muchardt C., Yaniv M., Hankinson O. (2004) Roles of Brahma and Brahma/SWI2-related gene 1 in hypoxic induction of the erythropoietin gene. J. Biol. Chem. 279, 46733–46741 [DOI] [PubMed] [Google Scholar]
- 11. Isaacs J. T., Antony L., Dalrymple S. L., Brennen W. N., Gerber S., Hammers H., Wissing M., Kachhap S., Luo J., Xing L., Bjork P., Olsson A., Bjork A., Leanderson T. (2013) Tasquinimod is an allosteric modulator of HDAC4 survival signaling within the compromised cancer microenvironment. Cancer Res. 73, 1386–1399 [DOI] [PMC free article] [PubMed] [Google Scholar]
- 12. Steinmann K., Richter A. M., Dammann R. H. (2011) Epigenetic silencing of erythropoietin in human cancers. Genes Cancer 2, 65–73 [DOI] [PMC free article] [PubMed] [Google Scholar]
- 13. Tsai Y. P., Wu K. J. (2013) Epigenetic regulation of hypoxia-responsive gene expression: focusing on chromatin and DNA modifications. Int. J. Cancer 134, 249–256 [DOI] [PubMed] [Google Scholar]
- 14. Robinson C. M., Neary R., Levendale A., Watson C. J., Baugh J. A. (2012) Hypoxia-induced DNA hypermethylation in human pulmonary fibroblasts is associated with Thy-1 promoter methylation and the development of a pro-fibrotic phenotype. Respir. Res. 13, 74. [DOI] [PMC free article] [PubMed] [Google Scholar]
- 15. Dutta B., Adav S. S., Koh C. G., Lim S. K., Meshorer E., Sze S. K. (2012) Elucidating the temporal dynamics of chromatin-associated protein release upon DNA digestion by quantitative proteomic approach. J. Proteomics 75, 5493–5506 [DOI] [PubMed] [Google Scholar]
- 16. Hanahan D., Weinberg R. A. (2000) The hallmarks of cancer. Cell 100, 57–70 [DOI] [PubMed] [Google Scholar]
- 17. Thiery J. P. (2002) Epithelial-mesenchymal transitions in tumour progression. Nat. Rev. Cancer 2, 442–454 [DOI] [PubMed] [Google Scholar]
- 18. Park J. E., Tan H. S., Datta A., Lai R. C., Zhang H., Meng W., Lim S. K., Sze S. K. (2010) Hypoxic tumor cell modulates its microenvironment to enhance angiogenic and metastatic potential by secretion of proteins and exosomes. Mol. Cell. Proteomics 9, 1085–1099 [DOI] [PMC free article] [PubMed] [Google Scholar]
- 19. Ren Y., Hao P., Dutta B., Cheow E. S., Sim K. H., Gan C. S., Lim S. K., Sze S. K. (2013) Hypoxia modulates A431 cellular pathways association to tumor radioresistance and enhanced migration revealed by comprehensive proteomic and functional studies. Mol. Cell. Proteomics 12, 485–498 [DOI] [PMC free article] [PubMed] [Google Scholar]
- 20. Chaplin D. J., Olive P. L., Durand R. E. (1987) Intermittent blood flow in a murine tumor: radiobiological effects. Cancer Res. 47, 597–601 [PubMed] [Google Scholar]
- 21. Johnson A. B., Denko N., Barton M. C. (2008) Hypoxia induces a novel signature of chromatin modifications and global repression of transcription. Mutat. Res. 640, 174–179 [DOI] [PMC free article] [PubMed] [Google Scholar]
- 22. Young S. D., Marshall R. S., Hill R. P. (1988) Hypoxia induces DNA over replication and enhances metastatic potential of murine tumor cells. Proc. Natl. Acad. Sci. U.S.A. 85, 9533–9537 [DOI] [PMC free article] [PubMed] [Google Scholar]
- 23. Bristow R. G., Hill R. P. (2008) Hypoxia and metabolism. Hypoxia, DNA repair and genetic instability. Nat. Rev. Cancer 8, 180–192 [DOI] [PubMed] [Google Scholar]
- 24. Coquelle A., Toledo F., Stern S., Bieth A., Debatisse M. (1998) A new role for hypoxia in tumor progression: induction of fragile site triggering genomic rearrangements and formation of complex DMs and HSRs. Mol. Cell 2, 259–265 [DOI] [PubMed] [Google Scholar]
- 25. Rice G. C., Hoy C., Schimke R. T. (1986) Transient hypoxia enhances the frequency of dihydrofolate reductase gene amplification in Chinese hamster ovary cells. Proc. Natl. Acad. Sci. U.S.A. 83, 5978–5982 [DOI] [PMC free article] [PubMed] [Google Scholar]
- 26. Thadani R., Uhlmann F., Heeger S. (2012) Condensin, chromatin crossbarring and chromosome condensation. Curr. Biol. 22, R1012–R1021 [DOI] [PubMed] [Google Scholar]
- 27. Schneider K., Fuchs C., Dobay A., Rottach A., Qin W., Wolf P., Alvarez-Castro J. M., Nalaskowski M. M., Kremmer E., Schmid V., Leonhardt H., Schermelleh L. (2013) Dissection of cell cycle-dependent dynamics of Dnmt1 by FRAP and diffusion-coupled modeling. Nucleic Acids Res. 41, 4860–4876 [DOI] [PMC free article] [PubMed] [Google Scholar]
- 28. Mizuno S., Yasuo M., Bogaard H. J., Kraskauskas D., Natarajan R., Voelkel N. F. (2011) Inhibition of histone deacetylase causes emphysema. Am. J. Physiol. Lung Cell Mol. Physiol. 300, L402–L413 [DOI] [PubMed] [Google Scholar]
- 29. Toh Y., Nicolson G. L. (2009) The role of the MTA family and their encoded proteins in human cancers: molecular functions and clinical implications. Clin. Exp. Metastasis 26, 215–227 [DOI] [PubMed] [Google Scholar]
- 30. Lim J. H., Choi Y. J., Cho C. H., Park J. W. (2012) Protein arginine methyltransferase 5 is an essential component of the hypoxia-inducible factor 1 signaling pathway. Biochem. Biophys. Res. Commun. 418, 254–259 [DOI] [PubMed] [Google Scholar]
- 31. Agrawal S., Hofmann W. K., Tidow N., Ehrich M., van den Boom D., Koschmieder S., Berdel W. E., Serve H., Muller-Tidow C. (2007) The C/EBPdelta tumor suppressor is silenced by hypermethylation in acute myeloid leukemia. Blood 109, 3895–3905 [DOI] [PubMed] [Google Scholar]
- 32. Riley T., Sontag E., Chen P., Levine A. (2008) Transcriptional control of human p53-regulated genes. Nat. Rev. Mol. Cell Biol. 9, 402–412 [DOI] [PubMed] [Google Scholar]
- 33. Chen D., Reierstad S., Fang F., Bulun S. E. (2011) JunD and JunB integrate prostaglandin E2 activation of breast cancer-associated proximal aromatase promoters. Mol. Endocrinol. 25, 767–775 [DOI] [PMC free article] [PubMed] [Google Scholar]
- 34. Abdul-Hafez A., Shu R., Uhal B. D. (2009) JunD and HIF-1alpha mediate transcriptional activation of angiotensinogen by TGF-beta1 in human lung fibroblasts. FASEB J. 23, 1655–1662 [DOI] [PMC free article] [PubMed] [Google Scholar]
- 35. Lv J., Liu H., Wang Q., Tang Z., Hou L., Zhang B. (2003) Molecular cloning of a novel human gene encoding histone acetyltransferase-like protein involved in transcriptional activation of hTERT. Biochem. Biophys. Res. Commun. 311, 506–513 [DOI] [PubMed] [Google Scholar]
- 36. Liu H., Ling Y., Gong Y., Sun Y., Hou L., Zhang B. (2007) DNA damage induces N-acetyltransferase NAT10 gene expression through transcriptional activation. Mol. Cell Biochem. 300, 249–258 [DOI] [PubMed] [Google Scholar]
- 37. Nijwening J. H., Geutjes E. J., Bernards R., Beijersbergen R. L. (2011) The histone demethylase Jarid1b (Kdm5b) is a novel component of the Rb pathway and associates with E2f-target genes in MEFs during senescence. PLoS One 6, e25235. [DOI] [PMC free article] [PubMed] [Google Scholar]
- 38. Dutta B., Ren Y., Hao P., Sim K. H., Cheow E. S., Adav S., Tam J. P., Sze S. K. (2014) Profiling of the chromatin-associated proteome identifies HP1BP3 as a novel regulator of cell cycle progression. Mol. Cell. Proteomics 10.1074/mcp.M113.034975 [DOI] [PMC free article] [PubMed] [Google Scholar]
- 39. Schmaltz C., Hardenbergh P. H., Wells A., Fisher D. E. (1998) Regulation of proliferation-survival decisions during tumor cell hypoxia. Mol. Cell Biol. 18, 2845–2854 [DOI] [PMC free article] [PubMed] [Google Scholar]
- 40. Gumbiner B. M. (1996) Cell adhesion: the molecular basis of tissue architecture and morphogenesis. Cell 84, 345–357 [DOI] [PubMed] [Google Scholar]
- 41. Schlie-Wolter S., Ngezahayo A., Chichkov B. N. (2013) The selective role of ECM components on cell adhesion, morphology, proliferation and communication in vitro. Exp. Cell Res. 319, 1553–1561 [DOI] [PubMed] [Google Scholar]
- 42. Hynes R. O., Lander A. D. (1992) Contact and adhesive specificities in the associations, migrations, and targeting of cells and axons. Cell 68, 303–322 [DOI] [PubMed] [Google Scholar]
- 43. Phillips-Mason P. J., Craig S. E., Brady-Kalnay S. M. (2011) Should I stay or should I go? Shedding of RPTPs in cancer cells switches signals from stabilizing cell-cell adhesion to driving cell migration. Cell Adhes. Migrat. 5, 298–305 [DOI] [PMC free article] [PubMed] [Google Scholar]
- 44. Kumareswaran R., Ludkovski O., Meng A., Sykes J., Pintilie M., Bristow R. G. (2012) Chronic hypoxia compromises repair of DNA double-strand breaks to drive genetic instability. J. Cell Sci. 125, 189–199 [DOI] [PubMed] [Google Scholar]
- 45. Huang L. E., Bindra R. S., Glazer P. M., Harris A. L. (2007) Hypoxia-induced genetic instability—a calculated mechanism underlying tumor progression. J. Cell Mol. Med. 85, 139–148 [DOI] [PubMed] [Google Scholar]
- 46. Banath J. P., Sinnott L., Larrivee B., MacPhail S. H., Olive P. L. (2005) Growth of V79 cells as xenograft tumors promotes multicellular resistance but does not increase spontaneous or radiation-induced mutant frequency. Radiat. Res. 164, 733–744 [DOI] [PubMed] [Google Scholar]
- 47. Lieber M. R. (2010) The mechanism of double-strand DNA break repair by the nonhomologous DNA end-joining pathway. Annu. Rev. Biochem. 79, 181–211 [DOI] [PMC free article] [PubMed] [Google Scholar]
- 48. Takashima Y., Sakuraba M., Koizumi T., Sakamoto H., Hayashi M., Honma M. (2009) Dependence of DNA double strand break repair pathways on cell cycle phase in human lymphoblastoid cells. Environ. Mol. Mutagen. 50, 815–822 [DOI] [PubMed] [Google Scholar]
- 49. Keith B., Simon M. C. (2007) Hypoxia-inducible factors, stem cells, and cancer. Cell 129, 465–472 [DOI] [PMC free article] [PubMed] [Google Scholar]
- 50. Mazumdar J., Dondeti V., Simon M. C. (2009) Hypoxia-inducible factors in stem cells and cancer. J. Cell Mol. Med. 13, 4319–4328 [DOI] [PMC free article] [PubMed] [Google Scholar]
- 51. Bao B., Ahmad A., Kong D., Ali S., Azmi A. S., Li Y., Banerjee S., Padhye S., Sarkar F. H. (2012) Hypoxia induced aggressiveness of prostate cancer cells is linked with deregulated expression of VEGF, IL-6 and miRNAs that are attenuated by CDF. PLoS One 7, e43726. [DOI] [PMC free article] [PubMed] [Google Scholar]
- 52. Wang X., Liu Q., Hou B., Zhang W., Yan M., Jia H., Li H., Yan D., Zheng F., Ding W., Yi C., Hai W. (2013) Concomitant targeting of multiple key transcription factors effectively disrupts cancer stem cells enriched in side population of human pancreatic cancer cells. PLoS One 8, e73942. [DOI] [PMC free article] [PubMed] [Google Scholar]
Associated Data
This section collects any data citations, data availability statements, or supplementary materials included in this article.