

Abstract
Human respiratory syncytial virus is a major respiratory pathogen for which there are no suitable antivirals or vaccines. A better understanding of the host cell response to this virus may redress this problem. The present report concerns analysis of multiple independent biological replicates of control and 24 h infected lysates of A549 cells by two different proteomic workflows. One workflow involved fractionation of lysates by in-solution protein IEF and individual fractions were digested using trypsin prior to capillary HPLC-LTQ-OrbitrapXL-MS/MS. A second workflow involved digestion of whole cell lysates and analysis by nanoUltraHPLC-LTQ-OrbitrapElite-MS/MS. Both workflows resulted in the quantification of viral proteins exclusively in lysates of infected cells in the relative abundances anticipated from previous studies. Unprecedented numbers (3247 - 5010) of host cell protein groups were also quantified and the infection-specific regulation of a large number (191) of these protein groups was evident based on a stringent false discovery rate cut-off (<1%). Bioinformatic analyses revealed that most of the regulated proteins were potentially regulated by type I, II, and III interferon, TNF-α and noncanonical NF-κB2 mediated antiviral response pathways. Regulation of specific protein groups by infection was validated by quantitative Western blotting and the cytokine-/key regulator-specific nature of their regulation was confirmed by comparable analyses of cytokine treated A549 cells. Overall, it is evident that the workflows described herein have produced the most comprehensive proteomic characterization of host cell responses to human respiratory syncytial virus published to date. These workflows will form the basis for analysis of the impacts of specific genes of human respiratory syncytial virus responses of A549 and other cell lines using a gene-deleted version of the virus. They should also prove valuable for the analysis of the impact of other infectious agents on host cells.
Human respiratory syncytial virus (hRSV)1 belongs to the Pneumovirus genus of the Pnuemovirinae subfamily of the Paramyxoviridae family of viruses. It has a negative-sense single-stranded RNA genome (1–3) with 10 distinct genes that encode 11 proteins (1–3). This virus is the most serious cause of viral respiratory disease of infants and young children (1–5). All children become infected at least once by 2 years of age (2–4). The annual worldwide incidence of hRSV infection has been estimated to be 64 million resulting in ∼160,000 fatalities (World Health Organization Initiative for Vaccine Research, 2010). Despite concerted efforts to develop vaccines (6–9) to combat the serious disease burden caused by hRSV, no vaccine has been licensed (1, 2, 4, 10). Therapeutic options for treatment of hRSV infections are also limited. Monoclonal antibodies are used prophylactically but the expense of this option restricts use for high risk individuals (11–14). Ribavirin is the only therapeutic agent used to treat hRSV but only in some circumstances and with questionable benefit and toxic side effects (1, 2, 14).
Repeated infections occur throughout life (3, 15), caused by poor initial and/or lasting immune responses (3, 14, 16, 17). These ineffective immune responses reflect, at least in-part, the potent ability of hRSV to impair host antiviral responses (3, 14, 16, 17). Although this may be beneficial to the virus, a better understanding of how hRSV impairs host antiviral responses may also be the basis for design of effective vaccines and/or therapeutic strategies. Accordingly, a variety of studies have been conducted to define host cell responses to hRSV infection at both the transcriptional (18–22) and proteomic (23–29) levels. This has included studies with forms of hRSV lacking genes that encode proteins known to impair host innate antiviral responses, such as the nonstructural protein1 (NS1) (24).
Various proteomic studies conducted with hRSV infected cells have made important individual contributions, however, it is arguable that various experimental design features have limited the extents of their impacts. For instance, the use of fractionation of cells into cytoplasmic and nuclear fractions (23, 25–27) is likely to have perturbed the ability to reliably quantify protein abundance changes at a global cellular level. Some of these studies may have been limited because of the lack of penetrating coverage of the proteomes using two-dimensional (2D)-gel-based protocols (23–25, 29), with (23, 25) and without (24, 29) subcellular fractionation steps. In some instances, proteome coverage may have been limited from an analytical technology standpoint (23–29). Finally, the reliability of some studies is questionable because of a lack of any biological or technical replicates (26–28).
In a previous study, 2D-gel methodologies were used in combination with DIGE to analyze unfractionated cell lysates to define cellular proteins and pathways targeted by NS1 of hRSV to impair antiviral responses (24). Although, that study provided valuable insights, it was apparent that in-solution IEF of lysate proteins combined with label free-based mass spectrometric quantification of digests of individual in-solution protein IEF fractions would be a more penetrating approach. This possibility was comprehensively assessed in the present study using five matched sets of independent replicates of mock- and hRSV-infected human A549 type II alveolar epithelial cells. Resultant label-free mass spectrometric signals were used for quantification by both spectral counting- and intensity-based approaches. Complementary analyses were also conducted by performing nanoUltra(nU)HPLC-MS/MS analyses directly on endoproteinase LysC/tryptic digests of four independent biological replicate sets of mock- and hRSV-infected A549 cells without any preliminary fractionation at the protein or peptides levels.
Together, quantitative data obtained in the present complementary holistic approaches corroborated the prevailing views that the type I and type III interferon (IFN) responses are major defenses used by epithelial cells to combat hRSV (3, 14, 16, 30, 31) and further indicate an antiviral role for type II IFN (24). Activation of tumor necrosis factor-alpha (TNF-α)- and nuclear factor kappa-light-chain-enhancer of activated B cells (NF-κB)-mediated cellular responses was also revealed.
EXPERIMENTAL PROCEDURES
The majority of the experimental procedures used in the study have been presented in detail in a recent publication (24). Accordingly, the general overall analytical workflow is presented in outline below (Fig. 1) and only new analytical protocols, reagents, and bioinformatic procedures are described in detail below.
Fig. 1.

Workflows used for the analysis of hRSV and uninfected A549 cells. Equal quantities of protein from lysates of five matched biological replicate sets of uninfected and hRSV-infected A549 cells were processed using A, in-solution protein IEF and B, four sets by protein fractionation-free B, workflows. Blue rectangles represent components common to both workflows. Orange rectangles are in-solution protein IEF workflow-specific and green rectangles are protein fractionation-free workflow-specific.
Overall Data Generation Workflow
All analyses conducted in this study involved human A549 type II alveolar epithelial cells that were either mock infected or infected at a multiplicity of infection of three plaque forming units/cell with a recombinant clone of hRSV containing the A2 genomic sequence (24, 32). Culture of all infected and mock treated cells were performed on a scale of ten million cells at the time of infection in T75 flasks. Cells were lysed 24 h postinfection, enriched for protein, and subjected to protein determination (24).
In-solution Protein IEF Workflow
Ten lysate samples of quantified protein (each of 1 mg) derived from five replicate sets of hRSV-infected and mock treated cells were subjected to individual separation of each lysate into 24 fractions by in-solution protein IEF over the nonlinear pI range of 3 −11 (Fig 1A). The success of each separation was confirmed by performing one-dimensional (1D)-SDS-PAGE analysis of all fractions on an analytical scale as described previously (24). Each IEF fraction was individually subjected to alkylation with iodoacetamide and tryptic digestion. Aliquots (7 μl) of tryptic digests were acidified with 1 μl of 50% (v/v) aqueous formic acid and loaded onto a 300 Å, 300 μm × 5 mm C18 trap column (Dionex Acclaim® PepMap™ μ-Precolumn) at 20 μl/min in 98% solvent A (0.1% (v/v) aqueous formic acid) and 2% solvent B (80% (v/v) ACN/20% (v/v) H2O containing 0.1% (v/v) formic acid) for 5 min at 40 °C and subsequently back flushed onto a pre-equilibrated analytical column (Vydac Everest C18 300Å, 150 μm × 150 mm, Alltech, Columbia, MD) using a flow rate of 1 μl/min. After washing the analytical column at 0% B for 5 min, peptides were separated at 40 °C using a linear gradient to 45% B over 75 min, a linear gradient to 75% B over 15 min, a linear gradient to 100% B over 5 min, and holding the column at 100% B for 10 min. Eluates from the analytical column were introduced into an LTQ-OrbitrapXL throughout the entire run via a dynamic nano-electrospray ion source (Proxeon, Denmark) containing a 30 μm inner diameter uncoated silica emitter (New Objective). Data acquisition was achieved as described in detail previously (24).
Protein Fractionation-free Workflow
Eight samples of equal quantities of proteins from four independently prepared matched replicate sets were individually digested without preliminary protein fractionation and subjected to nUHPLC-LTQ-OrbitrapElite analysis via a protein fractionation-free workflow (Fig. 1B). Cell lysates were enriched for proteins using a 2D clean-up kit (GE Healthcare) and a protein assay (GE Healthcare 2D Quant kit) was performed for protein estimation as per manufacturer's instructions. The protein pellets obtained after enrichment were resuspended in 50 mm Tris-HCL, 7 m urea, 2 m thiourea, and 2% (w/v) CHAPS, pH 8.8. Disulfide bonds were reduced with 22 mm tris (2-carboxyethyl) phosphine for 4 h at 4 °C and alkylated with 122 mm iodoacetamide at 22 °C for 2 h in the dark. The reduced and alkylated samples were concentrated by adding nine volumes of methanol at −20 °C and proteins were allowed to precipitate at −20 °C for ∼18 h. Precipitated proteins were washed thrice with 1 ml of −20 °C 90% (v/v) methanol and harvested at 4 °C by centrifugation at 16,000 × g for 20 min. The protein pellets were resuspended in 8 m urea/100 mm NH4HCO3 and sonicated for ∼5 mins. Samples were then diluted to adjust the urea concentration to 6 m using 50 mm NH4HCO3 and endoproteinase-Lys-C (Wako) was added at an enzyme to substrate ratio of 1:100. Proteolysis with Lys-C was carried out at 37 °C for 6 h. Samples were then diluted with 50 mm NH4HCO3 to achieve a urea concentration of 1.6 m and trypsin was added to an enzyme to substrate ratio of 1:50. Proteolysis with trypsin was allowed to proceed for 18 h at 37 °C.
nUHPLC-MS/MS analysis was performed using a Waters (Milford, MA) NanoAcquity system (maximum pressure 10,000 psi) interfaced to an LTQ-OrbitrapElite hybrid mass spectrometer (Thermo Fisher Scientific, Bremen, Germany). Acidified Lys-C/trypsin double-digested samples (2 μg in 0.1% (v/v) TFA) were loaded onto a Waters 2G-V/M C18 Symmetry trap (5 μm particle size, 180 μm x 20 mm) at 15 μl/min in 99% solvent A (0.1% (v/v) aqueous formic acid) and 1% solvent B (100% (v/v) CH3CN containing 0.1% (v/v) formic acid) for 3 min and the peptides were subsequently separated in-line using a pre-equilibrated analytical column (Waters C18 BEH 130 Å, 1.7 μm particle size, 75 μm × 200 μm) at a flow rate of 0.3 μl/min and temperature of 35 °C. The analytical column was washed for 5 min at 2% (v/v) B and subsequently subjected to a set of three linear gradients of: up to 27% solvent B over 240 min; up to 40% solvent B over 25 min; and, to 95% solvent B over 5 min, after that the column was held at 95% B for 7 min. The LTQ-OrbitrapElite was equipped with a nanospray Flex ion source (Thermo Fisher Scientific, Bremen, Germany) containing a 10 μm-inner diameter standard coated SilicaTipTM emitters (New Objective). Spray voltages were between 1.5 and 1.9 kV and no sheath, sweep or auxiliary gases were used. The LTQ-OrbitrapElite was operated in a data-dependent mode to automatically switch between Orbitrap-MS and ion trap-MS/MS acquisition. After accumulation to a target value of 1,000,000 charges in the linear ion trap, survey full scan MS spectra (from m/z 380–1700) were acquired in the Orbitrap with resolution r = 120,000 at m/z 400. Depending on the signal intensity, up to 20 most intense ions were sequentially isolated, fragmented and recorded in the linear ion trap using collision induced dissociation at a target value of 5000 charges. For accurate mass measurements the lock mass option was enabled in MS mode and the polydimethylcyclosiloxane ions (protonated Si(CH3)2O6; m/z = 445.120025 from ambient air) were used for real time internal recalibration. General mass spectrometric conditions were: ion transfer tube temperature, 285 °C; ion selection threshold, 500 counts; activation, q = 0.25; activation time, 10 ms for MS/MS; repeat count, 1; repeat duration, 30 s; exclusion list size, 500; exclusion duration, 90 s; and, S-lens RF level, 55%. Maximum ion injection times were 200 ms for survey full scans and 50 ms for MS/MS.
Protein Identification and Quantification
For label-free quantification, MaxQuant (version 1.3.0.5 (33)) was used to generate peak lists from the 240 .RAW files (Xcalibur, ThermoFisher Scientific) resulting from the in-solution IEF-based analyses of cell lysates (Fig. 1A). Andromeda (34) was used to search the complete proteome set for Homo sapiens and hRSV A2 strains (87,636 canonical and proteoform sequences downloaded from www.uniprot.org on 21 February 2013). Reverse sequences and 247 contaminants (33) were also searched. The precursor and fragment ion mass tolerances were set to 20 ppm and 0.5 Da, respectively, for the first search. The precursor ion mass tolerance was reduced to 6 ppm for the subsequent main database search. Enzyme specificity was set to trypsin/P, allowing a maximum of two missed cleavages. Carboxamidomethyl-cysteine was specified as a fixed modification, whereas acetylation of protein N termini, deamidation of asparagine/glutamine, and oxidation of methionine were specified as variable modifications. The minimum peptide length and maximum charge were both set to seven. Only one peptide was allowed for each MS/MS spectrum. A retention time alignment window of 2 mins was specified. Fractions belonging to the same in-solution protein IEF experiment were not combined. For identification, a peptide posterior error probability (PEP) threshold of 0.05 was specified and a peptide level false discovery rate (FDR) threshold of 0.001 was applied. The protein level FDR threshold was set to 0.01. Default settings were applied for all other parameters.
Quantification by spectral counting and peak intensities was used to examine the relative abundance of protein groups in infected compared with mock samples. The protein groups assembled by MaxQuant were consistent with an established nomenclature (35), where, if the set of peptides matching a protein sequence is equal to or contained within the set of peptides matching another protein sequence, these proteins were reported by MaxQuant as a single protein group. The MaxQuant protein groups were further collapsed in a gene-centric manner such that protein sequences arising from the same gene were quantified as a single protein group. As such, differences in abundance were expected to reflect the net difference over all gene products. Only peptides matching exactly one protein group were used in the quantitative analysis.
For quantification by spectral counting, the number of MS/MS spectra matching each protein group in each fraction was extracted from the MaxQuant results file, “evidence.txt.” Normalization scale factors were estimated for the fraction level counts according to a previously described procedure (36). Only protein groups with no zero counts in any replicate were used to estimate the normalization scale factors (37). Normalization was applied by dividing the observed counts by the appropriate scale factor. The sample level abundance for each protein group was estimated as the sum of the normalized counts of all 24 IEF fractions for each lysate. Protein groups observed in at least three replicates of mock or infected were retained for differential analysis. EdgeR (version 2.6.10 (38–40)) with R (version 2.15.1 (41)) was used to test for differential abundance using a paired experiment design with sample type and batch as blocking factors. The Cox-Reid method was used to estimate the tagwise dispersions (with prior.n set to one) and the generalized linear model likelihood ratio test was used to estimate p values. The Benjamini and Hochberg adjustment (42) was applied to control the FDR. A FDR threshold of 1% was chosen to specify differential abundance.
Quantification using peak intensities was performed by extracting the intensity values reported by MaxQuant for each aligned peptide feature in each IEF fraction. To qualify for alignment, peptide intensity features required the support of at least one confident MS/MS spectrum. The peptide intensities were normalized at the fraction level using the procedure described above and the relative abundance for each protein group was estimated as the sum of the normalized peptide intensities of all 24 IEF fractions for each lysate. Protein groups observed in at least three replicates of mock- or hRSV-infected lysates were retained for differential analysis. Before testing for differential abundance, a generalized logarithm transformation was applied to the intensity values to stabilize the variance across the full intensity range (43, 44), where the variance-stabilizing normalization package (VSN; version 3.24.0 (43)) was used to estimate the transformation parameters. Limma (version 3.12.1 (45, 46) with R version 2.15.1 (41)) was used to test the VSN-transformed data for differential abundance using a moderated paired t test with sample type and batch as blocking factors. The Benjamini and Hochberg adjustment (42) was applied to control the FDR. A FDR threshold of 1% was chosen to specify differential abundance.
MaxQuant analysis was repeated using the same parameters for the eight .RAW files resulting from the direct analyses of digests of unfractionated lysates (Fig. 1B). Quantification and differential analysis were performed as per the method described for the in-solution protein IEF workflow. In addition, the relative abundances of the viral proteins were estimated using the top3 method in which the average intensities of the three most intense peptide ions for each protein were calculated and used as a reflection of relative abundances (47).
Protein groups with significant differences in abundance at a FDR of equal to or less than 1% were visualized as a heat map. The heat maps were generated in R (version 2.15.1 (41)) and visualized using heatmap.2 in the gplots package (version 2.11.0 (48)). Protein groups were clustered using hierarchical clustering with Euclidean distance and average linkage.
Bioinformatics
Gene Ontology (GO) cellular component annotations (49) were used to determine subcellular locations represented by identified protein groups. The generic GO Slim (50) annotations for human were downloaded using QuickGO (51) on 4 April 2013. A custom GO Slim consisting of the following 13 terms was specified to achieve broad coverage of the cellular components: nucleus (GO:0005634), cytoplasm (GO:0005737), endoplasmic reticulum (GO:0005783), chromosome (GO:0005694), cytoskeleton (GO:0005856), endosome (GO:0005768), extracellular region (GO:0005576), Golgi apparatus (GO:0005794), lysosome (GO:0005764), mitochondrion (GO:0005739), peroxisome (GO:0005777), plasma membrane (GO:0005886), and ribosome (GO:0005840). Both manually curated and electronic annotations were included in the analysis (i.e. all evidence codes were used). Annotation was performed using Uniprot accession numbers for the identified protein groups. The frequency of each cellular component was calculated as the number of protein groups with the annotation; where a protein group had more than one annotation, the annotations were apportioned so the sum over the annotations for the group was equal to one. Viral proteins and protein groups identified as potential contaminants were excluded from the analysis.
The minimal list of Uniprot accession numbers corresponding to the protein groups with significant differences in abundance between mock- and hRSV-infected samples were analyzed using Ingenuity Pathway Analysis (IPA build 242990, release date 2013-05-13; www.ingenuity.com). In addition to the protein identifiers, the direction of regulation for each protein group was also submitted to IPA (where greater and lesser abundances in hRSV-infected and mock-infected lysates were represented as 1 and −1, respectively). Viral proteins and protein groups identified as potential contaminants were excluded from the analysis. The IPA Core Analysis with default parameters was used to generate molecular networks from the IPA Knowledge Base, to identify curated pathways containing the molecules of interest and to identify upstream regulators of the differentially abundant proteins. The search parameters were as follows: the reference was set to “IPA Knowledge Base (genes only),” the confidence parameter was set to “Experimentally Observed,” both direct and indirect relationships were included, all data sources, all species, all tissues/cell lines and all mutations were searched. Interaction networks with a maximum of 35 molecules were generated.
Gene symbols corresponding to protein groups with significant differences in abundance were also analyzed using Interferome (v2.0 (52)). Default parameters were used. That is, at least a twofold change was required, all IFN types were searched allowing any treatment time/concentration, all species, in vitro and in vivo experiments and all systems/organs/cells/cell lines.
Results from the IPA Upstream Regulator Analysis and the Interferome search were combined and represented as a network. Regulatory molecules included in the network were type I, type II and type III IFN, NF-kB, and TNF-α. The network was visualized using Cytoscape (v3.0.2 (53)).
Cytokine Treatment of A549 Cells
Two million A549 cells were treated in T25 flasks for 24 h with the levels of cytokines specified in the results section. IFNs-α (IFN-α2a) and -β (IFN-β1a) were obtained from Hoffman La Roche (Basel, Switzerland) and PBL Interferon Source (Piscataway, New Jersey), respectively. IFNs-γ (IFN-γ) and –λ (IFN-λ1 or interleukin 29) and TNF-α were obtained from R&D Systems (Minneapolis, MN). A detailed description of the specific conditions used for these treatments and the posttreatment processing of these samples have been described previously (24).
Western blot Analysis
Unfractionated A549 cell lysates were subjected to 1D-SDS-PAGE and Western blotting essentially as described previously (24). Minor variation from the performed previously described Western blotting protocols involved measurement of β-Actin integrated intensity to demonstrate equality of loading. Primary antibodies for mitochondrial Mn Superoxide Dismutase 2 (SOD2) and IFN-induced protein with tetracopeptide repeats 3 (IFIT3), and secondary antibodies were as described previously (24). Rabbit primary antibodies to NF-κB2, protein-glutamine gamma-glutamyltransferase 2 (TGM2), and tryptophan-tRNA synthetase (WARS) were purchased from Abcam (Cambridge, UK), IFN-induced GTP-binding protein (MxA) antibody was from Sigma Aldrich (St Louis, MO), and IFN-induced 17 kDa protein (ISG15) was from Cell Signaling Technology (Danvers, MA).
RESULTS
Quantification of Protein Groups in Mock and hRSV Infected A549 Cells
In the in-solution protein IEF workflow described above (Fig. 1A), equal quantities of protein (1 mg) from ten lysates derived from five independent biological replicate sets of mock- and hRSV-infected A549 cells were each prefractionated into 24 fractions on a protein level by in-solution IEF prior to tryptic digestion of each fraction and CapHPLC-LTQ-OrbitrapXL analysis. MaxQuant processing of the 240 analyses resulted in the acceptance of 521801 peptide-spectrum matches, which corresponded to 28,895 peptide sequences (PEP threshold of 0.05 and peptide FDR of 0.001) and 3496 protein groups (at least one unique peptide and protein FDR of 0.01) where protein groups were defined according to the protein inference nomenclature (35). Combining protein groups further using a gene-centric approach gave a total of 3412 protein groups, of which 76 had MS/MS evidence supporting two or more proteoform sequences. Finally, requiring that protein groups were reliably observed (i.e. identified in at least three replicates in mock or infected), 2613 protein groups were quantified by spectral counting and 3247 protein groups were quantified using peak intensities (Fig. 2A; supplemental Table S1). This requirement resulted in the difference between the numbers of protein groups being reliably identified with a FDR of 0.01 and those of this number (supplemental Table S1, column C) qualifying for consideration as being differentially abundant according to the differential abundance FDRs listed in column AC of supplemental Table S1.
Fig. 2.
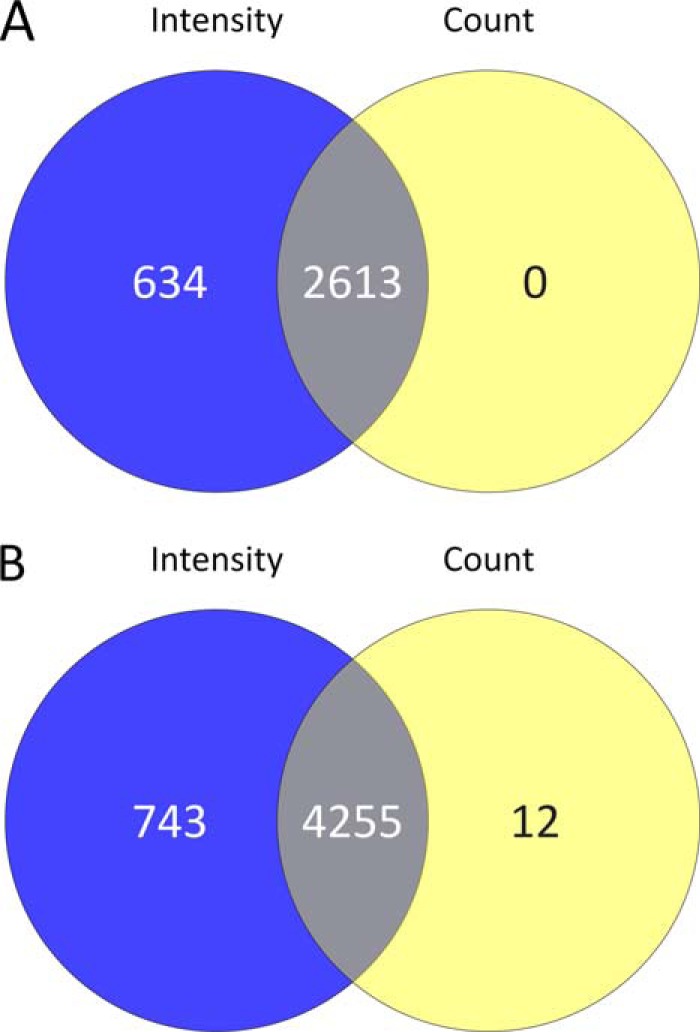
Venn diagram comparisons of protein groups quantified in hRSV infected A549 cells at a global level: A, in-solution protein IEF and B, protein fractionation-free workflow datasets using both intensity (blue circle) and spectral count (yellow circle) based methods. The overlapping intersections represent protein groups quantified by both methods.
The majority of quantified groups were quantified by both intensity and spectral count data. Approximately 20% (i.e. 634) of the overall number of quantified groups were uniquely quantified by intensity-based measurements (Fig. 2A; supplemental Table S1). However, no proteins were uniquely quantified by spectral counting (Fig. 2A). The unique quantification of protein groups using intensity-based measurements probably reflects the use of elution time alignment of precursor ion masses across replicates where the precursor must be observed in at least three replicates, however, only one of the precursors was required to have provided a confident identification by MS/MS. By comparison, a stringent MS/MS spectral match was required in at least three replicates to be quantified by spectral counting.
MaxQuant analysis of the data obtained with the four independent sets of mock and infected cell lysates that were digested without preliminary protein fractionation and analyzed by nUHPLC-LTQ-OrbitrapElite-MS/MS resulted in the identification and quantification of many more proteins. Overall 274,166 peptide-spectrum matches were accepted, corresponding to 42,312 peptide sequences and 5246 protein groups. A total of 5010 protein groups were quantified using the same filters and constraints described above (Fig. 2B; supplemental Table S2). As with the workflow based on in-solution protein IEF, most protein groups were quantified using both intensity and spectral count approaches (Figs. 2A and 2B) and a substantial number of unique quantifications (∼14.8% of the total quantifications) were from intensity measurements, however, some unique quantifications (∼0.24% of the total quantifications) were achieved using spectral counts in this workflow. Another common feature between the two approaches was that the majority of the protein groups were quantified based on two or more unique peptides (supplemental Figs. S1A and S1C) compared with one distinct peptide only (supplemental Figs. S1B and S1D). Spectra for peptides that were used for single unique peptide-based protein identifications are presented in supplemental Figs. S2–S5.
To determine if the workflows provided biased or broad sampling of subcellular compartments, the frequency of GO cellular component annotations were examined. Resultant subcellular distributions of the quantified proteins indicated that proteins were sampled from a broad range of cellular compartments using both the in-solution protein IEF and protein fractionation-free workflows, including the cytoplasm, nucleus and plasma membrane (Fig. 3A). In keeping with the greater number of protein groups quantified overall by the protein fractionation-free workflow (Fig. 2), more protein groups were evident in each subcellular fraction using this workflow (Fig. 3A). However, the general trend of distributions was the same for both workflows (Fig. 3A).
Fig. 3.

Subcellular distributions of protein groups: A, quantified; and, B, found to be regulated using a FDR cutoff of less than 1% in in-solution protein IEF (black bars) and protein fractionation-free (gray bars) workflow datasets.
Relative Abundances of Viral Proteins in hRSV Infected A549 Cells
Viral phospho- (P), nucleocapsid- (N), M2–1, matrix (M), fusion (F), major surface glycoprotein (G), polymerase (L), and nonstructural (NS1 and NS2) proteins were detected and quantified only in lysates of the hRSV-infected cells using both workflows (supplemental Tables S1–S3). In the in-solution protein IEF-based workflow P, N, M2-1, M, F, NS1, and NS2 were identified as differentially abundant by spectral counting and all but NS2 by peak intensities (FDR < 0.01). Similarly, in the protein fractionation-free workflow P, N, M2-1, M, F, NS1, NS2, G, and L were identified as differentially abundant by both spectral counting and peak intensities. These proteins were detected over a wide dynamic range of spectral counts in both the in-solution protein IEF and protein fractionation-free workflows (supplemental Tables S1 and S2).
The top3 method was applied to data from the protein fractionation-free workflow to estimate the relative abundances of the viral proteins in infected cells (Fig. 4A). These results suggest that P, N, and M are the most abundant proteins followed closely by F, M2-1, and NS1 and that NS2, G, and L are comparatively low in abundance (Fig. 4B). However, the ranking of NS1, NS2, and G may have been affected by detection of insufficient ions for these proteins.
Fig. 4.

Relative abundances of viral proteins in hRSV infected cells estimated by the top3 method: A, top3 calculations for each hRSV protein detected in infected A549 cells for the four replicates analyzed by the protein fractionation-free workflow with each top3 value expressed as a proportion of the total top3 values for all proteins calculated for the respective replicates; B, the order of relative abundances apparent from the plot above with the average numbers of tryptic peptides unique to each identified protein in the four analyses performed presented in parentheses; and, C, the coding order of the hRSV genome from which the genes are transcribed with a polarity of decreasing efficiency from 3′ to 5′ termini, implying a corresponding polarity in protein abundances.
Regulation of the A549 Cellular Proteome by hRSV Infection
Differential abundance was evident for ∼3.5% of the 3247 protein groups quantified using the in-solution protein IEF-based workflow. This reflected differential abundance of 114 protein groups when mock- and hRSV-infected A549 cell lysates were compared using a 1% FDR cut-off threshold and regulation by intensity- and spectral count-based measurements were combined (Fig. 5A). Approximately 39% (44 of 114 protein groups) of this differential regulation was apparent by both intensity- and spectral count-based quantification (Fig. 5A). The fraction of protein group regulation uniquely observed by spectral count-based quantification (61 of 114 protein groups or ∼54%) was almost 6.8 times that of uniquely observed by the intensity-based method (Fig. 5A). The vast majority of the 114 regulated protein groups were more abundant in lysates of infected cells regardless of whether the regulation was assessed by intensity- or spectral count-based measurements (Fig. 5B–5E). Almost the same fraction of overall protein regulation observed in common by intensity- and spectral count-based measurements (44 protein groups or ∼39% of 114 regulated protein groups; Fig 5A) appeared in the protein groups that were more abundant in hRSV-infected cells as determined by both methods (44 protein groups or ∼43% of 102 up-regulated protein groups; Figs. 5D). There was no overlap in the less abundant protein groups detected by the two methods (Fig. 5E). Spectral count-based quantification revealed a larger number of more (Fig. 5D) and less (Fig. 5E) abundant protein groups from hRSV- compared with mock-infected cell lysates than intensity-based quantification (Fig. 5B and 5C).
Fig. 5.

Protein groups evident as being regulated by analysis of in-solution protein IEF workflow datasets: A, comparison of spectral count (yellow circles) and intensity (blue circles) based quantification for identifying overall regulation observed using a FDR cut-off of less than 1%; MA plots showing significantly regulated protein groups in the B, spectral count and C, intensity data as black dots; and, distribution of protein groups observed to be D, up-regulated and E, down-regulated in hRSV- compared with mock-infected A549 cells by spectral counts (yellow circle) and intensity (blue circle) measurements with the overlapping intersections representing protein groups evident as significantly different by both methods.
Evaluation of the data from the protein fractionation-free workflow revealed a larger number of regulated protein groups (149) that exhibited differential regulation (Fig. 6A; supplemental Table S2), however, this represented a slightly lower percentage regulation (∼3%) of overall quantified protein groups than observed using the in-solution protein IEF-based workflow. As with the in-solution protein IEF -based workflow, there was a marked bias observed toward up-regulation of protein groups in infected cells using the protein fractionation-free workflow (Fig. 6B–6E).
Fig. 6.

Protein groups evident as being regulated by analysis of protein fractionation-free workflow datasets: A, comparison of spectral count (yelow circles) and intensity (blue circles) based quantification for identifying overall regulation observed using a FDR cut-off of less than 1%; MA plots showing significantly regulated protein groups in the B, spectral count and C, intensity data as black dots; and, distribution of protein groups observed to be D, up-regulated and E, down-regulated in hRSV- compared with mock-infected A549 cells by spectral counts (yellow circle) and intensity (blue circle) measurements with the overlapping intersections representing protein groups evident as significantly different by both methods.
The number of protein groups shown to be regulated in common by both workflows was very similar to the number shown to be regulated uniquely by the in-solution protein IEF workflow but a substantially larger number of protein groups were shown to be uniquely regulated by the protein fractionation-free workflow (Fig. 7A; supplemental Table S3). The datasets obtained using the two workflows were also distinguishable in terms of a bias in regulation observed using spectral count-based quantification in the in-solution protein IEF -based workflow (Fig. 7B) compared with a bias in regulation observed by intensity-based quantification using the protein fractionation-free workflow (Fig. 7B).
Fig. 7.
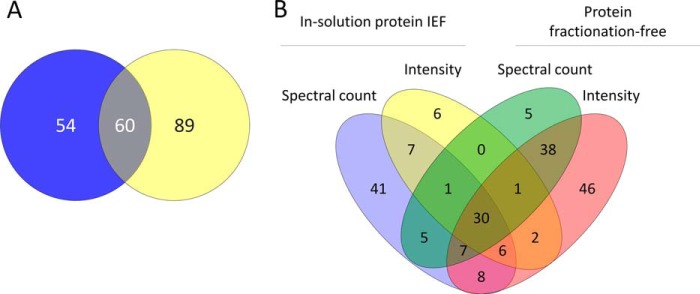
Workflow specific aspects of protein group regulation: A, Comparison of protein groups identified as being regulated using a FDR cut-off of less than 1% uniquely by in-solution protein IEF (blue circle) or protein fractionation-free (yellow circle) workflows or in common by both workflows; (intersection); and, B, breakdown of the data presented in A to depict the contributions of spectral count and intensity data to the assessment of regulation in both workflows.
Heat map depiction of the abundances of the protein groups statistically significantly regulated with a FDR of less than 1% indicated that over half of the regulated protein groups are induced from very low basal levels or undetected in mock- compared with hRSV-infected cells (Fig. 8). This was evident regardless of the workflow that was used to assess regulation. As noted above, regulation was more evident by spectral counting (Fig. 8A) than by intensity (Fig. 8B) measurements obtained using the in-solution protein IEF-based workflow. The opposite was evident for the protein prefractionation workflow in which spectral counting measurements (Fig. 8C) were less effective than intensity measurements (Fig. 8D) at exposing regulation.
Fig. 8.

Heat map depiction of protein groups evident as being regulated because of hRSV infection of A549 cells. Protein groups were selected for presentation using a FDR cut-off of less than 1% using in-solution protein IEF-based A, spectral count and B, intensity measurements or using protein fractionation-free based C, spectral count and D, intensity measurements.
The subcellular distributions of the statistically significantly regulated protein groups (Fig. 3B) were similar to those observed for the total quantified protein groups (Fig. 3A). The exception being that the mitochondrion was less well represented in the regulated protein groups (Fig. 3B) than was evident for the quantified protein groups overall (Fig. 3A). The same workflow-based quantitative trends were apparent for assignment of regulated protein groups to subcellular fractions (Fig. 3B) as observed for the distributions of all quantified protein groups (Fig. 3A).
Host Cell Pathways Regulated by hRSV Infection of A549 Cells
Of the 203 protein groups identified as differentially abundant between hRSV- and mock-infected A549 cells, 191 were cellular in origin. The remaining twelve protein groups were viral proteins (nine protein groups) and contaminants (three protein groups). The minimal list of Uniprot accession numbers corresponding to the 191 cellular protein groups were submitted to IPA. One hundred and eighty-six protein groups mapped to exactly one gene name in the IPA Knowledge Base. Four protein groups mapped to exactly two gene names and one protein group did not map to any gene name in the IPA Knowledge Base. The unmapped protein group consisted of one member P62805 (Histone H4). For simplicity, we use the term “protein” below in this section to refer to the IPA mapped protein groups. The IPA Core Analysis was used to generate molecular networks from the IPA Knowledge Base and to identify canonical pathways enriched for proteins that were regulated by hRSV infection. The top ranking molecular networks generated by IPA were associated with (1) cell death and survival, developmental disorder, and heredity disease, and (2) antimicrobial response, inflammatory response, and inflammatory disease (supplemental Table S4). The canonical pathways reported to have been regulated as a consequence of infection reflected induction of several antiviral response pathways consistent with the top network matches reported above. In order of statistical significance the top canonical pathways reported were, (1) antigen presentation, (2) interferon signaling (encompassing both type I and type II IFNs), (3) role of pattern recognition receptors in recognition of bacteria and viruses, (4) protein ubiquitination, and (5) activation of IFN-regulatory factor (IRF) by cytosolic pattern recognition receptors (supplemental Table S4; supplemental Fig. S6A–6E).
In keeping with the canonical pathways highlighted above, cytokines such as IFNs and TNF-α and transcriptional regulators of pathways activated by these cytokines were predicted to be key upstream regulators of the impacts of hRSV on A549 cells (Table I; supplemental Table S5). Surprisingly, given the epithelial cell context of these observations, the top ranking upstream regulatory molecule reported by IPA was IFN-γ (Table I; supplemental Tables S4 and S5). Of the 83 proteins with evidence of IFN-γ regulation in IPA Knowledge Base, 80 were regulated in the direction predicted from previous literature observations (Table I; supplemental Tables S4 and S5). The next most highly ranked key upstream regulatory cytokine was IFN-A2, with 45 out of 46 regulated proteins exhibiting the previously reported regulation direction (supplemental Table S5). This was followed by IFN-λ1, for which all 33 regulated proteins exhibited the reported regulation direction (Table I; supplemental Tables S4 and S5). TNF-α was the next most highly ranked cytokine to feature as a key upstream regulator, with 72 out of 82 regulated proteins exhibiting the reported regulation direction (Table I; supplemental Tables S4 and S5). IFN-β1 was much further down the list of key upstream regulators, with 20 out of 26 regulated proteins exhibiting reported regulation direction (Table I; supplemental Tables S4 and S5). Other key upstream regulators involved in IFN responses that were also highly ranked included IRF7, signal transducer and activator of transcription (Stat)3, IRF1, Stat1, IFN-β1, IRF3, and IRF2 (Supplemental Table S5).
Table I. Summary of rankings assigned to IFNs and TNF-α in IPA reports of upstream regulators of significance in A549 cell responses to hRSV infection.
| Cytokine | Features |
Representative target moleculesc | |
|---|---|---|---|
| Rankinga | Conformityb | ||
| IFNG | 1 | 80 of 83 | DDX58, IFIT1, IFIT2, IFIT3, ISG15, ISG20, MX1, PSMB9, SAMHD1, WARS |
| IFNA2 | 3 | 45 of 46 | DDX58, IFIT1, IFIT2, IFIT3, ISG15, ISG20, MX1, SAMHD1 |
| IFNL1 | 4 | 33 of 33 | DDX58, IFIT1, IFIT2, IFIT3, ISG15, ISG20, MX1, PSMB9 |
| IFN alpha | 8 | 40 of 47 | DDX58, IFIT1, IFIT2, IFIT3, ISG15, ISG20, MX1, PSMB9, WARS |
| TNF | 9 | 72 of 82 | DDX58, IFIT1, IFIT3, ISG15, MX1, PSMB9 |
| IFNB1 | 26 | 20 of 26 | DDX58, IFIT1, IFIT2, IFIT3, ISG15, MX1 |
a Order of appearance in the list of upstream regulators reported by IPA.
b Indicates the number of regulated protein group associated gene names which conformed to the direction of regulation predicted by IPA.
c Subset of the target molecules reported by IPA.
Of the 191 cellular protein groups identified as being regulated in response to hRSV infection, 159 or 83% have evidence of regulation by IFNs, TNF-α, and/or NF-κB according to the IPA Knowledge Base and the Interferome database (Fig. 9; Supplemental Table 6). This analysis revealed that type I IFNs were implicated with regulation of 130 or ∼68% of the infection-regulated protein groups. Of these, 23 or ∼12% of the infection-regulated protein groups were uniquely linked to type I IFN regulation. IFN-γ was implicated with regulation of 124 or ∼65% of the infection-regulated protein groups. Of the protein groups linked to IFN-γ regulation using database analyses, only seven were uniquely linked to IFN-γ regulation. These protein groups were CYP24A1, HLTF, SLC12A2, CTSL1, MYOF, HNRNPU, and SH3KBP1 (Fig. 9; supplemental Table S6). Interestingly, WARS ranked highly in the lists of host cell protein groups that were statistically significantly regulated as a consequence of hRSV infection of A549 cells regardless of the analytical workflow used for data acquisition (supplemental Tables S1 and S2).
Fig. 9.

Relationships between protein groups regulated by hRSV infection of A549 cells and potentially involved key regulators. Protein groups found to be regulated using a FDR cut-off of less than 1% were used to interrogate IPA and Interferome for evidence of regulation by IFNs, TNF-α, and/or NF-κB. Protein groups are displayed as triangular nodes with apices oriented upwards or downwards according to whether they were up- or down-regulated in infected cells, respectively. Nodes are colored using the displayed color coding system to indicate the potential influences of individual or multiple key regulators as indicated by IPA and/or Interferome. Central key regulator nodes are represented as circles. The protein groups falling into each category of regulation are presented numerically within each node and specifically identified in Supplemental Table 6.
Type III or IFN-λs were only implicated with regulation of 40 or ∼21% of the infection-regulated protein groups but none of these were uniquely linked to IFN-λ regulation (Fig. 9; supplemental Table S6).
TNF-α was reported to have been implicated with regulation of 82 or ∼43% of the infection-regulated protein groups but IFNs were also implicated with regulation of 71 of these and NF-κB with 30. Only nine of the infection-regulated protein groups were uniquely linked to TNF-α signaling independently of NF-κB. These were HPGD, SERPINB8, PTPN12, P4HB, LAMB3, ITGA2, DCD, BCL10, and ABCC1 (Fig. 9; supplemental Table S6).
Immunochemical Assessment of Specific Cytokine Signaling Pathway Induction in A549 Cells by hRSV
The bioinformatic analyses described above suggested that IFN-γ may play a role in the response of A549 cells to hRSV infection. Furthermore, these analyses suggested a specific involvement for TNF-α in responses to hRSV. These possibilities were further investigated by using quantitative Western blotting to measure the levels of various infection-regulated protein groups in hRSV-infected and cytokine-stimulated A549 cells.
WARS has been reported to be up-regulated substantially after 5 h and 24 h treatment of epithelial cells with IFN-γ (24, 54), supporting the possibility of induction of IFN-γ responses in hRSV-infected A549 cells. However, WARS was also reported to have been up-regulated by IFN-α at the 5 h time point but not after 24 h of IFN-α treatment (54). Thus, WARS was subjected to quantitative analysis because of the possibility that it may have represented an effect of hRSV infection via IFN-γ signaling. Global fold changes of between 2.8 and 8.9 were obtained for WARS using the various proteomic workflows applied to hRSV-infected A549 cells (supplemental Tables S1 and S2). By comparison the fold change found to be caused by hRSV infection by Western blotting quantification was 3.5 (Fig. 10; Table II; supplemental Fig. 7A).
Fig. 10.

Western blot quantification of selected proteins evident as having been regulated in hRSV-infected A549 cells using both in-solution protein IEF and protein fractionation-free workflows. Equal quantities of protein from lysates of mock- or hRSV-infected A549 cells were analyzed by Western blotting for the indicated proteins. All proteins analyzed were found to be regulated within a FDR cutoff of less than 1% by all label-free mass spectrometry workflows. Four independent sets of infected samples were analyzed in triplicate. Integrated intensities are presented as the mean ± S.E. (n = 4). Statistical significance was determined using a one-way ANOVA with Dunnetts correction. † and § denote a statistically significant difference from mock at p < 0.01 and p < 0.0001, respectively. Raw Western blots are presented for one biological replicate in supplemental Fig. S7A as an overall representation of the data used in this quantitative analysis.
Table II. Fold changes evident in hRSV infected or cytokine treated A549 cells determined by quantitative Western blot analysis.
| Treatment | Protein groups |
||||||
|---|---|---|---|---|---|---|---|
| WARS | MxA | IFIT3 | ISG15 | SOD2 | TGM2 | NF-κB2 | |
| Infection | 3.5 | 361.9 | 124.4 | 52.6 | 2.9 | 3.1 | 4.7 |
| IFN-αA2 | NRa | 27.5 | 421.8 | 65.7 | NR | 3.5 | NR |
| IFN-β1 | 2.1 | 42.3 | 378.5 | 54.2 | NR | 5.8 | NR |
| IFN-γ | 3.6 | NR | 175.3 | NR | 1.6 | 6.1 | NR |
| IFN-λ1 | NR | NR | NR | NR | NR | NR | NR |
| TNF-α | NR | NR | NR | NR | 4.4 | NR | 4.6 |
a NR indicates lack of statistically significant regulation at p < 0.05.
Western blot analysis of cytokine treated A549 cells revealed a 3.6-fold induction of WARS by IFN-γ treatment (Fig. 11; Table II; Supplemental Fig. S7B), which was almost identical to that revealed because of infection using this technique. However, a 2.1-fold induction of WARS by IFN-β was also revealed by Western blot analysis (Fig. 11; Table II; supplemental Fig. S7B) but none of the other cytokines tested were found to induce WARS in A549 cells under the experimental condition employed. This lower level induction of WARS at the protein level by IFN-β has been reported previously (24). Furthermore, type-I IFN induction of WARS based on mRNA levels in epithelial cells was trivial compared with that induced by IFN-γ (54).
Fig. 11.

Cytokine induction of selected proteins evident as regulated by hRSV infection of A549 cells. A549 cells were incubated for 24 h in the presence or absence of IFN-α2A (500 U/ml), IFN-β1 (5000 U/ml), IFN-γ (100 ng/ml), IFN-λ1 (10 ng/ml), TNF-α (20 ng/ml) or media. Equal quantities of protein from lysates of each treatment were probed by Western blotting using antibodies for the indicated proteins. All proteins analyzed were found to be regulated by hRSV infection within a FDR cut-off of less than 1% by all label-free mass spectrometry workflows. Four independent replicate sets of treatments were analyzed in triplicate on separate membranes. Each membrane had a triplicate set of loading control samples that were used for normalization of data for each antibody probe. Normalized integrated intensities are presented as the mean ± S.E. (n = 4). Statistical significance was determined using a one-way ANOVA with Dunnetts correction. *, ‡ and § denote a statistically significant difference from mock at p < 0.05, p < 0.001 and p < 0.0001, respectively. Raw Western blots are presented for one biological replicate in supplemental Fig. S7B as an overall representation of the data used in this quantitative analysis.
The upstream regulator analysis implicated IFN-γ as a regulator of proteins in common with TNF-α as well as type I and type III IFNs (Fig. 9; supplemental Table S6). However, Western blotting of A549 cells exposed to these various cytokines indicated that the very pronounced induction of MxA observed in the present study with hRSV-infected A549 cells (Fig. 10; Table II; supplemental Fig. S7A) is likely to be limited to type I IFN induction as induction of MxA in cytokine treated cells by IFN-α and -β was apparent but induction by IFN-λ, IFN-γ, and TNF-α was not statistically significant (Fig. 11; Table II; supplemental Fig. S7B). Induction of IFIT3 in IFN-γ treated A549 cells was apparent but not to the same levels as achieved with IFN-α or IFN-β and was not statistically significant with IFN-λ and TNF-α (Fig. 11; Table II; supplemental Fig. S7B). The up-regulation of ISG15 caused by infection was certainly not because of IFN-γ or TNF-α responses as these cytokines failed to induce ISG15 when used to treat A549 cells; IFN-β and IFN-α caused substantial up-regulation (Fig. 11; Table II; supplemental Fig. S7B). IFN-λ was ineffective at inducing ISG15 in cytokine treated A549 cells (Fig. 11; Table II; supplemental Fig. S7B).
One protein, SOD2, observed to have been statistically significantly regulated in hRSV-infected A549 cells in the present study (Fig. 10; Table II; supplemental Fig. S7A) was previously reported to be regulated by IFN-γ (24, 55–57) as well as TNF-α (24, 58–61). In addition, SOD2 was previously reported to have been induced by type I IFNs in one study (62) but not others (24, 57). Another protein, TGM2, observed to have been statistically significantly regulated in hRSV-infected A549 cells in the present study (Fig. 10; Table II; supplemental Fig. S7A) was also previously reported to be regulated by IFN-γ (63, 64). Cytokine treatment of A549 cells revealed that both of these protein groups could be induced by IFN-γ but SOD2 was much more strongly induced by TNF-α and TGM2 was induced to almost equivalent degrees by IFN-β1 and IFN-γ but was not induced by IFN-λ or TNF-α (Fig. 11; Table II; supplemental Fig. S7B).
Eleven of the protein groups found to be regulated in hRSV-infected A549 cells have previously been shown to be linked uniquely to TNF-α induction (Fig. 9; supplemental Table S6). These TNF-α regulated protein groups were NF-κB2, VIM, ABCC1, BCL10, DCD, ITGA2, LAMB3, P4HB, PTPN12, SERPINB8, and HPGD. Of this group of proteins, NF-κB2 had the largest fold change and was the most highly ranked regulated protein group in hRSV-infected A549 cells (Fig. 10; Table II; supplemental Tables S1–S3; supplemental Fig. S7A). Western blot data obtained in the present study confirmed that NF-κB2 was induced to the same level observed in infected A549 cells by exposure of A549 cells to TNF-α but none of the other cytokines tested (Fig. 11; Table II; supplemental Fig. S7B).
DISCUSSION
Host cells elicit responses to viral infections in order to limit replication and spread of progeny virions. On the other hand, viruses usually express gene products to counteract the host cell responses and create an environment conducive to replication and propagation. Understanding host-viral interactions potentially offers a way of identifying targets to exploit in the production of therapeutics to treat viral infections. Human RSV causes serious illness for which antiviral agents and strategies are severely limited. A variety of studies have been conducted in order to gain a better understanding of host-hRSV interactions. Genomic studies have provided a broad impression of host cell responses to hRSV at the transcriptomic level (18–22). However, such studies do not capture host cell responses generated at the post-translational level that may be vital for a productive infection. Proteomic analyses are required to define such post-translational effects.
Various proteomic workflows have been exploited in endeavors to define the impacts of the infection of cultured cells with hRSV (23–29). These varied in analytical complexity from 2D-gel-based methods (23–25, 29) through to more complex HPLC-MS of samples isolated by other electrophoretic methods (24, 26–28). Some studies involved fractionation of cells into nuclear and/or cytoplasmic fractions prior to subsequent protein separation and analysis (23, 25–28). Other studies involved analyses of the whole cell proteome extracts in order to avoid sampling biases because of selective losses of proteins during subcellular fractionation (24, 29). The final analytical steps in all of these studies invariably involved tryptic digestion followed by mass spectrometric identification of proteins detected as regulated by differential gel analysis (23–25, 29) or simultaneous mass spectrometric identification and quantification of regulation (24, 26–28).
Studies involving 2D-gel based methods generally identified fewer proteins as significantly regulated (23–25, 29), however, they have generally been more rigorous than studies that have used mass spectrometric-based quantification (26–28). For example, whereas all 2D gel studies have used independent biological replicates to establish regulation on fold change plus statistical significance criteria (23–25, 29), previous mass spectrometric based quantification studies have not involved the use of independent biological replicates (26–28), presumably because of the large demand on instrument time that would have been involved. The present study addressed the need to use multiple independent biological replicates of hRSV-infected A549 cells in conjunction with mass spectrometric based quantification and attribution of regulation based on the statistical significance criterion of a FDR cutoff.
The in-solution protein IEF-based analytical strategy employed in the present study was an extension of previous work (24) in which cell lysates were fractionated at the protein level prior to digestion and HPLC-MS/MS analysis. Only one previous study has used a comparable approach in which in-solution protein IEF of a cytoplasmic extract of one preparation of hRSV-infected human epithelial type 2 (HEp2) cells was analyzed by LC-MS/MS (28). Apart from the different cell type used in that study, other differences to the present study included pI ranges employed for in-solution IEF, mass spectrometry platforms, database searching approaches, and modes of quantification. The HEp2 study claimed identification of 1352 protein groups on the basis of observation of the protein in two out of three technical replicates of the one biological preparation analyzed. This seems to be a limited number of identifications compared with the 3247 protein groups quantified in the comparable in-solution protein IEF-based workflow of the present study. The studies also differed in terms of proteins considered to be differentially regulated on the basis of spectral counting or precursor intensity measurements in the present study and only precursor ion intensities in the HEp2 study (28). Whereas the present study identified 114 protein groups as being statistically significantly regulated based on a conservative 1% FDR cutoff after taking biological variability into account, the HEp2 study claimed differential regulation of 380 proteins using a fold change cut-off as an indication of biological significance. As the HEp2 data were obtained using only one biological sample it was not possible to consider biological variability in that study. The number of proteins assigned as regulated in the present study would have increased on the basis of a twofold cut-off criterion but this would be at the risk of significantly increasing the number of false positives in the regulated number.
Consistent with other studies that have demonstrated that hRSV impacts upon types I and III IFN induction and signaling (3, 16, 30, 31), the present proteomic analyses identified differential regulation of many IFN-inducible proteins in the comparison of mock- and hRSV-infected A549 cells. Only one IFN-inducible protein, IFIT3, was noted to have been regulated by ∼threefold in the HEp2 study (28). This is very surprising given that at least 148 IFN-inducible protein groups were observed to have been regulated within the 1% FDR criterion based on data from the combined workflows of the present study. This included 75 protein groups reported to be uniquely regulated by IFNs. Furthermore, IFIT3, which was found to have been up-regulated by greater than 82 or 1100-fold after analysis of data from the in-solution protein IEF-based workflow of the present study using spectral count and intensity quantification, respectively. In addition, other IFN-inducible proteins, including the potent antiviral MxA, were at the top of the list of significantly regulated proteins observed in the present study (supplemental Table S1). MxA was above IFIT3 in terms of both statistical significance and fold change (supplemental Table S1). Apart from IFIT3, the HEp2 study focused on 5′-3′ exoribonuclease in terms of biological relevance (28), which was not observed to have been statistically significantly regulated in the present study. On the other hand the IFN-inducible Cytosolic 5′-nucleotidase 3 was found to be statistically significantly regulated in the present study (supplemental Table S1). Another surprising difference between these studies related to Stat1 regulation. Whereas Stat1 was consistently observed to have been up-regulated in the five biological replicates of hRSV-infected A549 cells, with an average fold change difference of greater than eight compared with mock-infected cells using intensity quantification of the in-solution protein IEF-based workflow data from the present study, the HEp2 study reported Stat1 to have been marginally down-regulated as a consequence of hRSV infection. Sample preparation methods differed for the present and the HEp2 studies in that the present results were generated using a lysis regime that produced data from the spectrum of subcellular compartments and the HEp2 study was likely to have been biased toward the cytoplasm. However, this is unlikely to be the explanation for the very marked differences in regulation of the proteins noted above as they have a cytoplasmic distribution.
It was interesting to note that quantification of ∼20% of the protein groups in the in-solution protein IEF-based workflow of the present study was achieved uniquely on an intensity basis and no proteins were quantified uniquely by spectral counting. However, spectral counting uniquely accounted for assignment of ∼54% of the protein groups identified as having been regulated at a FDR of less than 1% and intensity-based quantification only uniquely accounted for ∼8%. Importantly, it is evident that the two methods of quantification contribute to a more comprehensive data set in a complementary fashion. The use of spectral count analyses in the HEp2 study may have revealed a larger number of regulated host cell proteins. However, it is more likely that other technical and biological differences between the studies noted above contributed to the differences.
The impacts of subgroups A (26) and B (27) of hRSV on A549 cells have been analyzed using stable isotope labeling by amino acids in cell culture (SILAC) in conjunction with 1D-SDS-PAGE followed by nanoHPLC-LTQ-OrbitrapXL-MS analysis of in-gel tryptic digests. Both of these studies involved fractionation of cell lysates into nuclear and cytoplasmic fractions prior to SDS-PAGE but neither employed either technical or biological replicates. The subgroup B study identified 904 cellular protein groups (27) and the subgroup A study identified 1140 protein groups (26). Regulation levels of twofold or more were attributed to 112 proteins in the subgroup B study (27) based on intensities of precursor ions. Whereas 431 of 510 proteins in the nuclear proteome of the subgroup A study were reported as downregulated at a twofold level cut-off, only 15 of the 535 cytoplasmic proteins identified were up-regulated at least twofold and only five were down-regulated by at least twofold (26). Some inconsistencies were apparent in relation to the regulation data cited in these two studies. For instance, the classical type I IFN regulated protein MxA was found to be up-regulated 11-fold in the subgroup B study (27) but was not shown to be regulated within the twofold threshold of the subgroup A study (26). The present report using hRSV subgroup A concurs with the earlier subgroup B study in that Stat1 and MxA were found to be up-regulated. However, the magnitudes of up-regulation of greater than eight- and 925-fold for Stat1 and MxA, respectively, observed using intensity quantification of in-solution protein IEF-derived data from the present study was much higher than observed in the subgroup B study. The reason for the very high degree of up-regulation of MxA in the present study relates to the fact that it was not detected in mock-infected cells, as expected for this protein (57). A further contrast with the present study was that the subgroup A and B SILAC-based studies identified a much lower number of IFN-inducible proteins as being regulated, particularly the subgroup A study (26). Neither the subgroup A nor B studies noted IFIT3 as being regulated. These differences may have arisen because of inclusion of subcellular fractionation in the subgroup A and B studies but not the present study or because of the lack of the use of any replicates in the SILAC-based subgroup A and B studies (26, 27).
Of the four 2D-gel-based analyses of the impacts of hRSV on A549 cells (23–25, 29), two involved subcellular fractionation (23, 25) and the other two targeted whole cell lysates (24, 29). Only one of the whole cell lysate studies detected appreciable regulation of IFN-inducible proteins. However, this was only apparent in cells infected with hRSV lacking the NS1 gene and not with wild-type hRSV-infected cells (24). Differential expression of the NS1 protein, which interferes with host cell IFN responses (3, 16, 30, 31), probably accounted for these observations. The other whole cell lysate study, which failed to detect an IFN response, may have been somewhat perturbed by differential two-phase extraction of the lysate to separate nucleic acids from proteins (29). No protein and subcellular fractionation-free proteomic study comparable to the one presented herein has previously been reported in relation to the host cell response to hRSV. Another unique aspect of the present study was the use of both spectral count- and intensity-based modes of quantification in the assessment of the impact of hRSV infection. Combined use of these two modes of quantification increased protein group quantification, both overall and in the regulated context (65, 66). Although 1763 or ∼54% more protein groups were quantified in the protein fractionation-free workflow, this may well have been because of differences in the analytical platforms used in the two workflows. Whereas the in-solution protein IEF-based workflow employed CapHPLC interfaced with an LTQ-OrbitrapXL mass spectrometer, the protein fractionation-free workflow digests were analyzed by nUHPLC interfaced with an LTQ-OrbitrapElite instrument. Furthermore, nUHPLC runs were conducted over considerably longer times than the CapHPLC runs. The protein fractionation-free workflow also resulted in ∼30% more protein groups observed to have been regulated within the 1% FDR cut-off criterion. Another difference between the workflows was that there was a greater emphasis on regulation observed by intensity quantification in the protein fractionation-free workflow. Interestingly, it was observed that regulation of some protein groups was workflow specific (Fig. 7; supplemental Table S3) indicating that the use of both workflows produced a complementary assessment of regulation. However, the protein fractionation-free workflow required much less material and instrument time and may be strongly indicated when sample quantities and/or instrument time are limited.
The detection of viral proteins exclusively in lysates of the nine infected cell replicates provided confidence in the fidelities of both workflows employed herein. Furthermore, the ability to detect and quantify the relative abundances of the viral proteins over a wide dynamic range using intensity based top3 measurements (47) indicated that the workflows were conducive to quantifying infection-driven regulation of host cell proteins over a wide dynamic range. Apart from NS1, NS2, and G, the relative abundances of the viral proteins were essentially as predicted based on the previously documented polarity of efficiency in transcription of the viral genome, which decreases when progressing in a 3′ to 5′ direction (3, 30) along the genome (Fig. 4C). Proteins located at the 3′ terminus of the viral genome, namely P, M, and N, exhibited relative abundances consistent with much more efficient transcription than L at the 5′ extremity of the genome, with M2-1 and F exhibiting intermediate abundances (Fig. 4A and 4B) consistent with their positions in the genome (Fig. 4C). NS1 and NS2 would have been expected to be the most abundant proteins because of the fact that they are derived from the 3′ terminus of the genome (Fig. 4C). However, the failure to detect sufficient peptides for NS1 and NS2 is likely to have invalidated application to the top3 method to these small proteins. NS1 has certainly been observed in abundance previously in hRSV-infected A549 cells (24). The G protein also failed to exhibit the anticipated relative abundance, however, previous studies have shown that it does not produce abundant tryptic peptides (67), probably because of the extensive glycosylation of the protein (3, 14). Post-translational processing may also have caused a degree of perturbation in the observed relative abundances of N, M, and P but this would have been minimal as their relative abundances were clustered in such a way that indicated their close juxtapositions to the 3′ proximal end of the hRSV genome.
Taken together, the considerations above indicate that the workflows employed herein have provided a truly unbiased and more comprehensive overall evaluation of the host cell response to hRSV than any previous proteomic attempt. It is evident that quantification without the use of subcellular fractionation is likely to avoid potential biases associated with selective protein losses during cellular fractionation. On the other hand, analysis of cytoplasmic and nuclear fractions of infected cells is likely to be more informative in relation to redistribution of cellular components in response to infection. In all cases, multiple independent biological replicates should be used in order to minimize artifacts caused by biological variability. The present finding of 203 protein groups regulated with a FDR of less than 1% is in excess of the 108 genes shown to be differentially regulated in hRSV-infected A549 cells at 24 h postinfection using the same FDR with a transcriptomic approach (19). A much larger number of genes were found to be up-regulated in hRSV-infected mice tissues with a FDR of 0.8% (584 genes) in another transcriptomics study (18). Other transcriptomic studies in hRSV-infected BEAS cells (20) or A549 cells (22) detected 497 and 796 regulated genes, respectively, but without reference to a comparable FDR. As with the present proteomic results all of the transcriptomic studies found a bias toward infection-induced up-regulation over down-regulation, but to varying degrees. It is evident that in addition to the comprehensive characterization of quantitative changes of the A549 cell proteome accompanying hRSV infection of A549 cells, specific pathways previously shown to be impacted by hRSV were also found to be affected using the workflows employed herein. As discussed above, an anticipated type I and type III IFN responses were found to have been mounted by these cells in the present study. However, the type II IFN-γ was reported as the top ranked upstream regulator of the statistically significantly regulated protein groups submitted to IPA. Of the 83 regulated protein group associated gene names reported to involve IFN-γ regulation 80 were regulated in a manner consistent with expectations based on literature reports in IPA. In support of the concept that A549 cells respond in an IFN-γ-dependent manner to hRSV infection was the finding that WARS was a significantly regulated protein group. Although WARS has been shown to be predominantly up-regulated at the transcriptional level by IFN-γ, there was some up-regulation by IFN-α (54). Although WARS was not found to have been up-regulated by IFN-α at the protein level in the present study, IFN-γ and -β1 stimulation of A549 cells did cause up-regulation of this protein. The level of up-regulation of WARS by IFN-β1 was lower by comparison with IFN-γ and was not sufficient to cause the level of induction observed in hRSV-infected A549 cells. The present findings regarding hRSV induction of an IFN-γ response in A549 cells is contrary to the expectation that epithelial cells should not produce this cytokine (68). However, they are consistent with previous observations that Mycobacterium tuberculosis infection of A549 cells results in secretion of IFN-γ (69). In addition, our own previous studies attributed the hRSV NS1 with suppression of IFN-γ responses in hRSV-infected A549 cells (24). It may be that the observation of IFN-γ responses in this and the earlier study may reflect the specific characteristics of A549 cells as opposed to primary epithelial cells.
Observations herein in relation to induction of TNF-α and noncanonical NF-κB responses by A549 cells in response to hRSV infection are also consistent with previous reports (70–72). TNF-α has been detected in the culture medium of hRSV-infected A549 cells (71, 72). Likewise, induction of the NF-κB2-dependent noncanonical NF-κB responses has been documented with hRSV-infected A549 cells (70). It is evident from the present study that the noncanonical NF-κB responses are likely to be amplified by the induction of TNF-α, which induces NF-κB2 and its essential binding partner in forming the noncanonical NF-κB transcription factor, RelB.
The responses of A549 cells to hRSV infection described herein represent a compromise position between these cells and hRSV caused by the dampening effect of the nonstructural proteins of the virus, NS1 and NS2 that act to suppress cellular pathways which have evolved to eliminate viral infections (3, 14, 16, 30). For example, these nonstructural proteins have been shown to suppress IFN induction and signaling pathways (24, 31, 72–79). A better understanding of the mechanism of actions of NS1 and NS2 may well be an effective way forward for design of therapeutics for treatment of hRSV infections. It is apparent that these nonstructural proteins act to produce outcomes that will be most readily observed at a posttranslational level. For instance, it has been proposed that these proteins participate in E3-ligase complexes that target Stat2 for degradation (80), although a previous proteomic study did not support Stat2 as an E3-ligase substrate of NS1 (24). Consequently, it will be necessary to deploy the most penetrating proteomic tools available to define pathways impacted by NS1 and NS2 and to identify their binding partners within these pathways. It is evident that the workflows described herein will be valuable tools to employ in such studies involving NS1 and NS2 gene deleted forms of hRSV. This prospect is currently under evaluation.
It is possible that proteoform modulation (81) may also serve as an additional or alternate means of regulation of host cell responses to RSV. The protein fractionation-free datasets are probably uninformative in relation to proteoform variation in response to hRSV infection. However, we have preliminary indications that further analysis of datasets from the in-solution protein IEF workflow involving fraction by fraction comparisons may provide insights into proteoform variations in hRSV-infected A549 cells. Such analyses are underway with the intention of defining whether or not cells induce proteoform-specific responses to hRSV infection.
Supplementary Material
Footnotes
Author contributions: P.L.C. and J.J.G. designed research; K.A.D., A.A.B., M.J.H., U.J.B., and T.S. performed research; E.L.N., A.A.B., and U.J.B. contributed new reagents or analytic tools; K.A.D., E.L.N., M.J.H., T.S., and J.J.G. analyzed data; J.J.G. wrote the paper.
* This work was supported in-part by project grant funding from NHMRC Australia. Preparation of infected cell lysates described in this work was funded by the NIAID, NIH, Intramural Program. Access to proteomic infrastructure in the QIMR Berghofer Protein Discovery Centre was made possible by funding from Bioplatforms Australia and the Queensland State Government provided through the Australian Government National Collaborative Infrastructure Scheme (NCRIS) and Education Investment Fund (EIF).
 This article contains supplemental Figs. S1 to S7 and Tables S1 to S6.
1 The abbreviations used are:
- hRSV
- human respiratory syncytial virus
- 1D
- one-dimensional
- 2D
- two-dimensional
- Cap
- capillary
- F
- human repiratory syncytial virus fusion protein
- FDR
- false discovery rate
- G
- human repiratory syncytial virus glycoprotein
- GO
- Gene Ontology
- Hep2
- human epithelial type 2
- IFN
- interferon
- IFIT3
- interferon-induced protein with tetracopeptide repeats 3
- IPA
- Ingenuity Pathway Analysis
- IRF
- interferon-regulatory factor
- ISG15
- Interferon-induced 17 kDa protein
- L
- human repiratory syncytial virus polymerase protein
- LTQ
- linear ion trap
- M
- human repiratory syncytial virus matrix protein
- MS/MS
- tandem mass spectrometry
- MxA
- Interferon-induced GTP-binding protein
- NS1
- hRSV nonstructural protein1
- NS2
- hRSV nonstructural protein2
- nU
- nanoUltra
- NF-κB
- nuclear factor kappa-light-chain-enhancer of activated B cells
- PEP
- posterior error probability
- SILAC
- stable isotope labeling by amino acids in cell culture
- SOD2
- Mitochondrial Mn Superoxide Dismutase 2
- Stat
- Signal transducer and activator of transcription
- TGM2
- Protein-glutamine gamma-glutamyltransferase 2
- TNF-α
- Tumor necrosis factor-α
- VSN
- variance-stabilising normalisation
- WARS
- Tryptophan-tRNA synthetase.
REFERENCES
- 1. Collins P. L., Chanock R. M., Murphy B. R. (2001) “Respiratory Syncytial Virus,” In: Knipe D. M., Howley P. M., Griffin D. E., Lamb R. A., Martin M. A., Roizman B., Straus S. E., eds. Fields Virology, Fourth Ed., pp. 1443–1485, Lippincott-Raven Publishers, Philadelphia. [Google Scholar]
- 2. Collins P. L., Crowe J. E. J. (2007) “Respiratory Syncytial Virus and Metapneumovirus,” In: Knipe D. M., Howley P. M., Griffin D. E., Lamb R. A., Martin M. A., Roizman B., Straus S. E., eds. Fields Virology, 5 Ed., pp. 1601–1646, Lippincott-Raven Publishers, Philadelphia. [Google Scholar]
- 3. Collins P. L., Graham B. S. (2008) Viral and host factors in human respiratory syncytial virus pathogenesis. J. Virol. 82, 2040–2055 [DOI] [PMC free article] [PubMed] [Google Scholar]
- 4. Hall C. B. (1994) Prospects for a respiratory syncytial virus vaccine. Science 265, 1393–1394 [DOI] [PubMed] [Google Scholar]
- 5. Levin M. J. (1994) Treatment and prevention options for respiratory syncytial virus infections. J. Pediatr. 124, S22–S27 [DOI] [PubMed] [Google Scholar]
- 6. Collins P. L., Murphy B. R. (2005) New generation live vaccines against human respiratory syncytial virus designed by reverse genetics. Proc. Am. Thorac. Soc. 2, 166–173 [DOI] [PMC free article] [PubMed] [Google Scholar]
- 7. Collins P. L., Whitehead S. S., Bukreyev A., Fearns R., Teng M. N., Juhasz K., Chanock R. M., Murphy B. R. (1999) Rational design of live-attenuated recombinant vaccine virus for human respiratory syncytial virus by reverse genetics. Adv. Virus Res. 54, 423–451 [DOI] [PubMed] [Google Scholar]
- 8. Karron R. A., Wright P. F., Belshe R. B., Thumar B., Casey R., Newman F., Polack F. P., Randolph V. B., Deatly A., Hackell J., Gruber W., Murphy B. R., Collins P. L. (2005) Identification of a recombinant live attenuated respiratory syncytial virus vaccine candidate that is highly attenuated in infants. J. Infect. Dis. 191, 1093–1104 [DOI] [PubMed] [Google Scholar]
- 9. Luongo C., Yang L., Winter C. C., Spann K. M., Murphy B. R., Collins P. L., Buchholz U. J. (2009) Codon stabilization analysis of the “248” temperature sensitive mutation for increased phenotypic stability of respiratory syncytial virus vaccine candidates. Vaccine 27, 5667–5676 [DOI] [PMC free article] [PubMed] [Google Scholar]
- 10. van Drunen Littel-van den Hurk S., Mapletoft J. W., Arsic N., Kovacs-Nolan J. (2007) Immunopathology of RSV infection: prospects for developing vaccines without this complication. Rev. Med. Virol. 17, 5–34 [DOI] [PubMed] [Google Scholar]
- 11. Afghani B., Ngo T., Leu S. Y., Wu F. L., Cecilio M., Aron-Johnson P., Zeitany R., Sills J., Amin A. (2006) The effect of an interventional program on adherence to the american academy of pediatrics guidelines for palivizumab prophylaxis. Pediatr. Infect. Dis. J. 25, 1019–1024 [DOI] [PubMed] [Google Scholar]
- 12. Mejias A., Ramilo O. (2008) Review of palivizumab in the prophylaxis of respiratory syncytial virus (RSV) in high-risk infants. Biologics 2, 433–439 [DOI] [PMC free article] [PubMed] [Google Scholar]
- 13. Wu H., Pfarr D. S., Losonsky G. A., Kiener P. A. (2008) Immunoprophylaxis of RSV infection: advancing from RSV-IGIV to palivizumab and motavizumab. Curr. Top, Microbiol, Immunol. 317, 103–123 [DOI] [PubMed] [Google Scholar]
- 14. Collins P. L., Melero J. A. (2011) Progress in understanding and controlling respiratory syncytial virus: still crazy after all these years. Virus Res. 162, 80–99 [DOI] [PMC free article] [PubMed] [Google Scholar]
- 15. Hall C. B., Long C. E., Schnabel K. C. (2001) Respiratory syncytial virus infections in previously healthy working adults. Clin. Infect. Dis. 33, 792–796 [DOI] [PubMed] [Google Scholar]
- 16. Barik S. (2013) Respiratory syncytial virus mechanisms to interfere with type 1 interferons. Curr. Top. Microbiol. Immunol. 372, 173–191 [DOI] [PubMed] [Google Scholar]
- 17. Glezen W. P., Taber L. H., Frank A. L., Kasel J. A. (1986) Risk of primary infection and reinfection with respiratory syncytial virus. Am. J. Dis. Children 140, 543–546 [DOI] [PubMed] [Google Scholar]
- 18. Janssen R., Pennings J., Hodemaekers H., Buisman A., van Oosten M., de Rond L., Ozturk K., Dormans J., Kimman T., Hoebee B. (2007) Host transcription profiles upon primary respiratory syncytial virus infection. J. Virol. 81, 5958–5967 [DOI] [PMC free article] [PubMed] [Google Scholar]
- 19. Martinez I., Lombardia L., Garcia-Barreno B., Dominguez O., Melero J. A. (2007) Distinct gene subsets are induced at different time points after human respiratory syncytial virus infection of A549 cells. J. Gen. Virol. 88, 570–581 [DOI] [PubMed] [Google Scholar]
- 20. Mayer A. K., Muehmer M., Mages J., Gueinzius K., Hess C., Heeg K., Bals R., Lang R., Dalpke A. H. (2007) Differential recognition of TLR-dependent microbial ligands in human bronchial epithelial cells. J. Immunol. 178, 3134–3142 [DOI] [PubMed] [Google Scholar]
- 21. Tian B., Zhang Y., Luxon B. A., Garofalo R. P., Casola A., Sinha M., Brasier A. R. (2002) Identification of NF-kappaB-dependent gene networks in respiratory syncytial virus-infected cells. J. Virol. 76, 6800–6814 [DOI] [PMC free article] [PubMed] [Google Scholar]
- 22. Zhang Y., Luxon B. A., Casola A., Garofalo R. P., Jamaluddin M., Brasier A. R. (2001) Expression of respiratory syncytial virus-induced chemokine gene networks in lower airway epithelial cells revealed by cDNA microarrays. J. Virol. 75, 9044–9058 [DOI] [PMC free article] [PubMed] [Google Scholar]
- 23. Brasier A. R., Spratt H., Wu Z., Boldogh I., Zhang Y., Garofalo R. P., Casola A., Pashmi J., Haag A., Luxon B., Kurosky A. (2004) Nuclear heat shock response and novel nuclear domain 10 reorganization in respiratory syncytial virus-infected a549 cells identified by high-resolution two-dimensional gel electrophoresis. J. Virol. 78, 11461–11476 [DOI] [PMC free article] [PubMed] [Google Scholar]
- 24. Hastie M. L., Headlam M. J., Patel N. B., Bukreyev A. A., Buchholz U. J., Dave K. A., Norris E. L., Wright C. L., Spann K. M., Collins P. L., Gorman J. J. (2012) The human respiratory syncytial virus nonstructural protein 1 regulates type I and type II interferon pathways. Mol. Cell. Proteomics 11, 108–127 [DOI] [PMC free article] [PubMed] [Google Scholar]
- 25. Jamaluddin M., Wiktorowicz J. E., Soman K. V., Boldogh I., Forbus J. D., Spratt H., Garofalo R. P., Brasier A. R. (2010) Role of peroxiredoxin 1 and peroxiredoxin 4 in protection of respiratory syncytial virus-induced cysteinyl oxidation of nuclear cytoskeletal proteins. J. Virol. 84, 9533–9545 [DOI] [PMC free article] [PubMed] [Google Scholar]
- 26. Munday D. C., Emmott E., Surtees R., Lardeau C. H., Wu W., Duprex W. P., Dove B. K., Barr J. N., Hiscox J. A. (2010) Quantitative proteomic analysis of A549 cells infected with human respiratory syncytial virus. Mol. Cell. Proteomics 9, 2438–2459 [DOI] [PMC free article] [PubMed] [Google Scholar]
- 27. Munday D. C., Surtees R., Emmott E., Dove B. K., Digard P., Barr J. N., Whitehouse A., Matthews D., Hiscox J. A. (2012) Using SILAC and quantitative proteomics to investigate the interactions between viral and host proteomes. Proteomics 12, 666–672 [DOI] [PubMed] [Google Scholar]
- 28. Ternette N., Wright C., Kramer H. B., Altun M., Kessler B. M. (2011) Label-free quantitative proteomics reveals regulation of interferon-induced protein with tetratricopeptide repeats 3 (IFIT3) and 5′-3′-exoribonuclease 2 (XRN2) during respiratory syncytial virus infection. Virol. J. 8, 442. [DOI] [PMC free article] [PubMed] [Google Scholar]
- 29. van Diepen A., Brand H. K., Sama I., Lambooy L. H., van den Heuvel L. P., van der Well L., Huynen M., Osterhaus A. D., Andeweg A. C., Hermans P. W. Quantitative proteome profiling of respiratory virus-infected lung epithelial cells. J. Proteomics 73, 1680–1693 [DOI] [PubMed] [Google Scholar]
- 30. Collins P. L., Fearns R., Graham B. S. (2013) Respiratory syncytial virus: virology, reverse genetics, and pathogenesis of disease. Curr. Top. Microbiol. 372, 3–38 [DOI] [PMC free article] [PubMed] [Google Scholar]
- 31. Spann K. M., Tran K. C., Chi B., Rabin R. L., Collins P. L. (2004) Suppression of the induction of alpha, beta, and lambda interferons by the NS1 and NS2 proteins of human respiratory syncytial virus in human epithelial cells and macrophages [corrected]. J. Virol. 78, 4363–4369 [DOI] [PMC free article] [PubMed] [Google Scholar]
- 32. Munir S., Le Nouen C., Luongo C., Buchholz U. J., Collins P. L., Bukreyev A. (2008) Nonstructural proteins 1 and 2 of respiratory syncytial virus suppress maturation of human dendritic cells. J. Virol. 82, 8780–8796 [DOI] [PMC free article] [PubMed] [Google Scholar]
- 33. Cox J., Mann M. (2008) MaxQuant enables high peptide identification rates, individualized p.p.b.-range mass accuracies and proteome-wide protein quantification. Nat. Biotechnol. 26, 1367–1372 [DOI] [PubMed] [Google Scholar]
- 34. Cox J., Neuhauser N., Michalski A., Scheltema R. A., Olsen J. V., Mann M. (2011) Andromeda: A peptide search engine integrated into the maxquant environment. J. Proteome Res. 10, 1794–1805 [DOI] [PubMed] [Google Scholar]
- 35. Nesvizhskii A. I., Aebersold R. (2005) Interpretation of shotgun proteomic data: the protein inference problem. Mol. Cell. Proteomics 4, 1419–1440 [DOI] [PubMed] [Google Scholar]
- 36. Anders S., Huber W. (2010) Differential expression analysis for sequence count data. Genome Biol. 11, R106. [DOI] [PMC free article] [PubMed] [Google Scholar]
- 37. Wang P., Tang H., Zhang H., Whiteaker J., Paulovich A. G., McIntosh M. (2013) Normalization regarding nonrandom missing values in high-throughput mass spectrometry data. Mol Cell Proteomics, 12(3), 549–556 [PubMed] [Google Scholar]
- 38. Robinson M. D., McCarthy D. J., Smyth G. K. (2010) edgeR: a Bioconductor package for differential expression analysis of digital gene expression data. Bioinformatics 26, 139–140 [DOI] [PMC free article] [PubMed] [Google Scholar]
- 39. Robinson M. D., Smyth G. K. (2007) Moderated statistical tests for assessing differences in tag abundance. Bioinformatics 23, 2881–2887 [DOI] [PubMed] [Google Scholar]
- 40. Robinson M. D., Smyth G. K. (2008) Small-sample estimation of negative binomial dispersion, with applications to SAGE data. Biostatistics 9, 321–332 [DOI] [PubMed] [Google Scholar]
- 41. R Core Team (2012) R: A language and environment for statistical computing. 2.15.1 Ed., R Foundation for Statistical Computing, Vienna, Austria. [Google Scholar]
- 42. Benjamini Y., Hochberg Y. (1995) Controlling the false discovery rate: a practical and powerful approach to multiple testing. J. R. Stat. Soc. B. 57, 289–300 [Google Scholar]
- 43. Huber W., von Heydebreck A., Sultmann H., Poustka A., Vingron M. (2002) Variance stabilization applied to microarray data calibration and to the quantification of differential expression. Bioinformatics 18, S96–S104 [DOI] [PubMed] [Google Scholar]
- 44. Karp N. A., Huber W., Sadowski P. G., Charles P. D., Hester S. V., Lilley K. S. (2010) Addressing accuracy and precision issues in iTRAQ quantitation. Mol. Cell. Proteomics 9, 1885–1897 [DOI] [PMC free article] [PubMed] [Google Scholar]
- 45. Smyth G. K. (2013) Linear models and empirical bayes methods for assessing differential expression in microarray experiments. Mol Cell Proteomics. 12(3), 825–831 [DOI] [PubMed] [Google Scholar]
- 46. Smyth G. K. (2013) Limma: Linear models for microarray data. Mol Cell Proteomics. 12(6), 1502–151223412571 [Google Scholar]
- 47. Silva J. C., Gorenstein M. V., Li G. Z., Vissers J. P., Geromanos S. J. (2006) Absolute quantification of proteins by LCMSE: a virtue of parallel MS acquisition. Mol. Cell. Proteomics 5, 144–156 [DOI] [PubMed] [Google Scholar]
- 48. Gregory R. Warnes. Includes R source code and/or documentation contributed by: Ben Bolker, L. B., Robert Gentleman, Wolfgang Huber, Andy Liaw, Thomas Lumley, Martin Maechler, Arni Magnusson, Steffen Moeller, Marc Schwartz & Bill Venables (2012) gplots: Various R programming tools for plotting data.
- 49. Ashburner M., Ball C. A., Blake J. A., Botstein D., Butler H., Cherry J. M., Davis A. P., Dolinski K., Dwight S. S., Eppig J. T., Harris M. A., Hill D. P., Issel-Tarver L., Kasarskis A., Lewis S., Matese J. C., Richardson J. E., Ringwald M., Rubin G. M., Sherlock G., Gene Ontology C. (2000) Gene Ontology: tool for the unification of biology. Nat. Genetics 25, 25–29 [DOI] [PMC free article] [PubMed] [Google Scholar]
- 50. Blake J. A., Dolan M., Drabkin H., Hill D. P., Ni L., Sitnikov D., Burgess S., Buza T., Gresham C., McCarthy F., Pillai L., Wang H., Carbon S., Lewis S. E., Mungall C. J., Gaudet P., Chisholm R. L., Fey P., Kibbe W. A., Basu S., Siegele D. A., McIntosh B. K., Renfro D. P., Zweifel A. E., Hu J. C., Brown N. H., Tweedie S., Alam-Faruque Y., Apweiler R., Auchinchloss A., Axelsen K., Argoud-Puy G., Bely B., Blatter M. C., Bougueleret L., Boutet E., Branconi-Quintaje S., Breuza L., Bridge A., Browne P., Chan W. M., Coudert E., Cusin I., Dimmer E., Duek-Roggli P., Eberhardt R., Estreicher A., Famiglietti L., Ferro-Rojas S., Feuermann M., Gardner M., Gos A., Gruaz-Gumowski N., Hinz U., Hulo C., Huntley R., James J., Jimenez S., Jungo F., Keller G., Laiho K., Legge D., Lemercier P., Lieberherr D., Magrane M., Martin M. J., Masson P., Moinat M., O'Donovan C., Pedruzzi I., Pichler K., Poggioli D., Millan P. P., Poux S., Rivoire C., Roechert B., Sawford T., Schneider M., Sehra H., Stanley E., Stutz A., Sundaram S., Tognolli M., Xenarios I., Foulger R., Lomax J., Roncaglia P., Camon E., Khodiyar V. K., Lovering R. C., Talmud P. J., Chibucos M., Giglio M. G., Dolinski K., Heinicke S., Livstone M. S., Stephan R., Harris M. A., Oliver S. G., Rutherford K., Wood V., Bahler J., Lock A., Kersey P. J., McDowall M. D., Staines D. M., Dwinell M., Shimoyama M., Laulederkind S., Hayman T., Wang S. J., Petri V., Lowry T., D'Eustachio P., Matthews L., Amundsen C. D., Balakrishnan R., Binkley G., Cherry J. M., Christie K. R., Costanzo M. C., Dwight S. S., Engel S. R., Fisk D. G., Hirschman J. E., Hitz B. C., Hong E. L., Karra K., Krieger C. J., Miyasato S. R., Nash R. S., Park J., Skrzypek M. S., Weng S., Wong E. D., Berardini T. Z., Li D., Huala E., Slonim D., Wick H., Thomas P., Chan J., Kishore R., Sternberg P., Van Auken K., Howe D., Westerfield M., Gene Ontology C. (2012) The Gene Ontology: enhancements for 2011. Nucleic Acids Res. 40, D559–D564 [DOI] [PMC free article] [PubMed] [Google Scholar]
- 51. Binns D., Dimmer E., Huntley R., Barrell D., O'Donovan C., Apweiler R. (2009) QuickGO: a web-based tool for Gene Ontology searching. Bioinformatics 25, 3045–3046 [DOI] [PMC free article] [PubMed] [Google Scholar]
- 52. Rusinova I., Forster S., Yu S., Kannan A., Masse M., Cumming H., Chapman R., Hertzog P. J. (2013) INTERFEROME v2.0: an updated database of annotated interferon-regulated genes. Nucleic Acids Res. 41, D1040–D1046 [DOI] [PMC free article] [PubMed] [Google Scholar]
- 53. Shannon P., Markiel A., Ozier O., Baliga N. S., Wang J. T., Ramage D., Amin N., Schwikowski B., Ideker T. (2003) Cytoscape: a software environment for integrated models of biomolecular interaction networks. Genome Res. 13, 2498–2504 [DOI] [PMC free article] [PubMed] [Google Scholar]
- 54. Fleckner J., Martensen P. M., Tolstrup A. B., Kjeldgaard N. O., Justesen J. (1995) Differential regulation of the human, interferon inducible tryptophanyl-tRNA synthetase by various cytokines in cell lines. Cytokine 7, 70–77 [DOI] [PubMed] [Google Scholar]
- 55. Chung-man Ho J., Zheng S., Comhair S. A., Farver C., Erzurum S. C. (2001) Differential expression of manganese superoxide dismutase and catalase in lung cancer. Cancer Res. 61, 8578–8585 [PubMed] [Google Scholar]
- 56. Harris C. A., Derbin K. S., Hunte-McDonough B., Krauss M. R., Chen K. T., Smith D. M., Epstein L. B. (1991) Manganese superoxide dismutase is induced by IFN-gamma in multiple cell types. Synergistic induction by IFN-gamma and tumor necrosis factor or IL-1. J. Immunol. 147, 149–154 [PubMed] [Google Scholar]
- 57. Sanda C., Weitzel P., Tsukahara T., Schaley J., Edenberg H. J., Stephens M. A., McClintick J. N., Blatt L. M., Li L., Brodsky L., Taylor M. W. (2006) Differential gene induction by type I and type II interferons and their combination. J. Interferon Cytokine Res. 26, 462–472 [DOI] [PubMed] [Google Scholar]
- 58. Rogers R. J., Monnier J. M., Nick H. S. (2001) Tumor necrosis factor-alpha selectively induces MnSOD expression via mitochondria-to-nucleus signaling, whereas interleukin-1beta utilizes an alternative pathway. J. Biol. Chem. 276, 20419–20427 [DOI] [PubMed] [Google Scholar]
- 59. Sana T. R., Janatpour M. J., Sathe M., McEvoy L. M., McClanahan T. K. (2005) Microarray analysis of primary endothelial cells challenged with different inflammatory and immune cytokines. Cytokine 29, 256–269 [DOI] [PubMed] [Google Scholar]
- 60. Warner B. B., Burhans M. S., Clark J. C., Wispe J. R. (1991) Tumor necrosis factor-alpha increases Mn-SOD expression: protection against oxidant injury. Am. J. Physiol. 260, L296–L301 [DOI] [PubMed] [Google Scholar]
- 61. Wong G. H., Goeddel D. V. (1988) Induction of manganous superoxide dismutase by tumor necrosis factor: possible protective mechanism. Science 242, 941–944 [DOI] [PubMed] [Google Scholar]
- 62. Lu G., Shimizu I., Cui X., Itonaga M., Tamaki K., Fukuno H., Inoue H., Honda H., Ito S. (2002) Interferon-alpha enhances biological defense activities against oxidative stress in cultured rat hepatocytes and hepatic stellate cells. J. Med. Invest. 49, 172–181 [PubMed] [Google Scholar]
- 63. Bayardo M., Punzi F., Bondar C., Chopita N., Chirdo F. (2012) Transglutaminase 2 expression is enhanced synergistically by interferon-gamma and tumour necrosis factor-alpha in human small intestine. Clin. Exp, Immunol. 168, 95–104 [DOI] [PMC free article] [PubMed] [Google Scholar]
- 64. Kim S. Y., Jeong E. J., Steinert P. M. (2002) IFN-gamma induces transglutaminase 2 expression in rat small intestinal cells. J. Interferon Cytokine Res. 22, 677–682 [DOI] [PubMed] [Google Scholar]
- 65. Chen Y. Y., Chambers M. C., Li M., Ham A. J., Turner J. L., Zhang B., Tabb D. L. (2013) IDPQuantify: combining precursor intensity with spectral counts for protein and peptide quantification. J. Proteome Res. 12, 4111–4121 [DOI] [PMC free article] [PubMed] [Google Scholar]
- 66. Old W. M., Meyer-Arendt K., Aveline-Wolf L., Pierce K. G., Mendoza A., Sevinsky J. R., Resing K. A., Ahn N. G. (2005) Comparison of label-free methods for quantifying human proteins by shotgun proteomics. Mol. Cell. Proteomics 4, 1487–1502 [DOI] [PubMed] [Google Scholar]
- 67. Gorman J. J., Ferguson B. L., Speelman D., Mills J. (1997) Determination of the disulfide bond arrangement of human respiratory syncytial virus attachment (G) protein by matrix-assisted laser desorption/ionization time-of-flight mass spectrometry. Protein Sci. 6, 1308–1315 [DOI] [PMC free article] [PubMed] [Google Scholar]
- 68. Fensterl V., Sen G. C. (2009) Interferons and viral infections. BioFactors 35, 14–20 [DOI] [PubMed] [Google Scholar]
- 69. Sharma M., Sharma S., Roy S., Varma S., Bose M. (2007) Pulmonary epithelial cells are a source of interferon-gamma in response to Mycobacterium tuberculosis infection. Immunol. Cell Biol. 85, 229–237 [DOI] [PubMed] [Google Scholar]
- 70. Choudhary S., Boldogh S., Garofalo R., Jamaluddin M., Brasier A. R. (2005) Respiratory syncytial virus influences NF-kappaB-dependent gene expression through a novel pathway involving MAP3K14/NIK expression and nuclear complex formation with NF-kappaB2. J. Virol. 79, 8948–8959 [DOI] [PMC free article] [PubMed] [Google Scholar]
- 71. Dou Y., Zhao Y., Zhang Z. Y., Mao H. W., Tu W. W., Zhao X. D. (2013) Respiratory syncytial virus infection induces higher Toll-like receptor-3 expression and TNF-alpha production than human metapneumovirus infection. PloS One 8, e73488. [DOI] [PMC free article] [PubMed] [Google Scholar]
- 72. Spann K. M., Tran K. C., Collins P. L. (2005) Effects of nonstructural proteins NS1 and NS2 of human respiratory syncytial virus on interferon regulatory factor 3, NF-kappaB, and proinflammatory cytokines. J. Virol. 79, 5353–5362 [DOI] [PMC free article] [PubMed] [Google Scholar]
- 73. Bossert B., Marozin S., Conzelmann K. K. (2003) Nonstructural proteins NS1 and NS2 of bovine respiratory syncytial virus block activation of interferon regulatory factor 3. J. Virol. 77, 8661–8668 [DOI] [PMC free article] [PubMed] [Google Scholar]
- 74. Kotelkin A., Belyakov I. M., Yang L., Berzofsky J. A., Collins P. L., Bukreyev A. (2006) The NS2 protein of human respiratory syncytial virus suppresses the cytotoxic T-cell response as a consequence of suppressing the type I interferon response. J. Virol. 80, 5958–5967 [DOI] [PMC free article] [PubMed] [Google Scholar]
- 75. Ling Z., Tran K. C., Teng M. N. (2009) Human respiratory syncytial virus nonstructural protein NS2 antagonizes the activation of beta interferon transcription by interacting with RIG-I. J. Virol. 83, 3734–3742 [DOI] [PMC free article] [PubMed] [Google Scholar]
- 76. Lo M. S., Brazas R. M., Holtzman M. J. (2005) Respiratory syncytial virus nonstructural proteins NS1 and NS2 mediate inhibition of Stat2 expression and alpha/beta interferon responsiveness. J. Virol. 79, 9315–9319 [DOI] [PMC free article] [PubMed] [Google Scholar]
- 77. Ramaswamy M., Shi L., Varga S. M., Barik S., Behlke M. A., Look D. C. (2006) Respiratory syncytial virus nonstructural protein 2 specifically inhibits type I interferon signal transduction. Virology 344, 328–339 [DOI] [PubMed] [Google Scholar]
- 78. Schlender J., Bossert B., Buchholz U., Conzelmann K. K. (2000) Bovine respiratory syncytial virus nonstructural proteins NS1 and NS2 cooperatively antagonize alpha/beta interferon-induced antiviral response. J. Virol. 74, 8234–8242 [DOI] [PMC free article] [PubMed] [Google Scholar]
- 79. Swedan S., Musiyenko A., Barik S. (2009) Respiratory syncytial virus nonstructural proteins decrease levels of multiple members of the cellular interferon pathways. J. Virol. 83, 9682–9693 [DOI] [PMC free article] [PubMed] [Google Scholar]
- 80. Elliott J., Lynch O. T., Suessmuth Y., Qian P., Boyd C. R., Burrows J. F., Buick R., Stevenson N. J., Touzelet O., Gadina M., Power U. F., Johnston J. A. (2007) Respiratory syncytial virus NS1 protein degrades STAT2 by using the Elongin-Cullin E3 ligase. J. Virol. 81, 3428–3436 [DOI] [PMC free article] [PubMed] [Google Scholar]
- 81. Smith L. M., Kelleher N. L., and Consortium for Top Down P. (2013) Proteoform: a single term describing protein complexity. Nat.Methods 10, 186–187 [DOI] [PMC free article] [PubMed] [Google Scholar]
Associated Data
This section collects any data citations, data availability statements, or supplementary materials included in this article.