

Abstract
Proteomics-based clinical studies represent promising resources for the discovery of novel biomarkers or for unraveling molecular mechanisms underlying particular diseases. Here, we present a discovery study of hepatocellular carcinoma developed on nonfibrotic liver (nfHCC) that combines complementary quantitative iTRAQ-based proteomics and phosphoproteomics approaches. Using both approaches, we compared a set of 24 samples (18 nfHCC versus six nontumor liver tissue). We identified 43 proteins (67 peptides) differentially expressed and 32 peptides differentially phosphorylated between the experimental groups. The functional analysis of the two data sets pointed toward the deregulation of a protein homeostasis (proteostasis) network including the up-regulation of the Endoplasmic Reticulum (ER) resident HSPA5, HSP90B1, PDIA6, and P4HB and of the cytosolic HSPA1B, HSP90AA1, HSPA9, UBC, CNDP2, TXN, and VCP as well as the increased phosphorylation of the ER resident calnexin at Ser583. Antibody-based validation approaches (immunohistochemistry, immunoblot, Alphascreen®, and AMMP®) on independent nfHCC tumor sets (up to 77 samples) confirmed these observations, thereby indicating a common mechanism occurring in nfHCC tumors. Based on these results we propose that adaptation to proteostasis imbalance in nfHCC tumors might confer selective advantages to those tumors. As such, this model could provide an additional therapeutic opportunity for those tumors arising on normal liver by targeting the tumor proteostasis network. Data are available via ProteomeXchange with identifier PXD001253.
Hepatocellular carcinoma (HCC)1 is currently the fifth most common malignancy worldwide with an annual incidence up to 500 per 100,000 individuals depending on the geographic region investigated. Whereas 80% of new cases occur in developing countries, the incidence increases in industrialized nations including Western Europe, Japan, and the United States (1). Ten to 40% HCC arise on noncirrhotic liver, including 5% on nonfibrotic liver (nfHCC) (2). Although these tumors provide an interesting model for the analysis of the hepatocarcinogenesis pathways without the confounding factors associated with cirrhosis, the understanding of their characteristics in terms of genetics and signaling specificity remains elusive. Recently, exome sequencing approaches and transcriptome analyses have provided some information regarding the genetic alterations occurring in those tumors (3). Herein we intended to investigate their signaling properties using systematic proteomics-based approaches.
The analysis of frequently occurring signaling events in HCC has been investigated in many studies using “omics”-based strategies over the past decade (4). In particular, the proteomics-based approaches have turned out to represent promising strategies, offering several quantification techniques to reveal differences in protein expression or protein post-translational modifications that are caused by a particular disease. Several mass-spectrometry-based quantitative studies using labeling-techniques like SILAC (stable isotope labeling by amino acids in cell culture) or iTRAQ (isobaric tags for relative and absolute quantification) have also been carried out for the analysis of HCC (5). However, such experiments imply additional labeling reactions (in case of iTRAQ) or are limited to tissue culture systems or mouse models (in case of SILAC). In the latter case, one can overcome the limitation by using the isotope-labeled proteins obtained from tissue culture as an internal standard added to a corresponding tissue sample. This approach is known as CDIT (culture-derived isotope tags) and was applied recently in a HCC study (6). Nevertheless, those approaches were used to investigate protein expression changes but not fine-tuned alterations of signaling pathways. Herein, we have used iTRAQ-based proteomics and phosphoproteomics strategies in human nfHCC tumors to investigate not only the changes occurring at the protein level in those tumors but also at the level of protein phosphorylation and signaling pathway activation.
We describe an integrated quantitative proteomic and phosphoproteomic analysis, which represents to our knowledge the first time for such combined study performed with regard to nfHCC and a larger set of biological samples. The integration of the results from both approaches led us to identify novel alterations in nfHCC, which were further validated in additional sample sets (Fig. 1). Our work unravels the perturbation of the proteostasis network (7, 8) in nfHCC at both expression and phosphorylation levels, thereby providing a new framework to target those cancers with original therapeutic approaches.
Fig. 1.
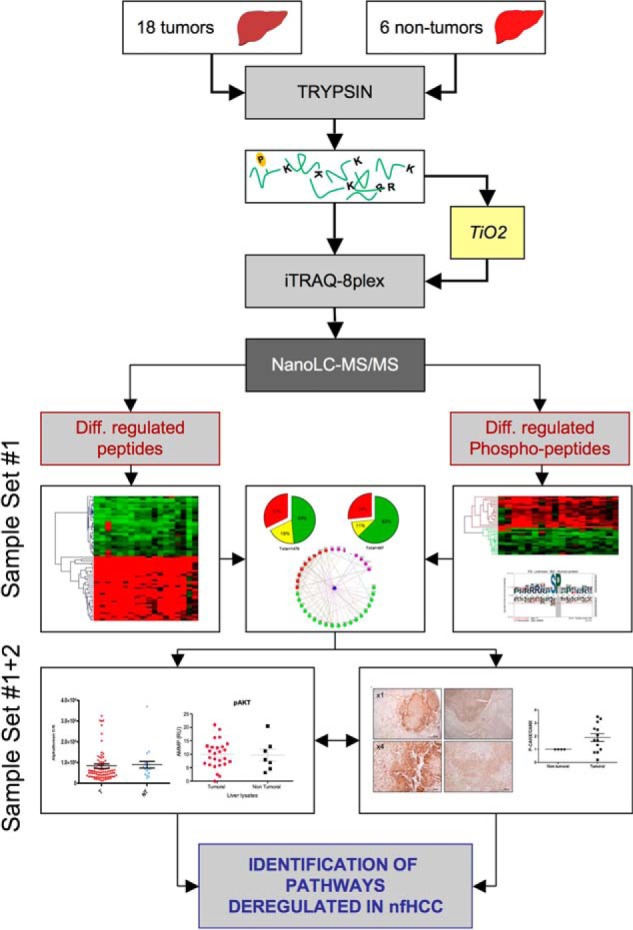
Experimental workflow. Total tumor or nontumor tissue extracts were trypsin digested and either directly labeled with iTRAQ-8plex or purified using TiO2 chromatography and labeled prior to mass spectrometry analysis. Phospho and -proteomics data were then qualitatively, quantitatively and functionally analyzed. In the last part of the experimental scheme, data were experimentally validated for (1) kinase activation (left), and (2) proteostasis modulation (right).
MATERIALS AND METHODS
Clinical Specimens and Patient History
Samples used in this study were selected from the liver tissue bank of the Department of Pathology (Pellegrin Hospital, Bordeaux, France). Human liver tissue specimens were freshly received, sampled at the Department of Pathology and stored at −80 °C. All of the biopsies correspond to nonfibrotic livers with hepatocellular carcinoma (nfHCC). Patient and tissues characteristics are presented in Table I. They essentially correspond to males (84.5%) with alcohol addiction. All the samples were from the “Centre de Ressources Biologiques (CRB) sur le CHC” and banked according to the French legislation.
Table I. Characteristics of the nfHCC patients—92 nfHCC samples were used in this study on the basis of their fibrosis stage (F0-F1, Edmondson grade). These samples were split into four partially redundant and homogeneous sets as indicated below and used for the indicated application. IHC: immunohistochemistry. Alpha: alphascreen®, AMMP: Acoustic Membrane Micro-Particle technology. The average age, age interval and gender (%F/M) is indicated.
| Characteristics | IHC (12) | Proteomics (18) | Alpha (77) | AMMP (22) |
|---|---|---|---|---|
| Average age | 81 | 74 | 70 | 72 |
| Age interval | 46–101 | 46–101 | 35–102 | 48–102 |
| Gender % (F/M) | 17/83 | 11/89 | 16/84 | 18/82 |
Materials
Frozen liver tissues were crushed using a Qiagen homogeneizer. TiO2 purification and C18 desalting protocol were carried out with HPLC system (Beckman Coulter, France). Proteomics data were produced with nanoLC U3000 system (Dionex, France) coupled with a LTQ Orbitrap XL (Thermo Scientific, France). Chemicals for proteomic and HPLC were purchased from Sigma Aldrich, France. ITRAQ reagent 8-plex kit was provided from SCIEX, France. Antibodies to Calnexin were described previously (9). Antiphospho (Ser583)-calnexin antibody was from Novus Biologicals (Cambridge, UK), anti-p97/VCP mouse monoclonal antibodies were from Abcam (Paris, France) and anti-p97/VCP rabbit polyclonal antibodies were from Proteintech (Chicago, IL). Anti-KDEL mouse monoclonal antibodies were from Abnova (Tapei city, Tawain).
Sample Preparation for Proteomics Analyses
Fifty to 100 mg of liver tissues were homogenized at 4 °C in 0.5 ml of buffer containing 0.1 m triethylammonium bicarbonate (TEAB) pH 9.3, 0.15 m NaCl, 0.1% SDS, 5 mm NaF, 2 mm Na3VO4, and 10 mm DTT, then heated 10 min at 100 °C. After cooling at 25 °C, 40 mm IAA was added for 45 min at RT for cysteine alkylation. Proteolytic cleavage with trypsin 1% (w/w) was performed overnight at 37 °C. The mixture was acidified with TFA 1% final and tryptic peptides were purified with online C18 Sep-Pack SPE (washing buffer: 0.1% TFA and elution buffer 60% ACN). The purified fraction was dried with a vacuum centrifuge (SpeedVac,Thermo Scientific) and weighted. Ten mg of dried extract were currently obtained from 100 mg tissue. Phosphopeptides purification was performed with 2 mm × 4 cm column packed with TiO2 (Titansphere TiO 5 μm, GL Science, Japan), and UV detection (280 nm) as previously described (10). The loading/washing buffer was 1 m Glycolic acid in 5% TFA. Retained peptides were eluted with 1 m ammonium hydroxide immediately neutralized with formic acid, then desalted with C18 SPE. Fractions were quantified with the DC protein assay (Bio-Rad, Hercules, CA), using albumin tryptic peptides as standard. Approximately 10 μg TiO2 peptides were obtained from 10 mg total peptides. iTRAQ 8plex labeling was carried out according to the manufacturer recommendations.
Mass Spectrometry
Samples were analyzed with LTQ Orbitrap XL. 75 μm × 150 cm C18 analytical column was used with a 300 μm × 0.5 mm preconcentration cartridge (both from (Dionex, Thermo Scientific, France)). After a loading step at 20 μl/min, the switching valve connected the preconcentration cartridge with the analytical columns and a gradient of 5 to 40% acetonitrile (ACN) at 230 nl/min was applied for 120 min. Ionization potential of the LTQ Orbitrap XL nanospray source was 1.8 kV and acquisition method was a FT-MS scan (60,000 FWHM @ m/z 400) followed by ion trap MS/MS and FT MS/MS (7500 FWHM @ m/z 400) of the three most intense precursor ions (see supplemental Material for the detailed settings). Data processing was performed with Proteome Discoverer 1.3 (Thermo Scientific). Query parameters were set as follows: precursor and fragment tolerance respectively 3 ppm and 0.7 Da, full tryptic peptides, 1 miss-cleavage, static modification on C (+57.0215), N-terminal and lysine (304.2054), and dynamic modification on S, T, Y (+79.9663), N (+0.984), and M, P (+15.9949) (see Supplementary Material for the detailed parameters). The human sequences were extracted from Swiss-Prot complete genome databases. Result filters were applied as: peptide confidence = high (automatic adjustment of XCorr for False Discovery Rate (FDR) <1%). Further data manipulations were performed using Microsoft Excel to eliminate redundancy of peptides sequences. ITRAQ channels were extracted and processed using Proteome discoverer 1.3. ITRAQ quantification was expressed as ratio with the mean of iTRAQ 119 + 121 as denominator. The mass spectrometry proteomics data have been deposited to the ProteomeXchange Consortium (http://proteomecentral.proteomexchange.org) via the PRIDE partner repository with the data set identifier PXD001253. Project name: iTRAQ proteomics of nonfibrotic carcinoma on Human Liver; Project accession: PXD001253.
Hierarchical Clustering and Network Analyses
Peptides expression was analyzed with MeV Microarray software suite (11). For each peptide identified in the 4 iTRAQ 8-plex series (18 nfHCC versus six nontumor tissues), the 18 tumors tissues were compared with the six nontumors tissues with Wilcoxon Rank Sum Test and significance was based on False Discovery Rate (Benjamini-Hochberg). The resulting significant peptides were clustered with complete linkage clustering using Euclidian distance and ordering optimization. Networks were built using the String database (12) and annotated using the Medusa program. Kinase-substrate interaction networks were built using the Networkin program (13, 14).
Immunoblot and Immunohistochemistry
Immunoblotting was performed as previously described (9). Briefly, tissue extracts were resolved by SDS-PAGE and transferred onto PVDF membranes. Membranes were blocked using PBS, 0.1% Tween 20 for 30 min at room temperature followed by incubation with the primary antibody overnight at 4 °C and blots were revealed using chemoluminescence. Immunohistochemistry was performed on nfHCC tissue sections as previously described by our group on other types of tumors (15). Following pretreatment at pH 6 and peroxidase blocking, slides were respectively incubated with anti-VCP (1/200), anti-p-calnexin (1/700), or anti-calnexin (1/700) for 30 min. Slides were then washed, treated with the Envision FLEX/HRP system for 20 min and revealed with the EnVision FLEX-DAB chromogen (Dako (Glostrup, Denmark)) and with Mayer's Hematoxylin (Lille's Modification) Histological Staining Ragent (Dako 53309) for 3 min and distilled water for 5 min.
Alphascreen and AMMP Analyses
Alphascreen assays were performed on tissue extracts suspended in SureFire lysis buffer, solubilized and clarified by centrifugation. These extracts were then depleted from IgG (by using proteinA/G-bound magnetic beads) and from biotin (by using streptavin-bound magnetic beads). These extracts were analyzed using the ERK1 and phospho-ERK1 SureFire kits as recommended by the manufacturer. TPER buffer (Pierce-Thermo Scientific, France) supplemented with a protease and phosphatase inhibitor mixture and clarified by centrifugation. These lysates were then assayed on the AMMP reader for phospho-AKT.
Statistical Analyses
Data are presented as mean ± S.E. of at least three separate experiments if not specified otherwise and compared with multiple t test corrected using one-way analysis of variance (ANOVA) followed by Dunnett's multiple comparison tests for experiments on mammalian cells. The significance was set at p value < 0.05. All statistical analyses were performed using GraphPad Prism (version 6) statistical software (GraphPad Software; San Diego, CA).
RESULTS
In an attempt to better characterize the molecular signaling events occurring in nfHCC, we designed an experimental strategy relying on the use of differential quantitative proteomics in human tumors (Fig. 1). First, a proteomics sample set was built and comprised 18 nfHCC tumors and six nontumor tissues. Protein extracts were generated and trypsin digested as indicated in the Methods section. Peptides were either directly, or after phosphopeptide enrichment via TiO2 chromatography, labeled with iTRAQ-8plex reagents. For the unpurified peptides (Total fraction) and the peptides purified from TiO2 (TiO2 fraction), the 24 tissues were analyzed in four series of iTRAQ. In each series, iTRAQ 113 to 118 were used for labeling individual samples and iTRAQ 119 and 121 were used to label a mixture of nontumors as a common reference for the different series, thus allowing comparison of data between series. These analyses led to the identification of peptides and phosphopeptides differentially regulated in nfHCC tumors. An in-depth network analysis then identified molecular machineries functionally deregulated in nfHCC. The relevance of these molecular machines was then investigated in our nfHCC sample validation set pointing toward proteostasis imbalance in those tumors (Fig. 1).
iTRAQ Proteomics in nfHCC Tumors
Phosphopeptides represent a minor part of the total peptides obtained from a proteome tryptic digest. They are almost undetectable unless an efficient purification method such as affinity chromatography on TiO2 is engaged. We integrated an online TiO2 chromatography column for enrichment of phosphopeptides (10) in a classical iTRAQ proteomics protocol (Fig. 2A). We obtained 10 mg tryptic peptides from 100 mg fresh tissue and around 10 μg of peptides from TiO2 chromatography, corresponding to 0.1% of the total peptides. The two following fractions were labeled using iTRAQ: 1) the “total fraction” corresponded to unpurified peptides, and 2) the “TiO2 fraction” corresponded to peptides eluted from the TiO2 column. Peptide derivation with iTRAQ adds an isobaric tag (+304.2054 Da) to amine groups at pH >8 (i.e. N-terminal amine and ε-amine of lysine) and the labeled peptides coming from eight different samples are differentiated in MS/MS spectra by eight reporter ions ranging from 113 to 121. As a consequence, iTRAQ 8-plex is designed to study a maximum of eight samples. In order to increase the number of samples analyzed up to 24 in our case, we split the samples in four iTRAQ series, each containing an internal standard for integration purposes. Peptides estimation with Lowry assay allowed to adjust the peptides/iTRAQ ratio as recommended by the manufacturer (here one unit per 50 μg peptide) and derivation efficiency was verified using database query and iTRAQ settled as variable modification. Then it appeared that only full iTRAQ peptides were identified and no tyrosine/arginine were labeled. Inter-series normalization was made possible by using two reference samples in all series. After intra-series normalization based upon total intensities of each of the iTRAQ channels, ratios were calculated with the mean signal of the two references (iTRAQ 119, 121) as denominator. Thus each sample was compared with the same nontumor reference; a sample with a ratio up to 1 corresponds to an overexpression of the tumor in comparison to nontumor reference.
Fig. 2.

Proteomic worflow and data acquisition. A, 24 tissue samples were digested with trypsin and purified with TiO2 chromatography. Unpurified fraction (Total fraction) and purified fraction (TiO2 fraction) were labeled with iTRAQ -8Plex. B, iTRAQ reporter ions were detected with HCD fragmentation (right) and peptides were identified with CID fragmentation. This example corresponds to the phosphorylated peptide GELGAPEVWGL*SPK (m/z: 747.74261, z = 3).
For mass spectrometry, we found that Pulsed-Q dissociation with the LTQ-orbitrap XL was not as efficient as HCD to produce intense and reproducible iTRAQ reporter ions. On the other hand optimal HCD setting for iTRAQ was deleterious for b and y ions used for peptide identification. Thus both CID and HCD fragmentation were used for peptide identification and iTRAQ quantitation, respectively (Fig. 2B). As a direct consequence, duty cycle for each precursor was dramatically increased and the number of identified peptides inversely decreased. Within a 2 h LC-MS analysis, an average of 1083 and 360 peptides were identified in iTRAQ series for the total and TiO2 fractions, respectively. The mixture complexity was obviously unresolved with a simple LC-MS analysis, thereby inducing a low redundancy of identified peptides between iTRAQ series. Considering the total fractions, 2384 peptides were identified in the 18 tumors, corresponding to 1476 nonredundant peptides, but only 32% (472 peptides) were identified in all the iTRAQ series and 387 were quantified with iTRAQ reporter ions (Fig. 3A, left panel). In the TiO2 fractions, 806 peptides were identified in the tumors, corresponding to 497 nonredundant peptides whereas 139 peptides (26%) were identified in all iTRAQ series and 104 were quantified with iTRAQ reporter ions (Fig. 3B, left panel). Anyway the 387 and 104 peptides in the total and TiO2 fractions respectively were quantitatively compared between tumors and nontumors (supplemental Table S1). As iTRAQ results are expressed as ratio, data were processed using the MeV software, a dedicated suite of tools developed for transcriptomic data. The use of a nonparametric test allowed the identification of a limited set of peptides significantly over- and down-represented in tumors and p value threshold was set to introduce a maximum of one false positive peptide in the two peptides lists, corresponding to FDR = 0.02 and 0.05 for total and TiO2 fraction respectively as shown in the volcano plots (Fig. 3, volcano plots).
Fig. 3.
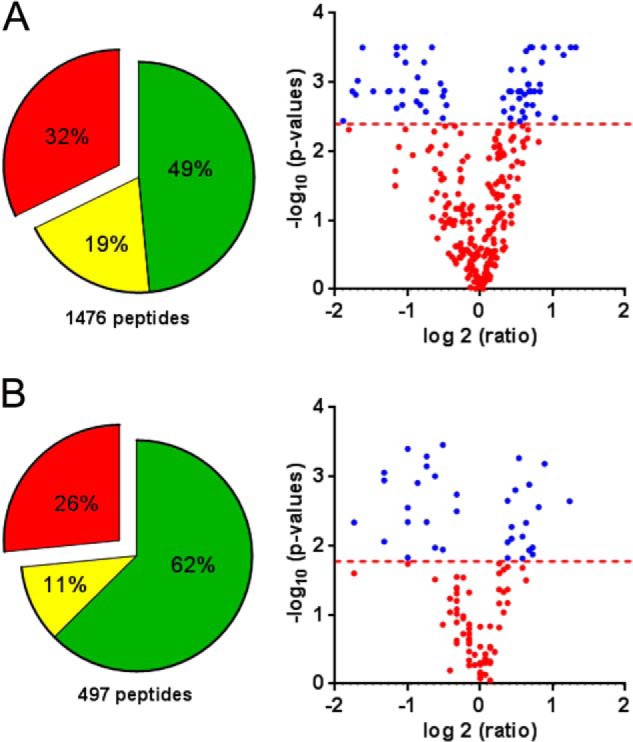
Phosphoproteomics analysis. The pie chart represents peptides identified in one series (green), 2 series (yellow), or the 3 series of tumors (red). Only the peptides identifies in the 3 series were used for statistical comparison between tumors and nontumors presented in Volcano plots. Dashed lines delimit significantly deregulated peptides (blue dots) and correspond to FDR = 0.02 and 0.05 for total fraction and TiO2 fraction respectively. A, Total peptides fraction, B, TiO2 fraction.
Quantitative Proteomics of nfHCC
The total fraction contained 67 peptides that were significantly deregulated in nfHCC. Hierarchical clustering unambiguously discriminated 36 peptides (corresponding to 30 proteins) that were enriched and 31 peptides that were significantly decreased (corresponding to 13 proteins) (Fig. 4A). The detailed list of significantly altered proteins is presented in supplemental Table S2. For most of the concerned proteins, variability in peptide content was observed, thus providing discrimination between the significant peptides and others for a given protein. Herein, we considered that our bottom-up proteomic approach identified proteins even if bottom-up proteomics identifies peptides, which cannot discriminate between the different isoforms of a same protein (i.e. post-translational modification, maturated/degraded form), Interestingly, no mixture of peptides from the same protein was observed between up- and down-regulated set. For instance, five peptides from histones were only observed as enriched in nfHCC. In the same manner, 14 peptides from alcohol dehydrogenases were exclusively found as decreased in nfHCC. These observations provided therefore another comprehensive but nonstatistical criterion for peptides validation. A functional protein interaction network was built using the String database, which demonstrated a high connectivity between the proteins overrepresented in nfHCC (Fig. 4B, red nodes). Interestingly when a functional annotation was performed using the Gene Ontology database (16), two major functional groups were found highly modified in nfHCC, namely proteins belonging to metabolic pathways (Fig. 4C, blue nodes) and protein belonging to protein homeostasis (proteostasis) regulation (Fig. 4C, purple nodes). Furthermore, in the latter functional group, all the proteins were overrepresented in nfHCC, thereby witnessing the alteration of the tumor proteostasis network. In contrast, in the functional group related to metabolic alterations, protein expression was either up- or down-regulated in nfHCC compared with normal liver (supplemental Table S3). Interestingly, 83% of these proteins were organized in a connected metabolic network (supplemental Fig. S1) thereby indicating the selective alteration of the carbohydrate metabolism (glycolysis/gluconeogenesis, hexose pathway), the fatty acid metabolism and the metabolism of xenobiotics by cytochrome p450 (supplemental Fig. S2; supplemental Table S4).
Fig. 4.

Data analysis of total fraction. A, Hierarchical clustering of peptides significantly over- (red) and under-expressed (green) in tumors compared with nontumors. B, Functional interaction network based on the String database and over/underrepresented peptides. The red nodes correspond to the overrepresented peptides and the green nodes to those underrepresented in the proteomics analysis. C, Functional interaction network based on the String database and Gene Ontology classification. The blue nodes correspond to proteins involved in metabolic pathways. The purple nodes correspond to proteins involved in the control of protein homeostasis. The yellow nodes correspond to cytoskeletal proteins. The white nodes correspond to histones and the green nodes correspond to proteins involved in translation.
Quantitative Phospho-proteomics of nfHCC
The TiO2 fraction contained 32 peptides, which were significantly deregulated in nfHCC. Hierarchical clustering unambiguously discriminated 17 overepresented phosphopeptides and 15 underrepresented phosphopeptides (Fig. 5A). A detailed and comprehensive list is presented in supplemental Table S5. Herein, a peptide grouping approach in proteins did not make any sense, as phosphopeptides were indicative of an upstream kinase activity rather than reporting for protein coverage. Interestingly however, we observed that two and four phosphopeptides belonged respectively to NUCKS1 and SRRM2. In an attempt to identify kinases-dependent pathways that were overactivated in nfHCC, we analyzed the phosphopeptides lists (up- and down-) with the p-Logo program suite (17). Phosphorylation site enrichment performed on the list of under-represented phosphopeptides did not reveal the presence of a consensual kinase phosphorylation site, although as expected a serine residue was targeted (Fig. 5B). In contrast, the same analysis revealed that a serine/proline consensus site was enriched in the tumors, thereby suggesting the activation of proline-directed kinases in nfHCC (Fig. 5C). The comparison of both enrichment plots also indicated that the S/P site enrichment in nfHCC was not caused by a bias in the analysis (e.g. dephosphorylation of this site in nontumor samples). To follow up on this observation, we analyzed the enriched phosphopeptide set using the Networkin program that predicts kinase-substrate pairs based on site prediction and experimental databases. Interestingly, five peptides were found to be predicted substrates for Proline-directed kinases, namely SRRM1, CANX, YBX1, substrates for MAPK1 and LMNA, and NUCKS1, substrates for CDK1 (Fig. 5D). These results indicated that both MAPK1 and CDK1 might be overactivated in nfHCC, an observation already made for all HCC (not discriminating the etiology) (18). To test this hypothesis in our nfHCC samples, we evaluated the phosphorylation status of MAPK1/ERK1 (relative to its activation status) in 77 nfHCC (comprising the 18 of the proteomics analysis) using the Alphascreen® technology (Fig. 6A). This analysis revealed that most of the tumors did not display highly activated MAPK1/ERK1 but also indicated a high heterogeneity between the samples (Fig. 6B). To further analyze the kinase activation status in our sample set, we evaluated the activation status of AKT, a kinase reported to promote cell survival in HCC (18), using the acoustic assay AMMP technology, which is not perturbed by samples containing optical adulterants commonly present in liver, such as heme and hemoglobin (Fig. 6C). Interestingly, although this analysis did not reveal any significant change in AKT activation between tumor and nontumor tissues, it indicated an important heterogeneity between samples, thus pointing toward the limits of biochemical tests for kinase activation in whole tumor samples (Fig. 6D).
Fig. 5.

Data analysis of TiO2 fraction. A, Hierarchical clustering of phosphopeptides significantly over- (red) and under-represented (green) in tumors compared with nontumors. B, C, Sequence Motif analysis of the two sets of phosphopeptides was performed using the pLogo software suite. Under represented phosphopeptides B, and over represented phosphopeptides C. D, Networkin-based analysis of the over represented phosphopeptide set. Yellow circles represent the substrates (phosphopeptides) and the green triangles represent their putative kinases. For Pak4, the phosphopeptide identified belongs to the kinase itself suggesting an autophosphorylation mechanism.
Fig. 6.

Kinase activity in nfHCC tumors. A, Schematic representation of ERK1 phosphorylation/activity measurement by Alphascreen. B, ERK1 phosphorylation analysis by Alphascreen in 80 nfHCC tumors (T) and 20 nontumor tissues (NT). C, Schematic representation of AKT phosphorylation/activity measurement by AMMP. D, AKT phosphorylation analysis by AMMP in 26 nfHCC tumors (T) and 7 nontumor tissues (NT).
Identification of a Kinase-regulated Proteostasis Network in nfHCC
Our proteomics data unveiled the existence of a perturbed proteostasis network comprising the cytosolic proteins HSPA1B, HSP90AA1, HSPA9, UBC, CNDP2, TXN, and VCP, the Endoplasmic Reticulum (ER) luminal proteins, HSP90B1, HSPA5, P4HB, PDIA6, and the ER resident transmembrane lectin Calnexin (CANX), whose function is regulated by phosphorylation (9, 19, 20) (Fig. 7A). The connectivity of this network was high (12 nodes, 35 edges versus 4.94 expected, Pval = 2.2e-10), thus suggesting an integrated adaptive mechanism set in place to promote tumor development (21). To confirm the deregulation of this proteostasis network in nfHCC compared with nontumoral liver, we evaluated the expression of HSP90AA1/GRP94, HSPA5/GRP78 using anti-KDEL antibodies, CANX, and VCP in 18 nfHCC compared with four nontumoral livers using immunoblot. This approach confirmed the proteomics analysis and showed that both HSP90B1 and HSPA5 were up-regulated in nfHCC tumors compared with nontumor and that the expression levels of CANX remained unchanged (Fig. 7B). Moreover, we also evaluated the phosphorylation status of CANX on ser583 in these samples. This analysis indicated that CANX was more phosphorylated in tumors than in control samples (Fig. 7B). Furthermore, the expression of VCP, CANX, and the phosphorylation of CANX were analyzed by immunohistochemistry on nfHCC sections (Fig. 7C). This again confirmed the proteomics and immunoblot results, thereby indicating the alteration of the proteostasis network in nfHCC tumors.
Fig. 7.
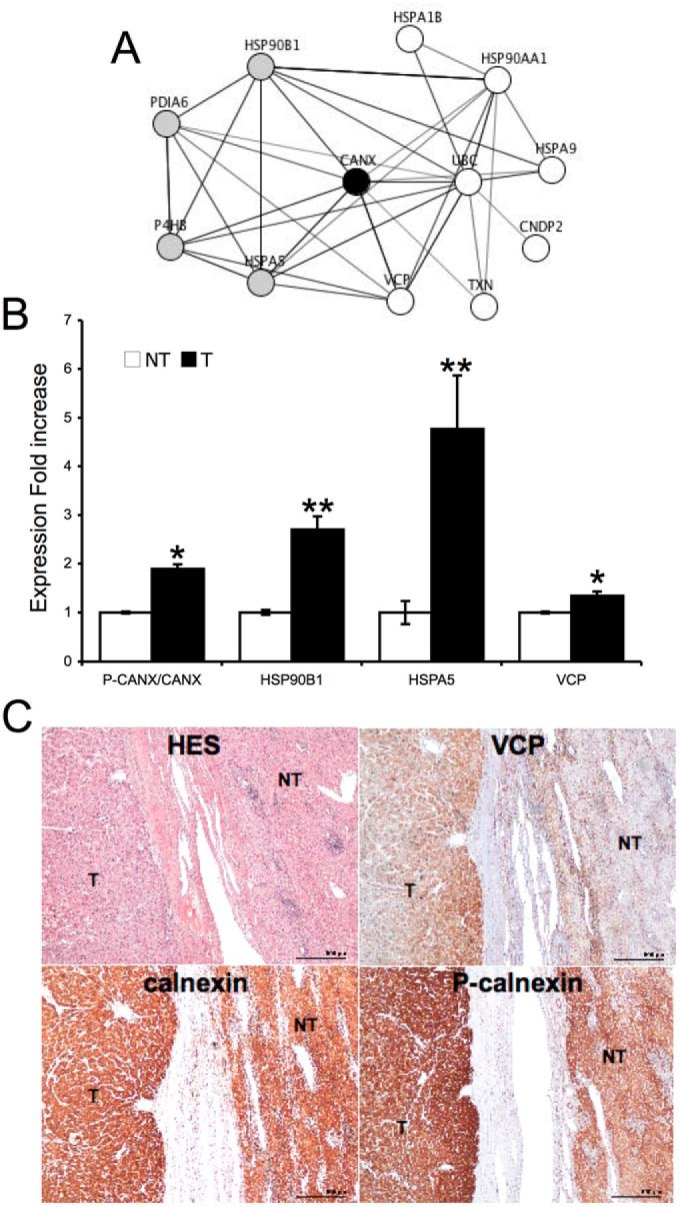
Proteostasis network in nfHCC tumors. A, Description of the nfHCC proteostasis network identified in this study. Gray nodes correspond to ER luminal proteins. White nodes correspond to cytosolic proteins. The black node corresponds Calnexin. B, Immunoblot analysis and quantification of VCP, HSP90B1/GRP94, HSPA5/GRP78, calnexin and Pser583-Calnexin in 15 nfHCC, and four nontumoral tissues. *p < 0.05; **p < 0.02 C, immunohistochemistry of VCP, calnexin and P-Calnexin (ser583) in nfHCC, and nontumor tissues. The image show is representative of 15 independent samples.
DISCUSSION
HCC developed on nonfibrotic liver (nfHCC) represents a growing class of primary liver tumors whose etiology and specificities remain poorly described. In recent years several genetic and genomic approaches have revealed that these tumors presented mutation spectra comparable to HCC developed on diseased livers. To further characterize nfHCC tumors we sought to quantitatively analyze the proteome and phosphoproteome of those tumors using an integrated experimental pipeline (Fig. 1). This analysis revealed that nfHCC tumors presented specific patterns of protein expression and phosphorylation (Figs. 3 and 4). The integration of both approaches unraveled the alteration mainly of the carbohydrate metabolism and of a highly connected protein homeostasis (proteostasis) network in nfHCC. First, it is well established that gluconeogenesis is a fundamental feature of hepatocytes, which switched to glycolysis in transformed cells (22, 23). Herein we also observe this glycolytic phenotype in nfHCC (supplemental Fig. S1) compared with normal liver. Moreover, recent work suggested the use of dexamethasone for restoring neoglucogenesis in malignant hepatocytes leading to therapeutic efficacy against HCC (24). Second, the endoplasmic reticulum (ER) folding machinery, comprising the chaperones HSP90B1 (GRP94) and HSPA5 (GRP78) and the protein disulfide isomerases (PDIA6, P4HB), presented an increased expression in nfHCC that reflected an increased demand for protein folding in the ER (25) and which could be in agreement with an enrichment of somatic mutations in genes coding for secretory proteins in those tumors (3). This network was connected with a cytosolic proteostasis control machinery including the chaperones HSPA1B, HSP90AA1, HSPA9, the thioredoxin TXN, and the degradation machinery comprising UBC, CNDP2, and VCP (21).
Both ER luminal and cytosolic networks were interconnected through the ER resident transmembrane protein calnexin (CANX). Interestingly, although the expression levels of calnexin did not vary, its phosphorylation on ser583 was increased in nfHCC tumors. Calnexin phosphorylation at this site was first reported in 1998 (19) and involved in calnexin localization (20) and functions (9, 26, 27) as a component of the protein folding machinery. Together these results indicate the global perturbation of the proteostasis network in nfHCC tumors (Fig. 7) and suggest that its overactivation, reflected by both overexpression of its components and the enhanced phosphorylation of calnexin, might confer to tumor cells a selective advantage.
Interestingly, overexpression of GRP94 and GRP78 is a surrogate marker of an ER stress (28). This physiological situation, which occurs when improperly folded proteins accumulate in the ER, triggers an adaptive signaling response named the Unfolded Protein Response (UPR; (25)). The UPR is transduced by the three ER stress sensors, namely ATF6, PERK, and IRE1 (28). Interestingly, we previously showed that IRE1 signaling led to activation of the MAPK pathway (29) and induced the phosphorylation of calnexin at ser583, thus controlling its localization and functions in ER quality control and folding (30). Moreover, it was recently shown that PDIA6, which is also up-regulated in nfHCC, is involved in the regulation of IRE1 signaling by modulating its oligomerization kinetics (31). Finally, post-translational regulations of calnexin, including phosphorylation, palmitoylation, or proteolytic processing have been linked to novel signaling functions of this protein in the control of STAT3 signaling (32), thus establishing another connection with HCC relevant signaling (33). Based on the above observations and the fact that the UPR was often found activated in human tumors, pharmacological targeting of this pathway has been proposed to represent an interesting avenue for cancer therapeutics (28).
Beyond the modulation of the UPR, proteostasis control (34) in cancer development and its therapeutic targeting has gained a lot of interest over the past 10 years. This was first illustrated by the clinically relevant use of proteasome inhibitors (e.g. Bortezomib, (35)) or HSP90 inhibitors (36, 37). Recently, the concept has been further developed by De Raedt and colleagues who have shown that agents enhancing proteotoxic stress (such as HSP90 inhibitors), induce tumor regression in aggressive mouse models, but only when combined with rapamycin (immunosuppressant drug). They demonstrate that the toxicity of reactive oxygen species produced upon HSP90 inhibition is enhanced by the suppression of glutathione by rapamycin (38).
In hepatocellular carcinoma the expression level of VCP is markedly elevated and has been shown to be associated with poor prognosis or has been associated with the presence of auto-antibodies in the serum for liver diseases (39, 40), proposing p97/CDC-48 expression levels as a useful marker for the progression of these cancers. Moreover, we found that the alteration of VCP function upon sorafenib treatment impaired protein secretion and led to cell death in HCC cells (41). Overall, these observations suggest that p97/CDC-48 or its plethora of adaptor molecules may be potential molecular targets for the treatment of nfHCC. VCP inhibitors have been reported in the literature (21, 28), thus providing new pharmacological tools for preclinical analyses on HCC.
Collectively, our data unravel the perturbation of the proteostasis network in nfHCC and lead us to propose that its pharmacological targeting, for instance through the inhibition of the proteasome, HSP90 or VCP might represent an interesting strategy either to avoid surgery or to reduce tumor volume to allow surgery on cases that would not have been resected before.
The mass spectrometry proteomics data have been deposited to the ProteomeXchange Consortium (http://proteomecentral.proteomexchange.org) via the PRIDE partner repository with the data set identifier PXD001253.
Supplementary Material
Acknowledgments
We thank Laurent Possenti (CHU Bordeaux, Bordeaux, France) for his help with CRB patient data.
Footnotes
Author contributions: L.N., J.R., and E.C. designed research; L.N., S.T., D.A., N.P., K.L., L.B., and E.C. performed research; K.L., L.B., M.L., R.B., C.B., J.S., P.B., and J.Z. contributed new reagents or analytic tools; L.N., S.T., M.L., R.B., J.S., P.B., J.Z., J.R., and E.C. analyzed data; L.N. and E.C. wrote the paper.
* This work was supported by the Institut National du Cancer (INCa) with the ICGC project, the PAIR-CHC project NoFLIC (funded by INCa and Association pour la recherche contre le Cancer, ARC), the French CRB Liver tumors and Tumorotheque CHU Bordeaux.
 This article contains supplemental Figs. S1 and S2 and Tables S1 to S5.
1 The abbreviations used are:
- HCC
- hepatocellular carcinoma
- nfHCC
- nonfibrotic hepatocellular carcinoma
- SILAC
- stable isotope labeling by amino acids in cell culture
- iTRAQ
- isobaric tags for relative and absolute quantification
- CDIT
- culture-derived isotope tags.
REFERENCES
- 1. Padhya K. T., Marrero J. A., Singal A. G. (2013) Recent advances in the treatment of hepatocellular carcinoma. Curr. Opin. Gastroenterol. 29, 285–292 [DOI] [PubMed] [Google Scholar]
- 2. Hernandez-Gea V., Toffanin S., Friedman S. L., Llovet J. M. (2013) Role of the microenvironment in the pathogenesis and treatment of hepatocellular carcinoma. Gastroenterology 144, 512–527 [DOI] [PMC free article] [PubMed] [Google Scholar]
- 3. Guichard C., Amaddeo G., Imbeaud S., Ladeiro Y., Pelletier L., Maad I. B., Calderaro J., Bioulac-Sage P., Letexier M., Degos F., Clement B., Balabaud C., Chevet E., Laurent A., Couchy G., Letouze E., Calvo F., Zucman-Rossi J. (2012) Integrated analysis of somatic mutations and focal copy-number changes identifies key genes and pathways in hepatocellular carcinoma. Nat. Genet. 44, 694–698 [DOI] [PMC free article] [PubMed] [Google Scholar]
- 4. Breuhahn K., Gores G., Schirmacher P. (2011) Strategies for hepatocellular carcinoma therapy and diagnostics: lessons learned from high throughput and profiling approaches. Hepatology 53, 2112–2121 [DOI] [PubMed] [Google Scholar]
- 5. Nie W., Yan L., Lee Y. H., Guha C., Kurland I. J., Lu H. (2014) Advanced mass spectrometry-based multi-omics technologies for exploring the pathogenesis of hepatocellular carcinoma. Mass Spectrom. Rev. Available at: http://onlinelibrary.wiley.com/doi/10.1002/mas.21439/abstract [DOI] [PubMed]
- 6. Branza-Nichita N., Petrareanu C., Lazar C., Sokolowska I., Darie C. C. (2014) Using proteomics to unravel the mysterious steps of the HBV-life-cycle. Adv. Exp. Med. Biol. 806, 453–481 [DOI] [PubMed] [Google Scholar]
- 7. Balch W. E., Morimoto R. I., Dillin A., Kelly J. W. (2008) Adapting proteostasis for disease intervention. Science 319, 916–919 [DOI] [PubMed] [Google Scholar]
- 8. Kim Y. E., Hipp M. S., Bracher A., Hayer-Hartl M., Hartl F. U. (2013) Molecular chaperone functions in protein folding and proteostasis. Annu. Rev. Biochem. 82, 323–355 [DOI] [PubMed] [Google Scholar]
- 9. Chevet E., Wong H. N., Gerber D., Cochet C., Fazel A., Cameron P. H., Gushue J. N., Thomas D. Y., Bergeron J. J. (1999) Phosphorylation by CK2 and MAPK enhances calnexin association with ribosomes. EMBO J. 18, 3655–3666 [DOI] [PMC free article] [PubMed] [Google Scholar]
- 10. Negroni L., Claverol S., Rosenbaum J., Chevet E., Bonneu M., Schmitter J. M. (2012) Comparison of IMAC and MOAC for phosphopeptide enrichment by column chromatography. J. Chromatogr. B Analyt. Technol. Biomed. Life Sci. 891–892, 109–112 [DOI] [PubMed] [Google Scholar]
- 11. Saeed A. I., Bhagabati N. K., Braisted J. C., Liang W., Sharov V., Howe E. A., Li J., Thiagarajan M., White J. A., Quackenbush J. (2006) TM4 microarray software suite. Methods Enzymol. 411, 134–193 [DOI] [PubMed] [Google Scholar]
- 12. Snel B., Lehmann G., Bork P., Huynen M. A. (2000) STRING: a web-server to retrieve and display the repeatedly occurring neighbourhood of a gene. Nucleic Acids Res. 28, 3442–3444 [DOI] [PMC free article] [PubMed] [Google Scholar]
- 13. Linding R., Jensen L. J., Ostheimer G. J., van Vugt M. A., Jorgensen C., Miron I. M., Diella F., Colwill K., Taylor L., Elder K., Metalnikov P., Nguyen V., Pasculescu A., Jin J., Park J. G., Samson L. D., Woodgett J. R., Russell R. B., Bork P., Yaffe M. B., Pawson T. (2007) Systematic discovery of in vivo phosphorylation networks. Cell 129, 1415–1426 [DOI] [PMC free article] [PubMed] [Google Scholar]
- 14. Linding R., Jensen L. J., Pasculescu A., Olhovsky M., Colwill K., Bork P., Yaffe M. B., Pawson T. (2008) NetworKIN: a resource for exploring cellular phosphorylation networks. Nucleic Acids Res. 36, D695–699 [DOI] [PMC free article] [PubMed] [Google Scholar]
- 15. Lepreux S., Bioulac-Sage P., Chevet E. (2012) Differential expression of the anterior gradient protein-2 is a conserved feature during morphogenesis and carcinogenesis of the biliary tree. Liver Int. 31, 322–328 [DOI] [PubMed] [Google Scholar]
- 16. Ashburner M., Ball C. A., Blake J. A., Botstein D., Butler H., Cherry J. M., Davis A. P., Dolinski K., Dwight S. S., Eppig J. T., Harris M. A., Hill D. P., Issel-Tarver L., Kasarskis A., Lewis S., Matese J. C., Richardson J. E., Ringwald M., Rubin G. M., Sherlock G. (2000) Gene ontology: tool for the unification of biology. The Gene Ontology Consortium. Nat. Genet. 25, 25–29 [DOI] [PMC free article] [PubMed] [Google Scholar]
- 17. O'Shea J. P., Chou M. F., Quader S. A., Ryan J. K., Church G. M., Schwartz D. (2013) pLogo: a probabilistic approach to visualizing sequence motifs. Nat. Methods 10, 1211–1212 [DOI] [PubMed] [Google Scholar]
- 18. Whittaker S., Marais R., Zhu A. X. (2010) The role of signaling pathways in the development and treatment of hepatocellular carcinoma. Oncogene 29, 4989–5005 [DOI] [PubMed] [Google Scholar]
- 19. Wong H. N., Ward M. A., Bell A. W., Chevet E., Bains S., Blackstock W. P., Solari R., Thomas D. Y., Bergeron J. J. (1998) Conserved in vivo phosphorylation of calnexin at casein kinase II sites as well as a protein kinase C/proline-directed kinase site. J. Biol. Chem. 273, 17227–17235 [DOI] [PubMed] [Google Scholar]
- 20. Chevet E., Smirle J., Cameron P. H., Thomas D. Y., Bergeron J. J. (2010) Calnexin phosphorylation: linking cytoplasmic signaling to endoplasmic reticulum lumenal functions. Semin. Cell Dev. Biol. 21, 486–490 [DOI] [PubMed] [Google Scholar]
- 21. Fessart D., Marza E., Taouji S., Delom F., Chevet E. (2013) P97/CDC-48: proteostasis control in tumor cell biology. Cancer Lett. 337, 26–34 [DOI] [PubMed] [Google Scholar]
- 22. Bannasch P., Klimek F., Mayer D. (1997) Early bioenergetic changes in hepatocarcinogenesis: preneoplastic phenotypes mimic responses to insulin and thyroid hormone. J. Bioenerg. Biomembr. 29, 303–313 [DOI] [PubMed] [Google Scholar]
- 23. Bannasch P. (2012) Glycogenotic hepatocellular carcinoma with glycogen-ground-glass hepatocytes: a heuristically highly relevant phenotype. World J. Gastroenterol. 18, 6701–6708 [DOI] [PMC free article] [PubMed] [Google Scholar]
- 24. Ma R., Zhang W., Tang K., Zhang H., Zhang Y., Li D., Li Y., Xu P., Luo S., Cai W., Ji T., Katirai F., Ye D., Huang B. (2013) Switch of glycolysis to gluconeogenesis by dexamethasone for treatment of hepatocarcinoma. Nat. Commun. 4, 2508. [DOI] [PubMed] [Google Scholar]
- 25. Dejeans N., Manie S., Hetz C., Bard F., Hupp T., Agostinis P., Samali A., Chevet E. (2014) Addicted to secrete - novel concepts and targets in cancer therapy. Trends Mol. Med. 20, 242–250 [DOI] [PubMed] [Google Scholar]
- 26. Lakkaraju A. K., Abrami L., Lemmin T., Blaskovic S., Kunz B., Kihara A., Dal Peraro M., van der Goot F. G. (2011) Palmitoylated calnexin is a key component of the ribosome-translocon complex. EMBO J. 31, 1823–1835 [DOI] [PMC free article] [PubMed] [Google Scholar]
- 27. Lynes E. M., Bui M., Yap M. C., Benson M. D., Schneider B., Ellgaard L., Berthiaume L. G., Simmen T. (2011) Palmitoylated TMX and calnexin target to the mitochondria-associated membrane. EMBO J. 31, 457–470 [DOI] [PMC free article] [PubMed] [Google Scholar]
- 28. Hetz C., Chevet E., Harding H. P. (2013) Targeting the unfolded protein response in disease. Nat. Rev. Drug Discov. 12, 703–719 [DOI] [PubMed] [Google Scholar]
- 29. Nguyen D. T., Kebache S., Fazel A., Wong H. N., Jenna S., Emadali A., Lee E. H., Bergeron J. J., Kaufman R. J., Larose L., Chevet E. (2004) Nck-dependent activation of extracellular signal-regulated kinase-1 and regulation of cell survival during endoplasmic reticulum stress. Mol. Biol. Cell 15, 4248–4260 [DOI] [PMC free article] [PubMed] [Google Scholar]
- 30. Cameron P. H., Chevet E., Pluquet O., Thomas D. Y., Bergeron J. J. (2009) Calnexin phosphorylation attenuates the release of partially misfolded alpha1-antitrypsin to the secretory pathway. J. Biol. Chem. 284, 34570–34579 [DOI] [PMC free article] [PubMed] [Google Scholar]
- 31. Eletto D., Dersh D., Gidalevitz T., Argon Y. (2014) Protein disulfide isomerase A6 controls the decay of IRE1alpha signaling via disulfide-dependent association. Mol. Cell 53, 562–576 [DOI] [PMC free article] [PubMed] [Google Scholar]
- 32. Lakkaraju A. K., van der Goot F. G. (2013) Calnexin controls the STAT3-mediated transcriptional response to EGF. Mol. Cell 51, 386–396 [DOI] [PubMed] [Google Scholar]
- 33. He G., Karin M. (2010) NF-kappaB and STAT3 - key players in liver inflammation and cancer. Cell Res. 21, 159–168 [DOI] [PMC free article] [PubMed] [Google Scholar]
- 34. Powers E. T., Morimoto R. I., Dillin A., Kelly J. W., Balch W. E. (2009) Biological and chemical approaches to diseases of proteostasis deficiency. Annu. Rev. Biochem. 78, 959–991 [DOI] [PubMed] [Google Scholar]
- 35. Kisselev A. F., van der Linden W. A., Overkleeft H. S. (2012) Proteasome inhibitors: an expanding army attacking a unique target. Chem. Biol. 19, 99–115 [DOI] [PMC free article] [PubMed] [Google Scholar]
- 36. Jhaveri K., Taldone T., Modi S., Chiosis G. (2012) Advances in the clinical development of heat shock protein 90 (Hsp90) inhibitors in cancers. Biochim. Biophys. Acta 1823, 742–755 [DOI] [PMC free article] [PubMed] [Google Scholar]
- 37. Jhaveri K., Modi S. (2012) HSP90 inhibitors for cancer therapy and overcoming drug resistance. Adv. Pharmacol. 65, 471–517 [DOI] [PubMed] [Google Scholar]
- 38. De Raedt T., Walton Z., Yecies J. L., Li D., Chen Y., Malone C. F., Maertens O., Jeong S. M., Bronson R. T., Lebleu V., Kalluri R., Normant E., Haigis M. C., Manning B. D., Wong K. K., Macleod K. F., Cichowski K. (2011) Exploiting cancer cell vulnerabilities to develop a combination therapy for ras-driven tumors. Cancer Cell 20, 400–413 [DOI] [PMC free article] [PubMed] [Google Scholar]
- 39. Yamamoto S., Tomita Y., Nakamori S., Hoshida Y., Nagano H., Dono K., Umeshita K., Sakon M., Monden M., Aozasa K. (2003) Elevated expression of valosin-containing protein (p97) in hepatocellular carcinoma is correlated with increased incidence of tumor recurrence. J. Clin. Oncol. 21, 447–452 [DOI] [PubMed] [Google Scholar]
- 40. Miyachi K., Hosaka H., Nakamura N., Miyakawa H., Mimori T., Shibata M., Matsushima S., Chinoh H., Horigome T., Hankins R. W., Zhang M., Fritzler M. J. (2006) Anti-p97/VCP antibodies: an autoantibody marker for a subset of primary biliary cirrhosis patients with milder disease? Scand. J. Immunol. 63, 376–382 [DOI] [PubMed] [Google Scholar]
- 41. Yi P., Higa A., Taouji S., Bexiga M. G., Marza E., Arma D., Castain C., Le Bail B., Simpson J. C., Rosenbaum J., Balabaud C., Bioulac-Sage P., Blanc J. F., Chevet E. (2012) Sorafenib-mediated targeting of the AAA(+) ATPase p97/VCP leads to disruption of the secretory pathway, endoplasmic reticulum stress, and hepatocellular cancer cell death. Mol. Cancer Ther. 11, 2610–2620 [DOI] [PubMed] [Google Scholar]
Associated Data
This section collects any data citations, data availability statements, or supplementary materials included in this article.