

Abstract
One of the limiting factors in determining the sensitivity of tandem mass spectrometry using hybrid quadrupole orthogonal acceleration time-of-flight instruments is the duty cycle of the orthogonal ion injection system. As a consequence, only a fraction of the generated fragment ion beam is collected by the time-of-flight analyzer. Here we describe a method utilizing postfragmentation ion mobility spectrometry of peptide fragment ions in conjunction with mobility time synchronized orthogonal ion injection leading to a substantially improved duty cycle and a concomitant improvement in sensitivity of up to 10-fold for bottom-up proteomic experiments. This enabled the identification of 7500 human proteins within 1 day and 8600 phosphorylation sites within 5 h of LC-MS/MS time. The method also proved powerful for multiplexed quantification experiments using tandem mass tags exemplified by the chemoproteomic interaction analysis of histone deacetylases with Trichostatin A.
Mass spectrometry-based proteomics enables the large scale interrogation of proteins to study time and cell-type dependent protein expression, posttranslational modifications, protein degradation, protein interactions, as well as protein activities (1). The de-facto standard analytical platform for the identification and quantification of peptides and proteins is the coupling of reversed phase liquid chromatography to nano-electrospray ionization tandem mass spectrometry (LC-MS/MS)1 (2). The field is still driven by advances in chromatographic and mass spectrometric technology, which enables the analysis of ever more complex proteomes at ever-decreasing time and sample quantity requirements (3–5). In particular, hybrid tandem mass spectrometers such as ion trap-orbitrap, quadrupole-orbitrap and quadrupole-time-of-flight (Q-TOF) instruments have dominated the field for many years. These configurations offer high data acquisition speed and high mass accuracy for peptide precursor and fragment ions both of which are advantageous when analyzing complex proteomes (6).
Although it is technically possible to acquire tandem mass spectra at a rate of up to 100 Hz (7) on Q-TOF instruments, only relatively few of these contain a sufficient number of fragment ions to yield a productive peptide identification. One reason for this is the low duty cycle of orthogonal acceleration (oa) TOF instruments, which is a consequence of sampling a continuous ion beam into an orthogonally mounted pulsed mass analyzer. The duty cycle of such instruments is given by:
 |
In which Wb is the width of the ion beam pulsed orthogonally into the TOF, Sep is the distance from the pusher to the TOF detector, mass is the mass of an ion of interest and max.mass is the maximum mass of the detection system. The geometrical figure Wb/Sep is typically 0.25 for commercial oaTOF mass spectrometers. The sampling of the fragment ion packet into the oa-TOF is normally selected such that consecutive spectra do not overlap, that is, that the heaviest ions have time to reach the detection system, leading to the second (mass dependent) term in the equation (8). As a consequence, the practical duty cycle of Q-TOF instruments is often no higher than about 10%, leading to substantial losses in sensitivity. Past approaches addressing this limitation have not lead to entirely satisfactory results for the analysis of complex mixtures by LC-MS/MS (9–11). For example, Chernushevich and colleagues were able to improve the duty cycle to up to 100% by trapping ions in the collision cell and using short ejection bursts synchronized with the oaTOF extraction (12). However, this method had the limitation that the maximum improvement could only be achieved over a small mass range. Similarly, Gilles and co-workers demonstrated that including ion mobility separation of ions can lead to 100% duty cycle, again, over a small mass range (11).
In this manuscript, we show that traveling wave ion mobility spectrometry (TWIMS) (13, 14), on peptide fragment ions prior to their measurement in the oaTOF analyzer greatly improves the duty cycle over a wide mass range and, therefore, sensitivity of tandem mass spectrometry of peptides. This consequently allows for faster data acquisition rates leading to improved peptide identification and quantification rates in bottom up proteomics.
EXPERIMENTAL PROCEDURES
Sample Preparation
Mycoplasma-free HeLa S3 cervix carcinoma cells (DMSZ, Braunschweig, Germany) were cultured in Dulbecco's Modified Eagle Medium (DMEM) with high glucose (PAA, Pasching, Austria) supplemented with 10% (v/v) fetal bovine serum (FBS, PAA, Pasching, Austria) at 37 °C in humidified air and 10% CO2. Cells were washed with phosphate buffered saline (PBS) and harvested by lysis using 50 mm Tris/HCl pH 7.5, 5% glycerol, 1.5 mm MgCl2, 150 mm NaCl, 0.8% Nonidet P-40, 1 mm dithiothreitol, and 25 mm NaF with freshly added protease inhibitors and phosphatase inhibitors (5× phosphatase inhibitor mixture 1 (Sigma-Aldrich, Munich, Germany), 5× phosphatase inhibitor mixture 2, (Sigma-Aldrich, Munich, Germany), 1 mm sodium ortho-vanadate, and 20 nm Calyculin A (LC Laboratories, Woburn, MA)). Protein extracts were clarified by ultracentrifugation for 1 h at 145,000 × g at 4 °C and protein concentration was determined by the Bradford method (Coomassie (Bradford) Protein Assay Kit, Thermo Scientific, Dreieich, Germany). Lysates were denatured in 8 m urea and 0.1 m Tris/HCl, subsequently diluted to 2 m urea followed by protein digestion with trypsin (Promega Corp., Madison, WI) according to the FASP protocol (15). After overnight digestion, peptides were eluted from the filters with 50 mm TEAB and purified on C18 StageTips as described (16). Human epidermoid A431 cells used for IMAC phosphopeptide enrichment experiments were grown in Iscove's Modified Dulbecco's Medium (IMDM) medium supplemented with 10% (v/v) FBS and 1% antibiotic/antimycotic solution. Prior to lysis, cells were treated with 1 mm sodium ortho-vanadate for 10 min. After harvesting, cells were washed twice with ice cold PBS and lysed in 8 m Urea, 50 mm TEAB, 1× EDTA free protease inhibitor mixture (complete mini, Roche, Germany), 1 mm sodium ortho-vanadate and Phosphatase inhibitor mixture (Sigma-Aldrich, Munich, Germany). The lysate was centrifuged at 14,500 rpm for 1 h at 4 °C. Protein concentration was determined using the Bradford method. Proteins in the supernatant were reduced with 10 mm DTT at 56 °C for 1 h and alkylated with 55 mm chloro-acetamide for 45 min at room temperature in the dark. The protein mixture was diluted 5-fold with 50 mm TEAB to reduce the urea concentration to 1.6 m. A first digestion was performed using sequencing grade trypsin (Promega; 1:100 enzyme:substrate ratio) and incubation at 37 °C for 4 h. Subsequently, a second aliquot of 1:100 trypsin was added. After digestion at 37 °C overnight, samples were acidified with formic acid (FA). SepPack columns (C18 cartridges Sep-Pak Vac 1cc [50 mg], Waters Corp., Manchester, UK) were used for peptide desalting and concentration, and eluates were dried in a vacuum centrifuge and stored at −80 °C. IMAC enrichment of phosphopeptides from human cell lines was performed as described (17). For the tissue proteomes, 50 μg of lysate were reduced, alkylated (see above) and separated via an LDS-PAGE gel and cut into 12 equally sized bands. In-gel trypsin digestion was performed according to standard procedures (18). The chemoproteomic profiling of Trichostatin A was performed according to Bantscheff et al. (19).
LC-MS/MS Measurements
Liquid chromatography tandem mass spectrometry was performed by coupling a nanaoAcquity UPLC (Waters Corp., Manchester, UK) to a Q-TOF SYNAPT G2Si instrument (Waters Corp., Manchester, UK). Unless otherwise described, 1 μg of the HeLa digest was delivered to a trap column (180 μm × 20 mm nanoAcquity UPLC 2G-V/MTrap 5 μm Symmetry C18, Waters Corp, Manchester, UK) at a flow rate of 5 μl/min in 99.9% solvent A (0.1% FA, in HPLC grade water). After 3 min of loading and washing, peptides were transferred to an analytical column (75 μm × 250 mm nanoAcquity UPLC 1.8 μm HSST3, Waters Corp, Manchester, UK) and separated at a flow rate of 300 nL/min using a gradient from 1% to 40% solvent B (0.1% FA in acetonitrile) of varying length (15–360 min). The gel cuts for the tissue proteomes were analyzed using a 90 min gradient with a total turnaround time of 2 h. The eluent was sprayed via PicoTip Emitters (Waters Corp, Manchester, UK) at a spray voltage of 2.6–3.0 kV and a sampling cone voltage of 25 V and a source offset of 30 V. The source temperature was set to 100 °C. The cone gas flow was 20 liters/h with a nano flow gas pressure of 0.4 bar and the purge gas was turned off. The SYNAPT G2Si instrument was operated in data-dependent mode, automatically switching between MS and MS2. Full scan MS and MS2 spectra (m/z 50 - 5000) were acquired in resolution mode (20,000 resolution FWHM at m/z 400). MS spectra were acquired using a fixed acquisition time of 150 ms. Tandem mass spectra of up to 12 precursors were generated in the trapping region of the ion mobility cell by using a collisional energy ramp from 6/9 V (low mass, start/end) to up to 147/183 V (high mass, start/end). For the TMT samples, the collision energy ramp was adjusted by +2 V resulting in more efficient fragmentation. The precursor ion isolation width of the quadrupole was set to 2.0 Th (low mass resolution 10, high mass resolution 15). The MS2 scan time was set to 80 ms and the “TIC stop” parameter was set to 500,000 intensity/s allowing a maximum accumulation time of 250 ms (i.e. up to three tandem MS spectra of the same precursor). Dynamic exclusion of fragmented precursor ions was enabled and the exclusion time window was set to 30 s. For HD-DDA methods using the IMS configuration, a variable IMS wave velocity was used. Wave velocity was ramped from 2500 m/s to 400 m/s (start to end) and the ramp was applied over the full IMS cycle. A manual release time of 500 μs was set for the mobility trapping and a trap height of 15 V with an extract height of 0 V. The IMS wave delay was set to 1000 μs for the mobility separation after trap release. The pusher/ion mobility synchronization for the HD-DDA method was performed using MassLynx VRP1214 and DriftScope v2.4. LockSpray of Glufibrinopeptide-B (m/z 785.8427) was acquired every 60 s and lock mass correction was applied post acquisition. For DDA experiments, the basic settings were the same as for HD-DDA but using a reduced mass range of 50–2000 m/z and without fragment separation via ion mobility.
Peptide and Protein Identification and Quantification
Raw MS data were either processed by Mascot Distiller (version 2.4.3.1) for peptide and protein identification and isobaric quantification or by Progenesis QI (Nonlinear Dynamics, United Kingdom) for label free quantification. MS/MS spectra were searched against the Uniprot human database (release date July 21, 2013 containing 88,354 sequences and including the PFAM domain identifiers for each entry) using the Mascot search engine (version 2.4.1) with the following search parameters: full tryptic specificity, up to two missed cleavage sites; carbamidomethylation of cysteine residues was set as a fixed modification and N-terminal protein acetylation and methionine oxidation as variable modifications. For phosphopeptide enriched samples also phosphorylation for serine, threonine, and tyrosine was selected as variable modification. In order to obtain the quantification result for the chemoproteomic profiling, TMT 6-plex was selected as quantification method in Mascot. Mass spectra were recalibrated within Mascot Distiller and searched with a mass tolerance of 25 ppm. Fragment ion mass tolerance was set to 0.1 Da. Mascot search results were further processed using the Percolator algorithm (20, 21) and subsequently loaded into Scaffold (v4.1.1). The data was filtered using a Mascot Percolator score of 13, corresponding to a posterior error probability (PEP) of 0.05. The resulting protein false discovery rate (FDR) was 0.2% for the data shown in Fig. 3 (different gradient times), 0.4% for the tissue proteomes shown in Fig. 4 and 3.8% for the chemoproteomic experiment shown in Fig. 5. Please note that fewer than 300 proteins were contained in the latter experiment, which renders the protein FDR estimate less meaningful. Mascot search results of the phosphopeptide analysis were further analyzed by the percolator algorithm embedded in the program RockerBox (22). Subsequently, the data was filtered at a peptide spectrum match (PSM) FDR of 0.01 and an additional Mascot ion score cut off of 14 was applied (23). Phosphopeptide sequences were filtered for redundancy in order to obtain the number of identified phosphopeptides. The number of unique phosphopeptide sequences was determined by counting only nonredundant peptide sequences, regardless of how many and where phosphorylation events occurred within the peptide. False localization rates (FLR) for confidently assigned phospho-sites (<0.05 FLR) were estimated using the Mascot Delta Score as described previously (23, 24).TMT quantification was performed by Mascot using default settings (minimum of two peptides, ion score above homology threshold, automatic outlier removal, and intensity weighted ratio calculation). Visualization of quantitative data was performed using GraphPad Prism v5.03.
Fig. 3.

Performance evaluation of the HD-DDA method at varying LC gradient times. A, Triplicate analysis of 1.000 ng of HeLa digest using gradient lengths from 15′ to 360′. B, Quantitative reproducibility of two 60′ gradient replicates based on peptide precursor intensity. C, Characteristics of the number of eluting (peptide) features (dashed line) as well as the rate of identification of eluting features and acquired tandem mass spectra at different LC gradient times. D, Qualitative reproducibility of two 60′ gradient replicates based on the number of identified proteins and peptides.
Fig. 4.

Proteome profiles of eight human organs using a total of 24h of LC-MS/MS time per organ.
Fig. 5.

Evaluation of the suitability of HD-DDA for PTM analysis and MS/MS based quantification. A, Analysis of IMAC enriched phosphopeptides in two technical replicates using 5 h total analysis time. B, TMT-quantification of the interaction of Trichostatin A with cellular proteins employing a competition binding assay using immobilized SAHA and increasing doses of Trichostatin A.
Data Availability
The mass spectrometric raw files were converted into mz5 (25) format using ProteoWizard (26) (version 3.0.5245 64-bit). The mz5 files are available along with peaklist files (mgf format) and search result files (Scaffold files and Scaffold exported protein and peptide lists) via proteomeXchange (27) (http://www.proteomexchange.org; accession number PXD000863).
RESULTS AND DISCUSSION
In this study, we integrated the use of traveling wave ion mobility spectrometry (TWIMS) (13, 14), available on a commercial mass spectrometer with the established data dependent acquisition scheme (DDA) typically used in bottom-up proteomics (termed high definition or HD-DDA). As will become apparent below, this enhances the duty cycle of the instrument and, therefore, sensitivity (Fig. 1A, supplemental Fig. S1). The principle and performance characteristics of TWIMS have been described before (11). Briefly, in the instance of tryptic peptides, TWIMS separation is dependent upon the ions charge and ions are nested, for a given charge state, by mass and drift time. This charge state separation and nesting can be used to discriminate against single charge background and to focus upon and select exclusively multiply charged peptides (or other components) for tandem MS. Subsequently, peptide precursor ions are sequentially selected by the quadrupole mass analyzer and fragmented by collision induced dissociation (CID) in the first stacked ring ion guide of the tri-wave device and prior to reaching the ion mobility cell (supplemental Fig. S1). Product ions are trapped within this first traveling wave region of the tri-wave device and gated into the high-pressure ion mobility cell where they are separated according to their gas phase mobility within the cell, which is predominantly determined by mass, charge, size, and shape. As a result, fragment ions of the same mobility exit the cell as a series of compact packets. Hence, by synchronizing the pusher pulse that accelerates the fragment ions into the oa-TOF mass analyzer with the arrival of product ions from the TWIMS cell into the pusher region, fragment ions are sequentially injected into the TOF analyzer with greatly enhanced duty cycle (∼100%) across the mass scale (11). This leads to a concomitant increase in sensitivity. Each ion mobility separation occurs over a time scale of ∼10 ms and consists of 200 discrete bins. Each mobility time bin contains a part of the full spectrum and, therefore, the complete tandem mass spectrum of a peptide is acquired by integrating the signal across the entire mobility separation. Because the ion mobility time frame is in the order of milliseconds, it nests well between the timeframe of liquid chromatography (seconds) and the oa-TOF mass spectrometer which operates in the microsecond timeframe.
Fig. 1.
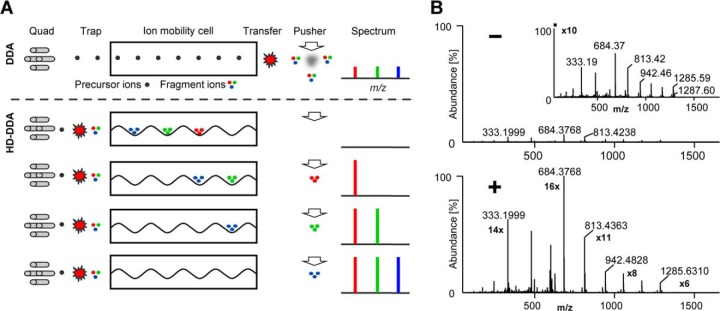
Synchronization of fragment ion mobility and pusher frequency improves the system performance of a Q-TOF instrument. A, Schematic illustration of operation of conventional DDA (above dashed line) and HD-DDA (below dashed line) on a Q-TOF instrument. B, Tandem mass spectrum of GluFib without (-) and with (+) fragment ion mobility synchronization enabled. The insert shows the 10x magnified tandem mass spectrum of the conventional DDA experiment.
For a single peptide, HD-DDA lead to an average of ∼10-fold higher fragment ion intensity compared with the respective DDA experiment without TWIMS based concentration of fragment ions (Fig. 1B). We next tested the merits of the approach using a dilution series of shotgun digested HeLa cell lysates (Fig. 2A, supplemental Table S1). HD-DDA analysis identified >2000 proteins (>7000 peptides) from 1 μg of digest on column using a 60′ LC gradient. The method also more than doubled the number of identified proteins at any point across the dilution series and improved the detection limit 10-fold over classical DDA. The increased quality of HD-DDA tandem mass spectra allowed for a 60% higher average acquisition rate of tandem mass spectra compared with DDA (6.5 Hz vs. 4 Hz, Fig. 2B). For the same reason, Mascot identification scores increased by ∼40% (corresponding to 2.5-fold better identification probability because the Mascot ion score is a log10 score, supplemental Fig. S2A), thereby giving more confidence in the assigned peptides compared with DDA data. Another consequence of the improved MS2 data quality was an increase in the productivity of peptide identification from ∼25% to ∼50% of all acquired CID spectra (supplemental Fig. S2B).
Fig. 2.
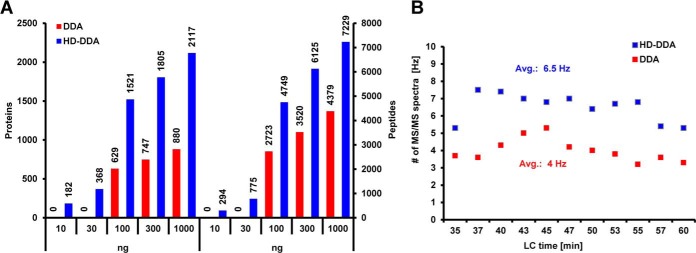
Performance comparison regarding sensitivity of the HD-DDA and DDA methods. A, Dilution series of a HeLa digest from 1.000 ng to 10 ng on column (each analyzed on a 60-min LC-gradient) via DDA (red) and HD-DDA (blue), illustrating the differences of both methods for peptide and protein identification. B, Comparison of the rate of tandem mass spectrum acquisition (in Hz) across the LC-gradient for DDA (red) and HD-DDA (blue).
We next asked how HD-DDA measurements would impact sample throughput and depth of proteome coverage. The number of identifications from triplicate analysis of HeLa digests ranged from ∼900 proteins (2600 peptides) using a 15′ LC gradient to ∼4400 proteins (20,000 peptides) using a 6 h gradient (Fig. 3A, supplemental Table S2, supplemental Fig. S3). The high number of protein identifications at very short separation times makes HD-DDA an interesting option for the analysis of simple proteomes (e.g. protein complexes obtained by affinity purification) or for the targeted analysis of particular proteins within a given sample). The apparent reproducibility of the number of protein and peptide identifications was surprisingly high (illustrated by the very tight error bars in Fig. 3A). Although reproducibility in terms of signal intensity was also very high (Fig. 3B, supplemental Fig. S4), closer inspection revealed that the actual protein and peptide recall rates were much lower (Fig. 3C, supplemental Fig. S5). For example, for 60′ gradients, only 62% of all proteins and 39% of all peptides were identified in all replicates. As one would expect, recall rates were worse for 15′ gradients (55% of all proteins and 33% of all peptides were identified in all replicates) but better for 360′ gradients where identification recalls increased to 71% for proteins and 47% for peptides (supplemental Fig. S5). As noted before (28) and confirmed here again, this data indicates that the number of peptides present in shotgun digests of cell lines still overwhelms the capacity of the mass spectrometer highlighting the need for yet further improvements in the speed of data acquisition (see also below). We observed that there was little improvement in recall rates beyond gradients of 90′ and that the number of detected (peptide) features in MS1 spectra also stabilized at a gradient time of 90′ (Fig. 3D). In addition, the identification rate of the acquired tandem mass spectra also maximized for 90′ gradients indicating that this is the most productive setting for our particular LC-MS/MS setup, which is why we used this method for subsequent experiments.
To illustrate the usefulness of the developed HD-DDA method, we applied it to a number of topics frequently investigated in current proteome research. The first concerns the proteomic profiling of human tissues. This type of analysis is more challenging than that of cell lines grown in culture because of the presence of proteins from, for example, body fluids or connective tissue, which both increases the number of proteins present as well as the dynamic range of protein concentrations in a sample. In addition, the considerable proteomic variance between individuals generally requires the analysis of multiple replicates in order to arrive at statistically robust results. Given that this puts a high demand on sample throughput, we asked how deep one might cover a human tissue proteome when using the HD-DDA approach and allowing a maximum of 1 day of measurement time. Two-hour turnaround HD-DDA analysis (90′ gradients, see above) of 50 μg total protein separated into 12 fractions by SDS-PAGE from each of eight human tissues led to the identification of between ∼3700 (pancreas) and ∼7500 (ovary) proteins and a total proteome coverage of ∼10,500 proteins (protein FDR of 0.4%; Fig. 4, supplemental Table S3) indicating that large-scale proteomics of human tissues is feasible using HD-DDA and a reasonable amount of time.
As a second example, we chose a phosphoproteomic experiment because the analysis of post-translational modifications (PTMs) is gaining more and more attention notably in signal transduction and drug discovery research (29). Depth and throughput are also key parameters here because the plasticity of signaling pathways requires deep sampling as well as perturbation or time course experiments (30). HD-DDA analysis of phosphopeptides enriched by IMAC from A431 skin carcinoma cells led to the identification of ∼8600 phosphorylation sites requiring only 5 h of instrument time. For ∼6600 of these, the phosphorylation site could be determined with better than 5% false localization rate (23), (Fig. 5A, supplemental Table S4). Among the identified phospho-proteins are kinases (e.g. EGFR, ABL1, and AKT1) as well as transcription factors (e.g. FOXO3, MYC, and IRF6) showing that HD-DDA analysis of phosphoproteomes provides considerable depth that should allow it to be applied more generally and easily to a whole range of research topics in the future.
A recent report has shown that TWIMS can improve the quantitative performance of isobaric mass tagging experiments (31, 32). Notably, the ion mobility separation of peptide precursor ions reduced the well described issue of co-isolation of peptides and the concomitant decrease in accuracy and precision of TMT quantification (33). In our setting in which TWIMS is applied to peptide fragment ions to enhance duty cycle and sensitivity in MS2 spectra, isobaric tagging is also an attractive application. As a proof-of-principle experiment, we used the HD-DDA method for a chemoproteomic experiment measuring the interaction of the small molecule drug Trichostatin A with its cellular target proteins in K562 myelogenous leukemia cells. Briefly, we immobilized the nonselective histone deacetylase (HDAC) inhibitor SAHA (suberoylanilide hydroxamic acid, Vorinostat, Fig. 5B) to Sepharose beads and performed pulldowns from lysates of K562 myelogenous leukemia cells. Following tryptic digestion and labeling by tandem mass tags (TMT), the labeled peptides showed a considerably higher reporter ion intensity in HD-DDA over DDA measurements (supplemental Fig. S6A) indicating the expected higher performance of HD-DDA in such applications too. We next used the SAHA beads to profile the interaction of the antibiotic and HDAC inhibitor Trichostatin A with proteins from K562 cells in a quantitative fashion. As reported before (19), SAHA beads capture HDACs class I (HDAC 1, 2, 3, and 8) and class II (HDAC 6 and 10). Competition of binding using increasing concentrations of Trichostatin A in lysates (illustrated in supplemental Fig. S6B) revealed the potent but differential interaction of Trichostatin A with HDAC1, 2, and 3 (low nm) over HDAC6 and 10 (mid nm; supplemental Fig. S6C). The same analysis also revealed co-purification and co-competition of members of the CoRest complex including HDAC1 and 2, LSD1, GSE1, RCOR 1, and 3 (Fig. 5B, supplemental Table S5). These results are in very close agreement with data obtained on the very same samples using a Q-Exactive instrument (19) showing that HD-DDA delivers quantitative data of high quality (supplemental Fig. S6D).
The above results show that the integration of ion mobility spectrometry into DDA acquisition schemes removes the long standing limitation of low duty cycles of Q-TOF instruments and leads to considerably improved sensitivity and productivity of proteomic analysis on such instruments. Although ion trap instruments may still offer higher absolute sensitivity owing to their ability to accumulate precursor ions to a desired level prior to fragmentation (a feature that is not available on Q-TOF instruments), TOF instruments have the potential for very fast data acquisition and high in-spectral dynamic range, both of which are highly desirable for the analysis of the very complex samples. The actual speed of HD-DDA in this first implementation of the method is ∼6–8 Hz, mainly owing to the time required for on-the-fly data processing within the instrument control software. However, we project that improvements to the software alone will increase speed to 15–20 Hz in the foreseeable future and the method as such has the potential to scale to 30–40 Hz further increasing the prospects of HD-DDA for the rapid and comprehensive analysis of complex proteomes.
Supplementary Material
Acknowledgments
We thank Michaela Kroetz-Fahning, Andreas Klaus, Barbara Ferreira da Silva and Andrea Hubauer for assistance with sample preparation.
Footnotes
Author contributions: D.H., J.P.V., C.J.H., A.G., K.R., J.W., J.I.L., and B.K. designed research; D.H., B.R., S.K.M., I.B., S.L., and M.B. performed research; J.P.V., C.J.H., A.G., J.W., and J.I.L. contributed new reagents or analytic tools; D.H., H.H., B.R., F.P., H.M., M.W., I.B., and B.K. analyzed data; D.H., H.H., B.R., and B.K. wrote the paper.
 This article contains supplemental Figs. S1 to S6 and Tables S1 to S5.
1 The abbreviations used are:
- LC-MS/MS
- Liquid chromatography-tandem mass spectrometry
- CID
- Collision induced dissociation
- DDA
- Data dependent acquisition
- ESI
- Electrospray ionization
- HDAC
- Histone deacetylase
- HD-DDA
- High definition data dependent acquisition
- oaTOF
- Orthogonal acceleration time-of-flight
- Q-TOF
- Quadrupole Time-of-flight
- SAHA
- Suberoylanilide hydroxamic acid
- TMT
- Tandem mass tags
- TWIMS
- Traveling wave ion mobility separation.
REFERENCES
- 1. Pinto S. M., Manda S. S., Kim M.-S., Taylor K., Selvan L. D. N., Balakrishnan L., Subbannayya T., Yan F., Prasad T. S. K., Gowda H., Lee C., Hancock W. S., Pandey A. (2014) Functional annotation of proteome encoded by human chromosome 22. J. Proteome Res. 13, 2749–2760 [DOI] [PMC free article] [PubMed] [Google Scholar]
- 2. Mallick P., Kuster B. (2010) Proteomics: a pragmatic perspective. Nat. Biotechnol. 28, 695–709 [DOI] [PubMed] [Google Scholar]
- 3. Hebert A. S., Richards A. L., Bailey D. J., Ulbrich A., Coughlin E. E., Westphall M. S., Coon J. J. (2013) The one hour yeast proteome. Mol. Cell. Proteomics 13, 339–347 [DOI] [PMC free article] [PubMed] [Google Scholar]
- 4. Hahne H., Pachl F., Ruprecht B., Maier S. K., Klaeger S., Helm D., Medard G., Wilm M., Lemeer S., Kuster B. (2013) DMSO enhances electrospray response, boosting sensitivity of proteomic experiments. Nat. Methods 10, 989–991 [DOI] [PubMed] [Google Scholar]
- 5. Pirmoradian M., Budamgunta H., Chingin K., Zhang B., Astorga-Wells J., Zubarev R. A. (2013) Rapid and deep human proteome analysis by single-dimension shotgun proteomics. Mol. Cell. Proteomics 12, 3330–3338 [DOI] [PMC free article] [PubMed] [Google Scholar]
- 6. Zubarev R. A., Makarov A. (2013) Orbitrap mass spectrometry. Anal. Chem. 85, 5288–5296 [DOI] [PubMed] [Google Scholar]
- 7. Andrews G. L., Simons B. L., Young J. B., Hawkridge A. M., Muddiman D. C. (2011) Performance characteristics of a new hybrid quadrupole time-of-flight tandem mass spectrometer (TripleTOF 5600). Anal. Chem. 83, 5442–5446 [DOI] [PMC free article] [PubMed] [Google Scholar]
- 8. Guilhaus M., Selby D., Mlynski V. (2000) Orthogonal acceleration time-of-flight mass spectrometry. Mass Spectrom. Rev. 19, 65–107 [DOI] [PubMed] [Google Scholar]
- 9. Hashimoto Y., Hasegawa H., Satake H., Baba T., Waki I. (2006) Duty cycle enhancement of an orthogonal acceleration TOF mass spectrometer using an axially-resonant excitation linear ion trap. J. Am. Soc. Mass Spectrom. 17, 1669–1674 [DOI] [PubMed] [Google Scholar]
- 10. Brenton A. G., Krastev T., Rousell D. J., Kennedy M. A., Craze A. S., Williams C. M. (2007) Improvement of the duty cycle of an orthogonal acceleration time-of-flight mass spectrometer using ion gates. Rapid Commun. Mass Spectrom. 21, 3093–3102 [DOI] [PubMed] [Google Scholar]
- 11. Giles K., Pringle S. D., Worthington K. R., Little D., Wildgoose J. L., Bateman R. H. (2004) Applications of a travelling wave-based radio-frequency-only stacked ring ion guide. Rapid Commun. Mass Spectrom. 18, 2401–2414 [DOI] [PubMed] [Google Scholar]
- 12. Chernushevich E. I. (2000) Duty cycle improvement for a quadrupole-time-of-flight mass spectrometer and its use for precursor ion scans. Eur. J. Mass Spectrom. 6, 417–479 [Google Scholar]
- 13. Shvartsburg A. A., Smith R. D. (2008) Fundamentals of traveling wave ion mobility spectrometry. Anal. Chem. 80, 9689–9699 [DOI] [PMC free article] [PubMed] [Google Scholar]
- 14. Pringle S. D., Giles K., Wildgoose J. L., Williams J. P., Slade S. E., Thalassinos K., Bateman R. H., Bowers M. T., Scrivens J. H. (2007) An investigation of the mobility separation of some peptide and protein ions using a new hybrid quadrupole/travelling wave IMS/oa-ToF instrument. Int. J. Mass Spectrom. 261, 1–12 [Google Scholar]
- 15. Wisniewski J. R., Zougman A., Mann M. (2009) Combination of FASP and StageTip-based fractionation allows in-depth analysis of the hippocampal membrane proteome. J. Proteome Res. 8, 5674–5678 [DOI] [PubMed] [Google Scholar]
- 16. Rappsilber J., Ishihama Y., Mann M. (2003) Stop and go extraction tips for matrix-assisted laser desorption/ionization, nanoelectrospray, and LC/MS sample pretreatment in proteomics. Anal. Chem. 75, 663–670 [DOI] [PubMed] [Google Scholar]
- 17. Villen J., Gygi S. P. (2008) The SCX/IMAC enrichment approach for global phosphorylation analysis by mass spectrometry. Nat. Protoc. 3, 1630–1638 [DOI] [PMC free article] [PubMed] [Google Scholar]
- 18. Wilm M., Shevchenko A., Houthaeve T., Breit S., Schweigerer L., Fotsis T., Mann M. (1996) Femtomole sequencing of proteins from polyacrylamide gels by nano-electrospray mass spectrometry. Nature 379, 466–469 [DOI] [PubMed] [Google Scholar]
- 19. Bantscheff M., Hopf C., Savitski M. M., Dittmann A., Grandi P., Michon A. M., Schlegl J., Abraham Y., Becher I., Bergamini G., Boesche M., Delling M., Dumpelfeld B., Eberhard D., Huthmacher C., Mathieson T., Poeckel D., Reader V., Strunk K., Sweetman G., Kruse U., Neubauer G., Ramsden N. G., Drewes G. (2011) Chemoproteomics profiling of HDAC inhibitors reveals selective targeting of HDAC complexes. Nat. Biotechnol. 29, 255–265 [DOI] [PubMed] [Google Scholar]
- 20. Brosch M., Yu L., Hubbard T., Choudhary J. (2009) Accurate and sensitive peptide identification with Mascot Percolator. J. Proteome Res. 8, 3176–3181 [DOI] [PMC free article] [PubMed] [Google Scholar]
- 21. Kall L., Canterbury J. D., Weston J., Noble W. S., MacCoss M. J. (2007) Semi-supervised learning for peptide identification from shotgun proteomics datasets. Nat. Methods 4, 923–925 [DOI] [PubMed] [Google Scholar]
- 22. van den Toorn H. W., Munoz J., Mohammed S., Raijmakers R., Heck A. J., van Breukelen B. (2011) RockerBox: analysis and filtering of massive proteomics search results. J. Proteome Res. 10, 1420–1424 [DOI] [PubMed] [Google Scholar]
- 23. Marx H., Lemeer S., Schliep J. E., Matheron L., Mohammed S., Cox J., Mann M., Heck A. J., Kuster B. (2013) A large synthetic peptide and phosphopeptide reference library for mass spectrometry-based proteomics. Nat. Biotechnol. 31, 557–564 [DOI] [PubMed] [Google Scholar]
- 24. Savitski M. M., Lemeer S., Boesche M., Lang M., Mathieson T., Bantscheff M., Kuster B. (2011) Confident phosphorylation site localization using the Mascot Delta Score. Mol. Cell Proteomics 10, M110 003830. [DOI] [PMC free article] [PubMed] [Google Scholar]
- 25. Wilhelm M., Kirchner M., Steen J. A., Steen H. (2012) mz5: space- and time-efficient storage of mass spectrometry data sets. Mol. Cell. Proteomics 11, O111 011379 [DOI] [PMC free article] [PubMed] [Google Scholar]
- 26. Kessner D., Chambers M., Burke R., Agus D., Mallick P. (2008) ProteoWizard: open source software for rapid proteomics tools development. Bioinformatics 24, 2534–2536 [DOI] [PMC free article] [PubMed] [Google Scholar]
- 27. Vizcaino J. A., Cote R. G., Csordas A., Dianes J. A., Fabregat A., Foster J. M., Griss J., Alpi E., Birim M., Contell J., O'Kelly G., Schoenegger A., Ovelleiro D., Perez-Riverol Y., Reisinger F., Rios D., Wang R., Hermjakob H. (2013) The PRoteomics IDEntifications (PRIDE) database and associated tools: status in 2013. Nucleic Acids Res. 41, D1063–D1069 [DOI] [PMC free article] [PubMed] [Google Scholar]
- 28. Michalski A., Cox J., Mann M. (2011) More than 100,000 detectable peptide species elute in single shotgun proteomics runs but the majority is inaccessible to data-dependent LC-MS/MS. J. Proteome Res, 10, 1785–1793 [DOI] [PubMed] [Google Scholar]
- 29. Olsen J. V., Mann M. (2013) Status of large-scale analysis of post-translational modifications by mass spectrometry. Mol. Cell. Proteomics 12, 3444–3452 [DOI] [PMC free article] [PubMed] [Google Scholar]
- 30. Phanstiel D. H., Brumbaugh J., Wenger C. D., Tian S., Probasco M. D., Bailey D. J., Swaney D. L., Tervo M. A., Bolin J. M., Ruotti V., Stewart R., Thomson J. A., Coon J. J. (2011) Proteomic and phosphoproteomic comparison of human ES and iPS cells. Nat. Methods 8, 821–827 [DOI] [PMC free article] [PubMed] [Google Scholar]
- 31. Thompson A., Schafer J., Kuhn K., Kienle S., Schwarz J., Schmidt G., Neumann T., Johnstone R., Mohammed A. K., Hamon C. (2003) Tandem mass tags: a novel quantification strategy for comparative analysis of complex protein mixtures by MS/MS. Anal. Chem. 75, 1895–1904 [DOI] [PubMed] [Google Scholar]
- 32. Shliaha P. V., Jukes-Jones R., Christoforou A., Fox J., Hughes C., Langridge J., Cain K., Lilley K. S. (2014) Additional precursor purification in isobaric mass tagging experiments by traveling wave ion mobility separation (TWIMS). J. Proteome Res. 13, 3360–3369 [DOI] [PubMed] [Google Scholar]
- 33. Savitski M. M., Mathieson T., Zinn N., Sweetman G., Doce C., Becher I., Pachl F., Kuster B., Bantscheff M. (2013) Measuring and managing ratio compression for accurate iTRAQ/TMT quantification. J. Proteome Res. 12, 3586–3598 [DOI] [PubMed] [Google Scholar]
Associated Data
This section collects any data citations, data availability statements, or supplementary materials included in this article.
Supplementary Materials
Data Availability Statement
The mass spectrometric raw files were converted into mz5 (25) format using ProteoWizard (26) (version 3.0.5245 64-bit). The mz5 files are available along with peaklist files (mgf format) and search result files (Scaffold files and Scaffold exported protein and peptide lists) via proteomeXchange (27) (http://www.proteomexchange.org; accession number PXD000863).